Posted on

When a Siemens LDS 6 Ammonia Slip Analyzer Shows Abnormal Readings, Distorted Transmission Values, and Repeated Fault Switching: A Complete Diagnostic Path from “Suspected Board Failure” to “Confirmed Optical Path Contamination”

In industrial flue gas monitoring systems, ammonia slip measurement is often treated as a “parameter problem.” If the displayed value is too high, people first suspect calibration. If an alarm appears, they check wiring. If the reading does not fall to zero after a fiber disconnection, they immediately suspect the main board or analog output. However, for a Siemens LDS 6 laser gas analyzer based on tunable diode laser absorption principles, this line of thinking can easily send troubleshooting in the wrong direction. The core reason is simple: this type of analyzer is not a conventional extractive instrument. It is a highly integrated in-situ optical measurement system whose stability depends simultaneously on the optical path, reference channel, laser driver, detector chain, internal signal processing, and system status logic. Once the optical path is contaminated, connector coupling degrades, or lens surfaces become dirty, the instrument may display symptoms that look exactly like board failure, even though the root cause is not in the electronics at all.

This article is based on an actual troubleshooting process involving a Siemens LDS 6 ammonia slip analyzer central unit. It focuses on several typical symptoms: excessively high readings, readings that remain after optical disconnection, abnormal transmission values, status bar fault switching, distorted diagnostic values, and apparent logic inconsistency. The investigation ultimately led to a clear conclusion: the root cause was not main board failure, not an acquisition or computation board defect, and not a permanently forced analog output. The real fault was optical contamination at fiber connectors, lenses, or related optical interfaces. After cleaning, the analyzer returned to normal operation.

This kind of case is highly valuable for maintenance engineers, instrument technicians, and process analysis specialists because it reveals a crucial truth: for an LDS 6, optical path integrity must be placed very high in the diagnostic priority list. If not, a technician can waste a great deal of time replacing boards, questioning software versions, or chasing output logic issues while ignoring the actual cause.
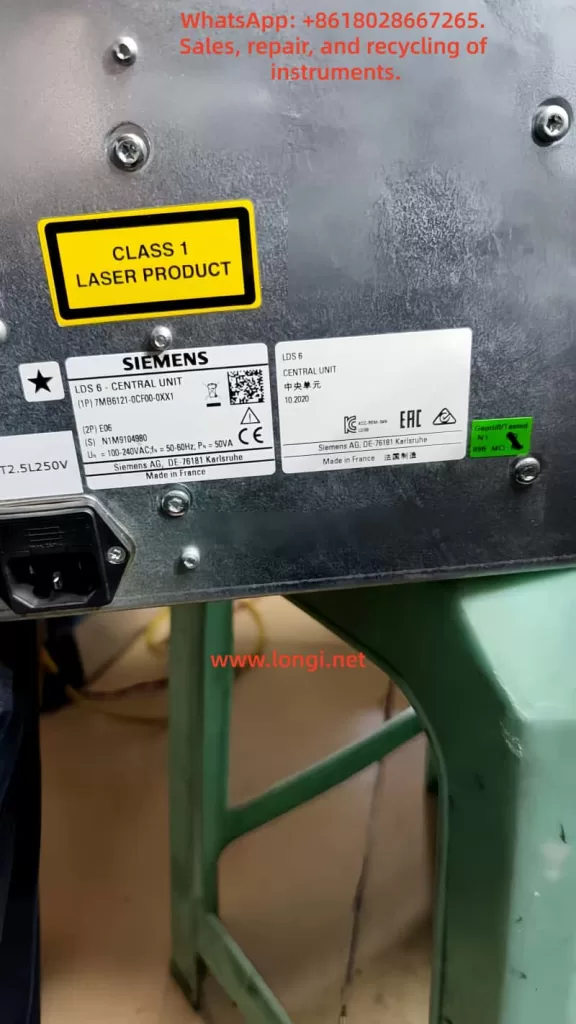
Rear label of Siemens LDS 6 central unit, model 7MB6121-0CF00-0XX1, showing Class 1 laser product warning and serial information

1. Why LDS 6 ammonia slip analyzer faults are so easily misdiagnosed

When field personnel encounter abnormal readings on an LDS 6, they usually think of two categories first.

The first is software or parameter problems. These include measurement range mismatch, compensation parameter errors, output hold states, unresolved function control, and other menu-related issues.

The second is electronic board failure. Typical suspicions include acquisition and computation board faults, frozen display values, forced analog output, unstable main controller operation, EEPROM issues, or FPGA problems.

These suspicions are not entirely unreasonable. However, they both rely on the same hidden assumption: that the optical chain is still basically healthy. Once that assumption is false, many symptoms that appear “electronic” are only secondary reflections of an optical fault.

The LDS 6 does not simply calculate concentration from a single analog input board. Its measurement result depends on the coordinated operation of the laser source, reference path, monitor path, field optical path, receiver channel, signal processing chain, and status logic. If any part of the optical coupling degrades, the analyzer may show several confusing behaviors:

  1. The measured concentration may become too high, too low, or fail to return to zero.
  2. The Diagnostics page may show severely distorted Absolute Transmission and Relative Transmission values.
  3. The status line may switch repeatedly among FAULT, Maintenance Request, CTRL, TR, and related states.
  4. The main screen may sometimes show 0.00 ppm, sometimes dashes, and sometimes a value that appears to remain active.
  5. The logbook may contain Transmission Limit alarms, Optomodule Fault messages, and temperature-compensation-related maintenance requests.

Once these symptoms overlap, it becomes very tempting to blame the main board, interface board, laser driver board, EEPROM, FPGA, or other complex hardware. In reality, contaminated optical components are among the most common ways to create exactly this kind of “it looks like the boards are bad” situation.
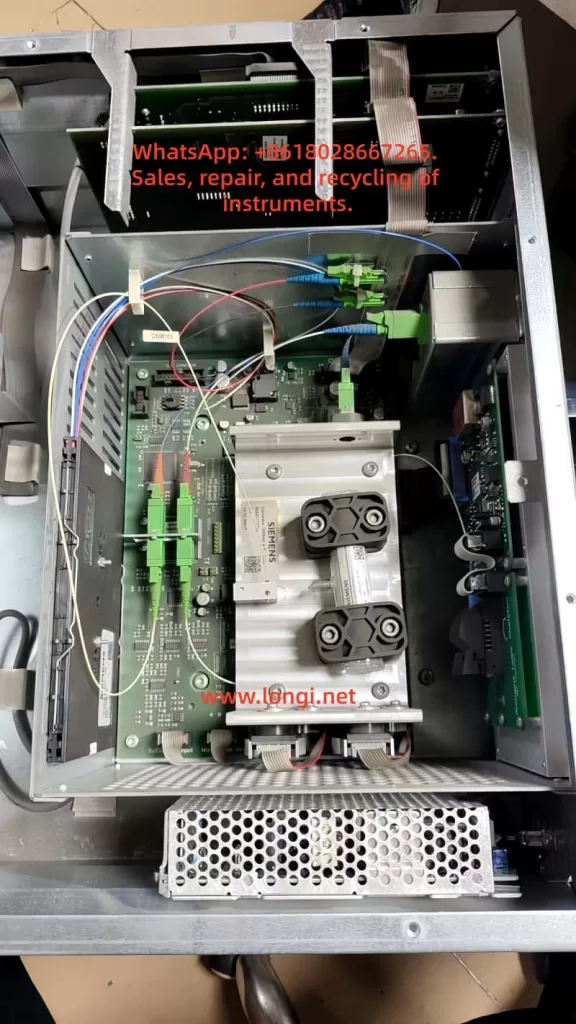
Internal view of Siemens LDS 6 ammonia analyzer central unit with optical modules, circuit boards, fiber connections, and power supply exposed

2. Why the fault initially looked like a board problem but actually pointed to the optical path

The initial field description claimed that under “normal absolute and relative transmission conditions,” the analyzer displayed a value that was too high. According to the manufacturer’s troubleshooting logic, once the fiber or optical path is disconnected, the analyzer should show no signal, a signal abnormality alarm, an overrange state, or zero. But in the field, the operator reported that the reading remained even after fiber disconnection. Based on that behavior, the instrument itself was suspected, followed by suspicion of the signal acquisition and computation board, or alternatively that the display value was locked and the analog output was being forced.

If one reads only that description, it is easy to move directly toward electronic boards or output logic. “The reading remains after disconnection,” “the value does not drop,” and “the concentration is too high” all sound like frozen acquisition data, display cache retention, or forced output.

However, once the investigation progressed, inconsistencies began to appear.

On one hand, after the unit arrived for repair and was powered without the complete field optical setup, the Diagnostics page showed extremely low Absolute Transmission and Relative Transmission, indicating almost no effective optical signal.

On the other hand, the customer later provided a historical field photo showing a very different condition: Absolute Transmission was high, and Relative Transmission had climbed all the way to 999.0%. This meant the analyzer had not always been in a simple “no light” state. At some earlier point, it had displayed a different kind of fault: one in which the transmission diagnostics had clearly run away or saturated.

These two conditions appear contradictory at first glance, but in fact they point to the same fundamental issue: the optical path condition was unstable, and optical coupling had already been severely disturbed by contamination or abnormal reflection.

When contamination is still moderate, the analyzer may continue to receive part of the signal, but the proportional relationship between reference and measurement channels becomes distorted. As a result, Relative Transmission may surge, saturate, or become physically unreasonable.

When contamination worsens further, optical coupling deteriorates rapidly, and the system approaches signal collapse. Then both Absolute and Relative Transmission may fall toward zero.

This explains why the same analyzer can show two apparently opposite failure modes over time: one that looks like a runaway diagnostic condition, and another that looks like complete optical loss.
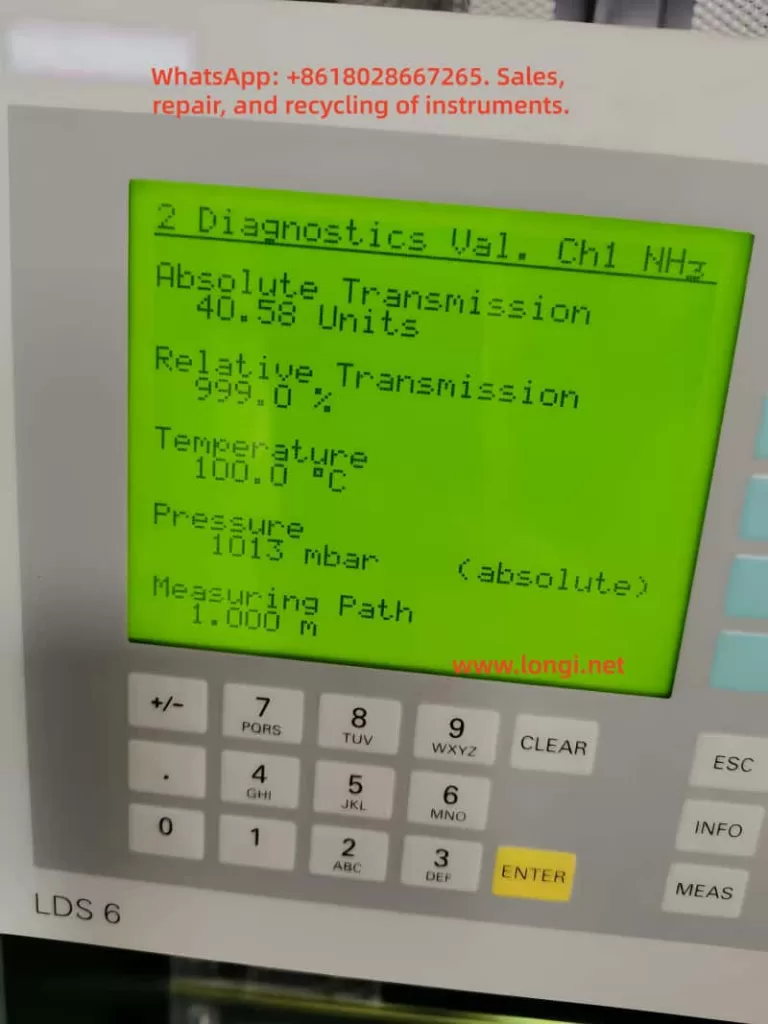
Siemens LDS 6 diagnostics screen for NH3 channel showing abnormal transmission values: Absolute Transmission 40.58 units and Relative Transmission 999.0 percent

3. Why “the reading remains after the fiber is disconnected” does not automatically mean board failure

This was one of the most misleading aspects of the case.

Many maintenance technicians are accustomed to treating “the input is gone but the reading remains” as direct evidence that an acquisition board is bad, a cache is not cleared, or software has frozen. On ordinary analog instruments, that reasoning can sometimes be valid. On an LDS 6, however, the word “reading” must first be broken into categories:

  1. The concentration value on the main display.
  2. The diagnostic values such as Absolute Transmission and Relative Transmission.
  3. The analog output signal transmitted to PLC or DCS.
  4. A retained or filtered engineering value shown in the upper control system.

When field personnel say “the reading remains,” they are often not referring to the LCD main value at all. They may be referring to a DCS value that did not immediately drop, or a trend value that remained on the upper-level system. In a complex analyzer, this can be related to output hold strategy, fault delay behavior, function control logic, or simply the fact that the disconnected element was not the decisive optical path segment.

The most important point is that the unit received for repair was not a complete field system. It was primarily the central unit. Once the central unit is separated from the field sensor, hybrid cable, and actual measurement path, many assumptions that are valid in the field are no longer valid on the repair bench. In other words, what the customer observed in the complete field configuration and what the technician observed from a stand-alone central unit are not the same test condition.

Therefore, such statements are useful clues, but they cannot be treated as direct proof of board failure.
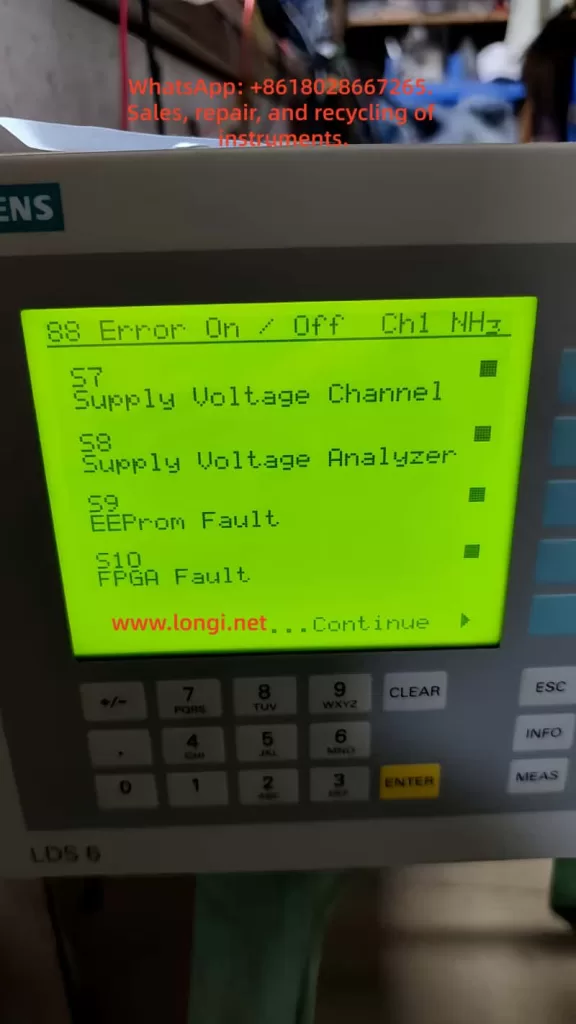
Siemens LDS 6 error configuration screen for NH3 channel showing enabled fault items including supply voltage, EEPROM fault, and FPGA fault

4. Why Diagnostics must be checked before assuming a hardware board defect

For a laser gas analyzer like the LDS 6, the most valuable page is usually not the main menu but the Diagnostics Values page. The concentration displayed on the home screen is already the final result of an algorithm. Diagnostics is much closer to the underlying physical state.

In this case, the parameters that actually clarified the direction were:

  • Absolute Transmission
  • Relative Transmission
  • Temperature
  • Pressure
  • Measuring Path

The two transmission values were the most important. The reason is straightforward: if the laser chain, reference chain, receiver chain, and field optical path are healthy, transmission should not collapse toward zero, nor should Relative Transmission rush to 999.0% and remain there. Once these values become either extremely low or obviously saturated, troubleshooting should return immediately to the optical path rather than diving straight into main boards and menu parameters.

In this case, later comparison with a donor unit under no external optical connection also showed low transmission on both units. This reinforced an important point: when no external optical path is connected, low transmission can be physically reasonable and cannot by itself be used as a fault verdict.

What actually has diagnostic value is not a single number, but the broader behavior:

  1. Under identical no-light conditions, which unit is more stable?
  2. Does the unit repeatedly switch among FAULT, Maintenance Request, CTRL, and TR states?
  3. Does Diagnostics behave in a significantly more abnormal way under identical conditions?
  4. After cleaning the optical path, do the transmission values return to a more realistic condition?

This is why the breakthrough ultimately did not come from board replacement, but from cleaning the optical interfaces.
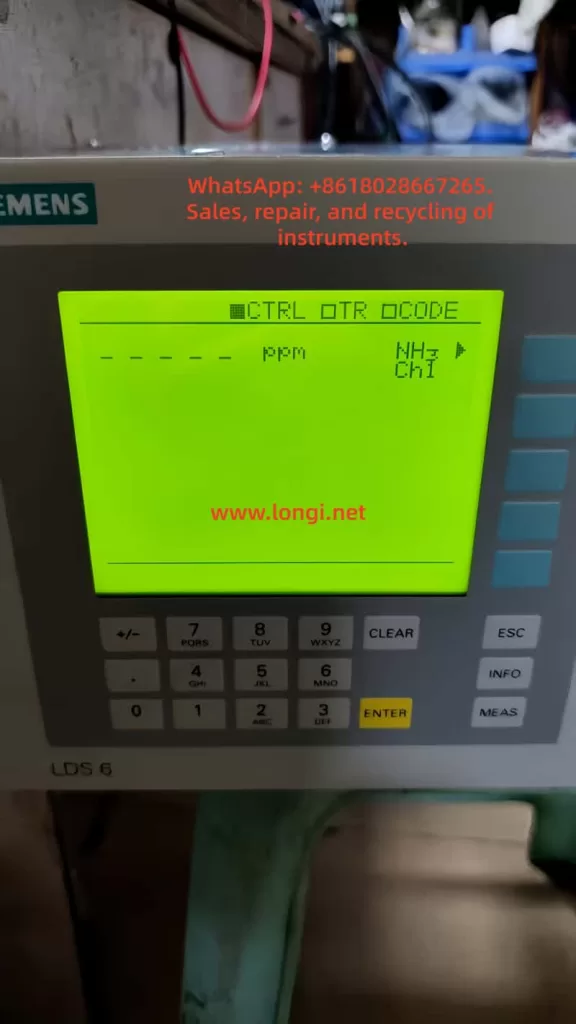
Siemens LDS 6 NH3 channel display showing CTRL OTR OCODE status with dashed measurement output instead of a valid ppm reading

5. Why optical contamination can create such complex fault behavior

Many people underestimate how destructive contamination can be in a laser gas analyzer.

In ordinary electronic equipment, dirt may simply affect cooling or appearance. In an in-situ laser analyzer, even light contamination can alter spot quality, incident angle, reflection characteristics, and optical coupling efficiency.

Typical contamination points include:

  1. Fiber connector end faces.
  2. External optical windows.
  3. Lens surfaces on transmitter or receiver optics.
  4. Internal optical coupling or collimation interfaces.
  5. Long-term deposits such as dust films, process residue, oily contamination, or condensate.

Once contamination occurs at these locations, several kinds of changes can follow.

5.1 Optical power attenuation

The most direct result is a reduction in received signal strength, causing Absolute Transmission to fall.

5.2 Spot distortion and increased scattering

Contamination does not always simply “block light.” It can distort the beam shape and alter the optical path, causing the ratio between reference and measurement channels to become unreliable. Relative Transmission may therefore surge abnormally or saturate.

5.3 Unstable coupling efficiency

Connector contamination is often not a fixed attenuation but an unstable coupling problem. The signal may improve and worsen unpredictably. This causes the analyzer to switch among normal, maintenance request, and fault states, making the problem look like software instability.

5.4 Triggering of upper-level diagnostic logic

The analyzer only knows that the underlying optical conditions are not acceptable. It may not immediately distinguish whether the cause is a dirty lens, contaminated connector, degraded coupling, or board damage. Therefore, it may switch among Transmission Limit, Optomodule Fault, Maintenance Request, and related states.

This fully explains why the same instrument in this case could show one phase with transmission collapse, another phase with runaway transmission values, and a repeating sequence of status changes. All of these can originate from the same class of optical contamination problem.
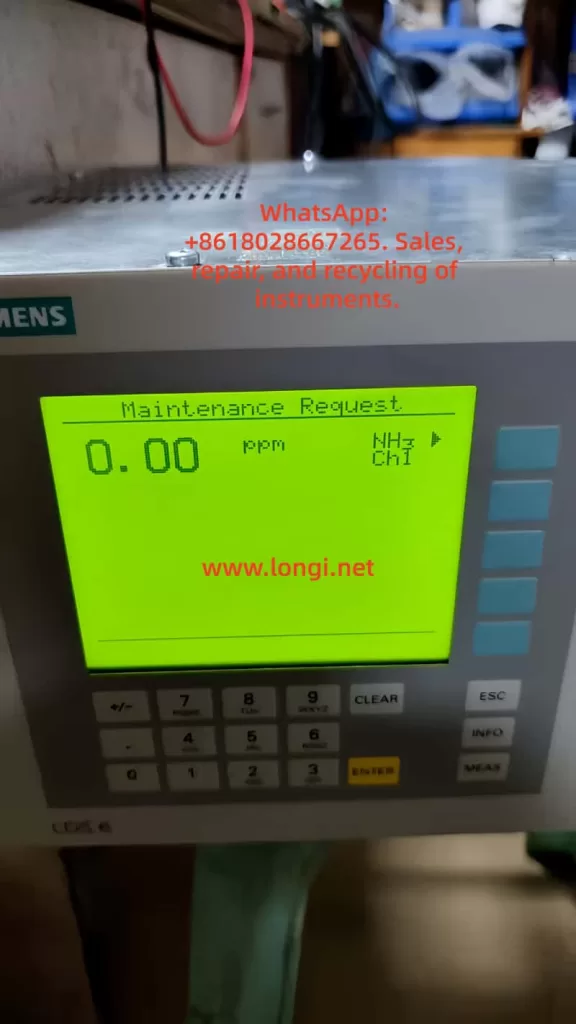
Siemens LDS 6 main screen showing Maintenance Request status for NH3 channel with a displayed value of 0.00 ppm

6. Why the donor unit comparison helped, but did not replace root cause analysis

A donor central unit was also introduced during troubleshooting. At first, the idea was to determine which analyzer was “good” and which was “bad” by comparing their displayed values. However, the analysis gradually revealed something more important:

  • A donor unit cannot be judged healthy solely because its transmission value is low under no external optical path; low transmission can be normal in that condition.
  • The donor unit becomes useful mainly as a comparative reference under identical no-light conditions.
  • If the donor unit remains stable while the customer unit repeatedly enters FAULT or Maintenance Request states, then the customer unit clearly has additional instability.
  • But even if the donor unit appears more stable, this does not eliminate the need to inspect the customer unit’s optical path for contamination.

In the end, the donor unit served mainly as a comparative tool. It helped establish a critical boundary condition: low transmission under no external optical path must not automatically be interpreted as a fault. That insight was essential in preventing a wrong conclusion.

7. The turning point: from “prepare to replace boards” to “cleaning restores normal operation”

The decisive turning point in this case was not complicated, but it was highly representative. After extensive menu analysis, board identification, donor comparison, and video-based state analysis, attention returned to the most fundamental part of the system: the optical path.

The actual findings were straightforward:

  • Fiber connectors were contaminated.
  • Lenses or related optical surfaces were dirty.
  • After cleaning, the analyzer returned to normal.

This means that all of the earlier symptoms that looked so much like board problems were simply the system-level consequences of an optical chain disturbance.

This conclusion is extremely valuable for maintenance practice because it suggests a revised troubleshooting priority:

When an LDS 6 shows abnormal readings, state switching, or distorted transmission values, optical cleaning and interface inspection should be placed ahead of blind board substitution.

8. A practical standard troubleshooting sequence for this type of fault

Based on this case, a more reliable troubleshooting order for an LDS 6 can be summarized.

Step 1: Define the test condition clearly

First determine:

  • Is this a complete field system fault, or only a central unit on the bench?
  • Is the external sensor connected?
  • Is the actual field optical path complete?
  • Does the customer’s “reading” refer to the local display, Diagnostics, or PLC/DCS engineering value?

If this is not clarified first, all later interpretation becomes mixed and unreliable.

Step 2: Check Diagnostics before assuming board failure

Focus on:

  • Absolute Transmission
  • Relative Transmission
  • Whether they are near zero
  • Whether they are abnormally high or saturated
  • Whether the values are physically consistent with the actual setup

Low transmission is not automatically a fault. Relative Transmission at 999.0% is certainly not normal.

Step 3: Observe state behavior

State stability often matters more than one isolated numeric value. If the analyzer repeatedly jumps among FAULT, Maintenance Request, CTRL, TR, and related states under unchanged conditions, an underlying instability exists.

Step 4: Inspect and clean the optical path first

This should include:

  • Fiber connector end-face cleaning
  • Lens and window cleaning
  • Optical coupling surface inspection
  • Checking for dust, residue, oily films, or process deposits
  • Rechecking Diagnostics after cleaning

Step 5: Consider board comparison and donor substitution only after optical cleaning

Only after optical path cleanliness has been confirmed should board substitution become a meaningful next step. Otherwise, a healthy donor board may be inserted into a contaminated optical system, leading to further misinterpretation.

9. How to explain the result to the customer professionally

Customer communication in this kind of case also matters. Many customers become convinced very early that “the main board is bad” or “the program is corrupted.” If the final explanation is too casual, such as “it was just dirty,” they may underestimate the difficulty of the work.

A proper explanation should be framed like this:

  1. The fault belongs to the optical chain category, not merely a parameter issue.
  2. Contamination of the fiber connector, lens, or related optical interface caused abnormal optical coupling, distorted transmission diagnostics, status alarms, and measurement abnormalities.
  3. This type of fault can easily imitate board-related symptoms and requires combined analysis of Diagnostics, state behavior, and optical inspection.
  4. After cleaning, the system returned to normal, which shows that the main board was not fundamentally damaged.

This wording remains technically accurate while properly reflecting the value of the diagnostic work.

10. Conclusion: for a laser analyzer, always return first to the light itself

The most important lesson from this case is not the exact name of a board, nor whether a donor unit should have been purchased. The most important lesson is a basic maintenance principle:

When troubleshooting a laser analyzer, think about the optical path before thinking about the board.

When an instrument shows:

  • excessively high readings,
  • abnormal behavior after disconnection,
  • distorted diagnostic values,
  • repeated fault switching,
  • transmission values that sometimes collapse and sometimes run away,

none of these symptoms automatically prove failure of the main board, acquisition board, or output board.

In many cases, the real cause is simply contamination at fiber connector end faces, dirty lenses, contaminated windows, or degraded optical coupling.

Once a technician forgets that the device is fundamentally a laser optical analyzer and starts treating it like an ordinary electronic instrument, the diagnostic path quickly moves away from the real cause.

In this case, the investigation began with suspicion of board failure. It then progressed through menu analysis, state comparison, donor-unit testing, and behavior comparison before finally returning to the optical path itself. Cleaning restored normal operation. That sequence proves something highly important:

The most complex fault symptoms may originate from the simplest optical contamination.

For third-party maintenance specialists, the true value of this case is not merely that “cleaning fixed it.” The true value lies in establishing a more reliable diagnostic logic:

define the test condition first,
check Diagnostics next,
evaluate state stability,
prioritize optical path inspection and cleaning,
and only then proceed to board substitution.

That is the diagnostic discipline required to troubleshoot an LDS 6 effectively, minimize wrong turns, and produce repair conclusions that withstand technical scrutiny.
Posted on

Troubleshooting Low Gas Flow and Abnormal Curves in an SBI Single Burning Item Test System: A Practical Analysis of Sampling Lines, Filter Contamination, Condensation, and Pump Degradation

The SBI Single Burning Item test is widely used to evaluate the fire reaction performance of building products, insulation materials, decorative boards, composite panels, and other construction-related materials. It is not a simple ignition test. Instead, it is a complete fire performance test system that combines a combustion chamber, burner, exhaust duct, smoke measurement, gas sampling system, gas analyzer, temperature and pressure measurement, flow calculation, and data acquisition software.

In an SBI test, the final report and software curves depend heavily on the stability of the gas sampling and gas analysis system. In many field service cases, the gas analyzer can power on normally, the O₂, CO₂, and CO sensors appear normal in the software, and the analyzer screen may still show reasonable readings. However, the customer may still report two typical problems:

The gas flow is too low.

The test curves or software graphs are abnormal.

This type of fault is often misjudged as a failed gas sensor, a software problem, or a calibration error. In many real cases, the root cause is not the sensor itself, but the sampling gas path: blocked filters, contaminated tubes, poor condensation drainage, weak sampling pump, dirty valve seats, blocked flowmeters, branch imbalance, or outlet back pressure.

This article analyzes this type of failure from an engineering maintenance perspective and explains how to diagnose low gas flow and abnormal SBI test curves systematically.

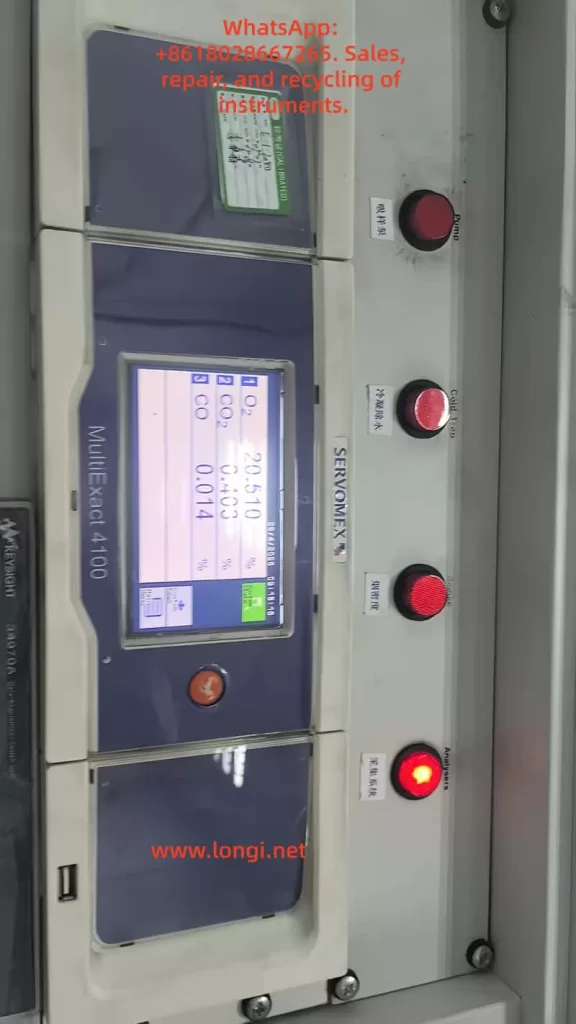
Servomex MultiExact 4100 gas analyzer showing O2, CO2, and CO readings in an SBI single burning item test system

1. The Role of the Gas Analysis System in an SBI Test

During an SBI test, combustion products are collected by the exhaust system. A portion of the exhaust gas is drawn through the sampling line and sent to the gas analyzer after filtration, condensation, drying, and flow regulation.

The gas analyzer normally measures:

O₂ concentration;

CO₂ concentration;

CO concentration.

These values are not only displayed for reference. They are key input signals for the SBI software. The software uses oxygen consumption, carbon dioxide generation, carbon monoxide generation, exhaust flow, pressure, temperature, and smoke data to calculate the dynamic combustion behavior of the tested material.

Typical calculated parameters may include:

Heat release rate;

Total heat release;

Smoke production rate;

Total smoke production;

FIGRA;

SMOGRA;

Gas concentration trends.

The O₂ channel is especially important because many heat release calculations are closely related to oxygen consumption. If the O₂ sampling flow is low, delayed, diluted, or unstable, the calculated heat release curve will be distorted. The CO₂ and CO channels are also important because they reflect combustion products and combustion completeness.

Therefore, the gas analyzer system must satisfy several conditions at the same time:

The sampling flow must reach the required value.

The gas path must be free from blockage.

The sampling line must not leak.

The filters must not be overloaded.

The condenser and drainage system must work properly.

The sampling pump must provide sufficient suction.

The O₂, CO₂, and CO channels must have normal response times.

The gas transport delay must be stable.

The calibration gas and sample gas switching path must be correct.

The outlet must be free from blockage and excessive back pressure.

If any of these conditions fail, the sensor may still show a normal status, but the final SBI test curve may still be wrong.

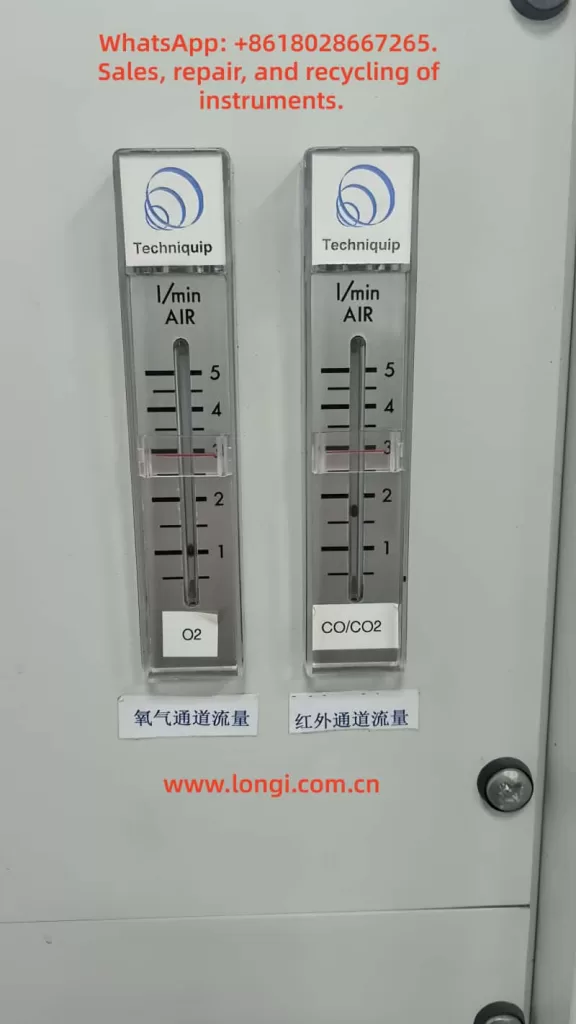
O2 and CO/CO2 channel flowmeters showing low gas sampling flow in an SBI combustion test analyzer cabinet

2. Typical Fault Symptoms

When the SBI gas sampling system has a flow problem, the following symptoms are commonly seen:

The flowmeter float cannot reach the red target line.

The O₂ channel flow is too low.

The CO/CO₂ channel flow is too low.

When the front sampling line is disconnected, one channel rises but the other channel does not change much.

A small filter becomes dirty again only a few days after replacement.

Black dots, yellow stains, tar marks, or rust-like particles appear on the filter.

Transparent tubes become yellow, brown, or hard.

The sampling pump makes noise, but the actual flow is still insufficient.

The gas analyzer display shows O₂, CO₂, and CO values, but the dynamic response is slow.

The software curve is delayed, flattened, or unstable.

Peak values are too low.

The test image or graph does not match the expected combustion process.

Zero and span calibration may appear successful, but real test results remain abnormal.

The gas values recover very slowly after the test.

Test repeatability is poor.

These symptoms usually indicate a gas path problem rather than a simple sensor failure.

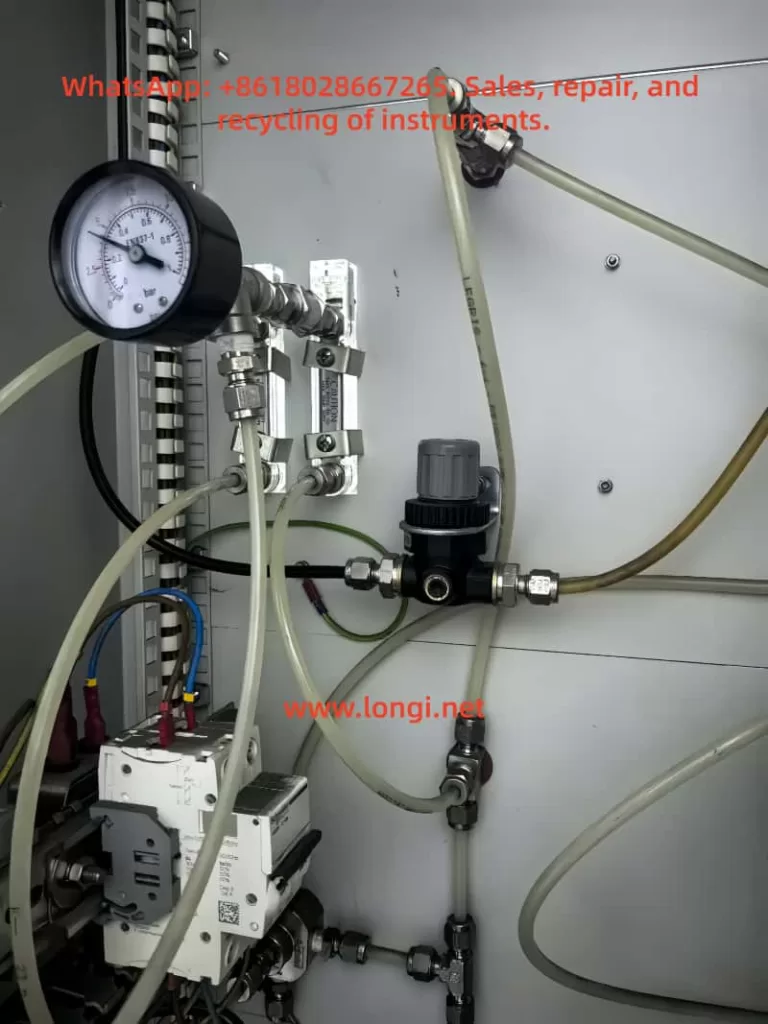
Internal gas regulation and pneumatic tubing section of an SBI gas analysis system with pressure gauge, flow controls, and sampling lines

3. Why Normal Sensor Status Does Not Mean Normal Test Results

A common field mistake is to judge the whole system only by the sensor status in the software. If the software shows that the O₂, CO₂, and CO sensors are normal, the user may assume that the gas analysis system is healthy. This is not correct.

Sensor status usually means that the sensor circuit has no obvious electrical alarm, the signal is not out of range, communication is normal, and the current static reading can be obtained. However, an SBI test requires dynamic gas data. During combustion, gas concentrations change rapidly. The analyzer must receive the gas sample at the correct flow rate and with a predictable response time.

If the sampling flow is low, several problems occur.

First, the gas takes longer to reach the analyzer. The combustion event occurs in the test chamber, but the gas analyzer receives the concentration change too late. The curve shifts in time.

Second, the gas replacement inside the tubes, filters, condenser, and analyzer cell becomes slow. Old gas remains in the system, while new gas enters slowly. This produces a tailing effect and slows the response.

Third, the peak value is reduced. A combustion peak may last for only a short time. If the sampling system responds too slowly, the peak is mixed, delayed, and damped before reaching the sensor. The software then sees a lower peak than the real one.

Fourth, different gas channels may have different delays. For example, if the O₂ channel is slow and the CO₂ channel is faster, the software receives mismatched signals. This phase difference can distort calculated heat release and gas curves.

Fifth, calibration becomes misleading. Under low-flow conditions, static zero and span readings may still be adjusted, but the dynamic response during a real fire test remains wrong.

Therefore, troubleshooting an SBI gas analysis system must separate two concepts:

Sensor electrical status;

Gas sampling and dynamic response condition.

A normal sensor does not prove that the gas path is normal. A stable static reading does not prove that the dynamic test curve is reliable.

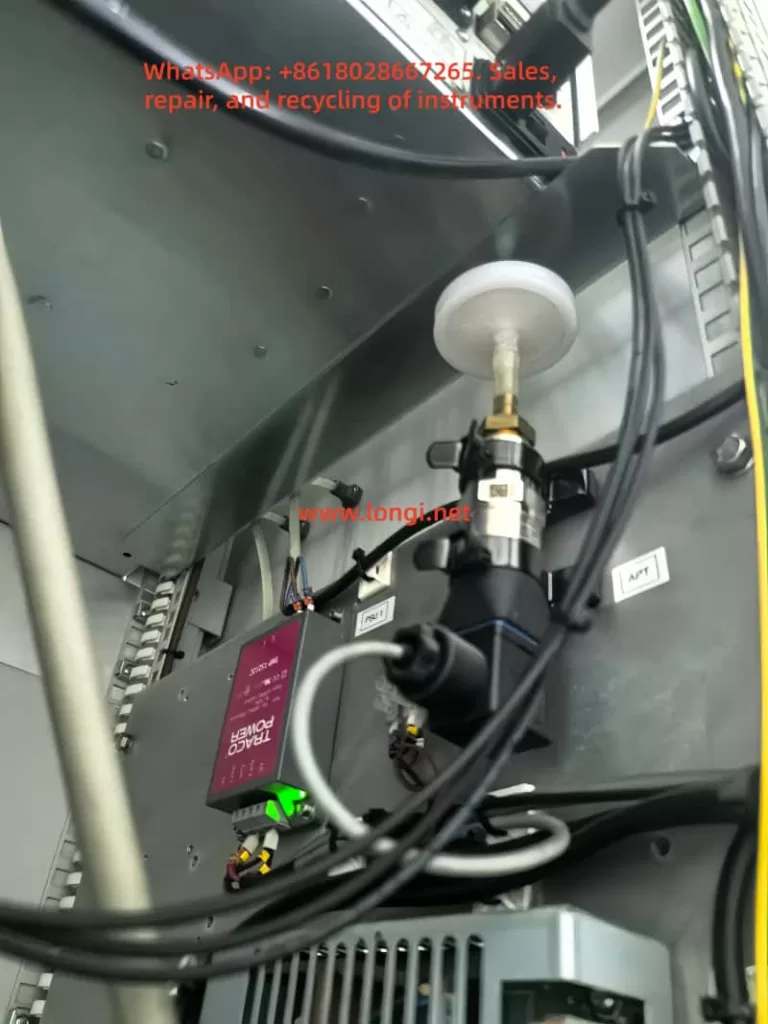
Inline gas filter and pneumatic valve assembly inside an SBI gas analyzer cabinet for sample gas conditioning

4. How to Interpret the Flowmeter Reading

Many SBI gas analysis cabinets have separate flowmeters for the O₂ channel and the CO/CO₂ channel. A red line is often marked on the flowmeter, indicating the required target flow. In some systems, this target may be around 3 L/min, but the exact value must follow the equipment specification and calibration setting.

When reading the flowmeter, several points should be noted:

The red line is not the actual flow; it is only a target reference.

The actual flow must be read from the float position.

Both channels should be close to the target and stable.

If one channel is obviously low, that branch may be blocked, restricted, leaking, affected by weak suction, or suffering from outlet back pressure.

If both channels are low, the common sampling pump, common gas path, front filter, condenser, or exhaust path may be faulty.

If the flow rises after disconnecting the front sampling line, the front gas path has high resistance.

If the flow does not rise after disconnecting the front sampling line, the problem is more likely inside that branch, inside the analyzer gas path, at the flowmeter, at the gas cell, at the pump side, or at the outlet.

A typical example is this: after disconnecting the front sampling line and allowing the analyzer to draw ambient air, the CO/CO₂ flow rises, but the O₂ flow does not change much. This means the CO/CO₂ channel still has suction capacity and is mainly affected by front-end resistance. However, the O₂ channel likely has an internal restriction, such as a blocked O₂ filter, needle valve, flowmeter, analyzer cell inlet, restrictor, outlet tube, or internal branch tube.

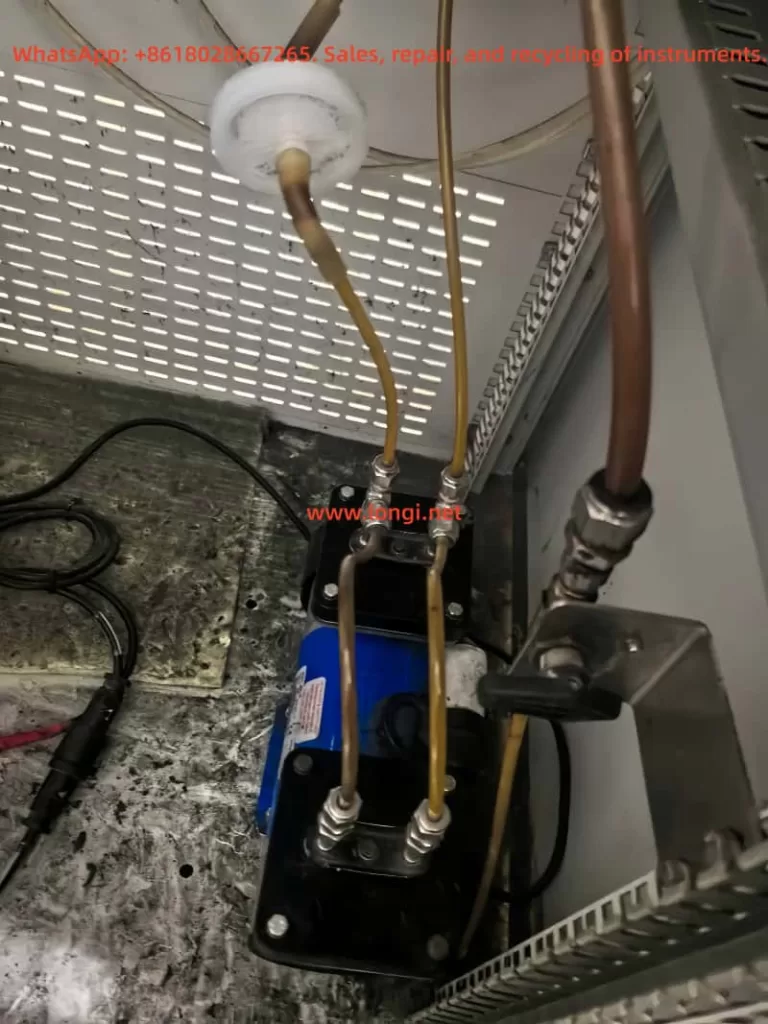
Sampling pump and contaminated yellow gas tubing inside an SBI single burning item test gas analysis system

5. What It Means When a Small Filter Becomes Dirty Again Quickly

If a small gas filter was replaced only a few days ago and already shows black dots, yellow stains, brown marks, or rust-like particles, this is not normal. It means there is still a contamination source upstream of the filter.

The contamination may come from several sources.

The first source is soot from combustion exhaust. SBI testing often involves building materials, insulation boards, decorative panels, plastic composites, or organic materials. These materials can generate soot during combustion. If the front coarse filter is not effective, soot particles will reach the downstream fine filter.

The second source is tar and organic condensate. When hot combustion gases cool down, organic vapors may condense into yellow-brown or black sticky substances. These deposits attach to tube walls, filters, pump heads, and gas cells.

The third source is water carrying contaminants. Combustion gas contains water vapor. If the condenser or drainage system does not work well, moisture can carry soot, soluble compounds, and acidic contaminants downstream.

The fourth source is metal oxide or rust powder. If metal sampling tubes, fittings, condenser parts, or other metal components are exposed to moisture for a long time, oxidation particles may be carried by the gas flow.

The fifth source is pump wear debris. If a diaphragm pump has operated for a long time with wet and dirty gas, its diaphragm, valve plates, or seals may degrade and produce black particles.

For this reason, replacing only the small filter does not solve the root cause. The upstream contamination source must be found. Otherwise, the new filter will become dirty again quickly, and the flow will drop again.

6. The Meaning of Yellowed or Hardened Transparent Tubes

SBI gas sampling systems often use transparent or semi-transparent tubes. A clean gas path should have relatively clear tubing, without visible deposits. If the tubes are yellow, brown, blackened, or hardened, it usually means that smoke, moisture, tar, or other contaminants have passed through them for a long time.

Contaminated tubes create several problems:

Deposits reduce the effective inner diameter.

Tar increases gas adsorption and causes response tailing.

Soot and particles can detach during operation and contaminate new filters.

Hardened tubing may lose sealing performance at fittings.

Tube bends and low points may accumulate water.

Partial collapse or deformation can reduce flow.

In many service cases, replacing only the filter is not enough. If the old tubes remain contaminated, the system will continue shedding particles and tar residue. For an SBI smoke sampling system, visibly yellowed or hardened tubes should usually be replaced, especially around the pump inlet, pump outlet, condenser outlet, filter inlet, O₂ branch, and CO/CO₂ branch.

7. A Sampling Pump That Makes Noise May Still Be Faulty

The sampling pump is one of the most important parts of the SBI gas analysis system. A common field misunderstanding is that if the pump makes noise, the pump is good. This is wrong.

A diaphragm pump or micro gas pump may still run electrically but fail to provide sufficient suction or flow.

Common pump problems include:

Aged diaphragm;

Cracked diaphragm;

Valve plate stuck by tar;

Water inside the pump head;

Soot and tar inside the pump chamber;

Aged sealing ring;

Partially blocked inlet or outlet fitting;

High outlet back pressure;

Reduced motor speed;

Worn pump chamber and poor volumetric efficiency.

Pump weakness may appear as:

Both channels have low flow.

Blocking the sampling inlet does not change the pump sound much.

Disconnecting the front line does not restore flow.

The flow is unstable.

The software curve is slow and flat.

Filters and tubes have been replaced, but flow is still insufficient.

The correct way to test the pump is to isolate it. Disconnect the pump inlet from the front sampling system and let the pump draw ambient air directly. If the flow returns to the target value, the pump is probably able to work, and the blockage is upstream. If the flow remains low even when the pump draws directly from ambient air, the problem is likely in the pump head, diaphragm, valve plates, downstream branch, outlet, or internal gas path.

8. Condenser and Drainage Problems Are Very Common

Combustion exhaust contains water vapor. Before the gas enters the analyzer, it usually must be cooled, condensed, and dried. If the condenser is not working properly, the drain pump fails, the drain bottle is full, the water separator is blocked, or condensate is carried downstream, the gas sampling system will become unstable.

Typical signs of condensation or drainage problems include:

The small filter is wet.

Water droplets appear in transparent tubes.

The flowmeter float fluctuates.

The flow suddenly drops.

Water accumulates at low points in the tubing.

The filter changes color quickly.

CO₂ and CO response becomes slow.

O₂ reading recovers slowly.

Water enters the pump head.

The software curve becomes unstable.

A water blockage can be difficult to find. It may not completely block the gas path. Instead, it creates unstable resistance. Sometimes the flow looks acceptable, but when a water droplet moves to a fitting, valve, or low point, the flow suddenly decreases.

Therefore, every low point in the tubing must be checked. The sampling line should not form a water trap. The condenser temperature, drain pump operation, drain bottle condition, water separator, dryer, and downstream filter dryness should all be confirmed.

If a downstream filter is wet, replacing the filter alone is not enough. The condenser and drainage problem must be corrected first.

9. Key Inspection Points for Low O₂ Channel Flow

The O₂ channel is critical in SBI testing. If the O₂ flow is low, the final calculated curve may be seriously wrong even if CO₂ and CO values still change.

When the O₂ channel flow is low, inspect the following parts:

O₂ channel small filter;

O₂ branch needle valve;

Internal blockage inside the needle valve;

O₂ flowmeter float;

Fittings before and after the O₂ flowmeter;

O₂ analyzer cell inlet;

Small restrictor or capillary at the cell inlet;

Contamination inside the O₂ cell;

O₂ outlet tube;

Outlet back pressure;

Internal soft tube deformation or collapse;

Leakage in the O₂ branch;

Weak suction in the O₂ branch.

If the O₂ flow does not rise after the external sampling line is disconnected, the problem is not mainly in the front sampling probe. It is more likely inside the O₂ branch itself. The best approach is to disconnect the O₂ flowmeter inlet and observe whether the float rises. Then disconnect the flowmeter outlet to determine whether the restriction is before the flowmeter, inside the flowmeter, or after the flowmeter.

10. Key Inspection Points for Low CO/CO₂ Channel Flow

The CO/CO₂ channel often passes through an infrared measurement section or related analyzer cell. It is also sensitive to flow, moisture, and contamination.

When the CO/CO₂ flow is low, inspect the following areas:

Sampling probe blockage;

Smoke coarse filter blockage;

Condenser water accumulation;

Drain bottle blockage;

Water separator blockage;

Dryer failure;

CO/CO₂ small filter blockage;

CO/CO₂ needle valve blockage;

Infrared gas cell inlet contamination;

CO/CO₂ outlet back pressure;

Water accumulated at tube low points;

Yellowed tubing with internal deposits.

If the CO/CO₂ flow rises after the front sampling line is disconnected, the channel is not completely blocked. The main resistance is likely upstream. However, this does not mean the internal channel is perfectly clean, because long-term contamination may have already entered the downstream section.

11. Do Not Ignore Outlet Blockage and Back Pressure

Many technicians focus only on the inlet side of the gas path. However, outlet blockage can also reduce inlet flow.

Outlet problems include:

Bent exhaust tube;

Compressed outlet tube;

Outlet connected to the wrong port;

Stuck check valve;

Condensate inside the exhaust tube;

Blocked outlet filter;

Excessive back pressure;

Cross-interference between different channel outlets.

If the analyzer outlet is restricted, the sampling pump cannot discharge gas smoothly. As a result, the inlet flow decreases. In a multi-channel gas analyzer, a blocked outlet in one branch may cause low flow, slow response, and ineffective flow adjustment in that branch.

Therefore, both inlet and outlet paths must be inspected during troubleshooting.

12. Section-by-Section Testing Is the Most Effective Method

When an SBI gas analysis system has low flow, guessing is not efficient. The most effective diagnostic method is section-by-section isolation.

A recommended procedure is as follows.

First, record the current flow of both channels.

Record the actual float positions of the O₂ and CO/CO₂ flowmeters. Confirm how far they are from the target red line.

Second, disconnect the analyzer inlet and let it draw ambient air.

If the flow rises significantly, the front sampling system has high resistance. If the flow remains low, the problem is likely inside the analyzer branch, pump path, outlet, or pump itself.

Third, disconnect the pump inlet and let the pump draw ambient air directly.

If the flow returns to normal, the blockage is before the pump. If the flow remains low, suspect the pump, pump outlet, downstream branch, or exhaust path.

Fourth, check the pump outlet.

If the pump outlet has poor discharge or high pressure, inspect the pump head, valve plates, diaphragm, and outlet back pressure.

Fifth, reconnect the condenser, filters, and probe one section at a time.

After reconnecting each section, observe the flow. If the flow drops sharply after one section is connected, the blockage or resistance is in that section or upstream of it.

Sixth, test the O₂ and CO/CO₂ branches separately.

Do not only test the common line. Each branch may have its own needle valve, filter, flowmeter, analyzer cell, and outlet.

Seventh, perform an inlet blocking test.

When the system is running, block the sampling inlet. Under normal conditions, the flow should quickly drop close to zero, and the pump sound should change. If the flow does not drop clearly, there may be a leak. If the pump sound does not change, the pump may be weak or the blocked point may not be in the effective suction path.

This method quickly separates the problem into front sampling system, pump, analyzer internal branch, or outlet.

13. How Gas Leaks Affect SBI Curves

Apart from blockage, leakage is another common problem. The upstream side of the sampling pump is usually under negative pressure. If a fitting, tube, filter housing, condenser seal, drain bottle, three-way valve, or solenoid valve leaks, ambient air will be sucked into the sample line.

Leakage can cause:

Sample gas dilution;

Lower CO₂ peak;

Lower CO peak;

Weak O₂ decrease;

Flattened curves;

Lower calculated heat release;

Poor repeatability;

Normal calibration but abnormal real test curves.

Leakage does not always cause low flow. In some cases, the flowmeter may look normal because the pump is drawing air, but the air is not the correct smoke sample. This is more dangerous because the operator may assume that the flow is acceptable, while the concentration data is already diluted.

Leak detection methods include:

Blocking the sampling inlet and checking whether the flow drops to zero;

Checking positive-pressure fittings with soap solution;

Using smoke or alcohol vapor near negative-pressure fittings and observing reading changes;

Inspecting aged or cracked tubes;

Checking filter housing O-rings;

Checking quick fittings;

Checking condenser and drain bottle seals.

14. Why Calibration Should Not Be Done Before Flow Is Restored

When abnormal curves appear, some operators immediately perform zero and span calibration. This is the wrong sequence if the gas flow is abnormal.

Calibration requires clean, stable, sufficient gas flow. If the gas path is blocked, leaking, wet, slow, or unstable, the calibration may be misleading.

Under poor flow conditions, calibration can cause several problems:

It may compensate for a gas path fault as if it were a sensor offset.

The calibration process becomes slow and unstable.

Standard gas may be diluted by leakage.

The zero point may drift.

The span may appear correct in static mode but fail during dynamic testing.

The software curve remains abnormal after calibration.

The correct sequence is:

Restore the gas path.

Confirm the correct flow.

Confirm no leakage.

Confirm normal response time.

Then perform zero and span calibration.

15. Recommended Repair Plan

For SBI gas analysis systems with low flow, dirty filters, contaminated tubes, and abnormal curves, the following repair plan is recommended.

First, replace visibly contaminated tubes.

Any transparent tube that is yellow, hardened, brown, blackened, or internally contaminated should be replaced, especially around the pump inlet, pump outlet, filter inlet, condenser outlet, O₂ branch, and CO/CO₂ branch.

Second, replace or clean the front coarse filter.

If the front coarse filter is ineffective, the downstream fine filter will become dirty very quickly. The smoke sample must be properly filtered before reaching the pump and analyzer.

Third, inspect the condenser and drainage system.

Confirm that the condenser cools properly, the drain pump works, the drain bottle is not blocked, the water separator is clean, and no water reaches the downstream filter.

Fourth, inspect the sampling pump.

Check the diaphragm, valve plates, pump head, seals, inlet fittings, and outlet fittings. If water, tar, or black powder is found in the pump head, clean or rebuild the pump. If pump capacity is weak, replace the pump.

Fifth, clean the O₂ branch.

Inspect the O₂ needle valve, filter, flowmeter, analyzer cell inlet, restrictor, outlet, and internal tubes. If O₂ flow adjustment has little effect, a blockage or outlet restriction is likely.

Sixth, clean the CO/CO₂ branch.

Inspect the infrared gas cell inlet, CO/CO₂ filter, needle valve, outlet, and front condensation/filtration system.

Seventh, check all fittings for leakage.

Inspect quick connectors, compression fittings, filter housings, three-way valves, solenoid valves, condenser connections, and drain bottle seals.

Eighth, reorganize tubing layout.

Avoid low points that collect water. Avoid sharp bends. Avoid unnecessarily long tubes. Make sure cabinet doors, cable ducts, or brackets do not press on tubes.

Ninth, perform a response test after flow is restored.

Introduce clean air or standard gas and observe the time required for O₂, CO₂, and CO readings to change and stabilize. The response time should be stable and consistent with equipment requirements.

Tenth, perform zero and span calibration only after the gas path is confirmed.

Calibration after restoring proper flow is meaningful. Calibration before restoring flow is not reliable.

16. Verification After Repair

After repair, do not judge the system only by whether there is some flow. The following points should be confirmed:

The O₂ channel reaches the target flow.

The CO/CO₂ channel reaches the target flow.

Both flow readings are stable.

Blocking the sampling inlet causes the flow to drop quickly.

Disconnecting the inlet and drawing ambient air produces reasonable flow behavior.

The small filter does not become dirty again immediately.

No water droplets are visible in the transparent tubes.

The sampling pump runs smoothly.

O₂, CO₂, and CO readings recover normally.

Standard gas response time is normal.

Software curves show reasonable peak timing and recovery.

Repeated tests are stable.

Only after these checks pass can the SBI gas analysis system be considered reliable again.

17. Conclusion

In an SBI Single Burning Item test system, the gas analysis system is a critical part of the measurement chain. When the equipment shows low gas flow and abnormal software curves, the first suspicion should not be the sensor alone. A gas analyzer may still display O₂, CO₂, and CO values, and the software may still report normal sensor status, but the sampling flow, gas path cleanliness, pump capacity, condensation drainage, and dynamic response may still be wrong.

When the flowmeter cannot reach the target red line, a newly replaced filter becomes dirty again within a short time, transparent tubes turn yellow, the pump makes noise but the flow is low, or one channel rises after disconnecting the front line while another channel does not, the fault should be investigated from the gas sampling path.

Common root causes include blocked filters, water blockage, soot and tar contamination, aged tubing, weak sampling pump diaphragm, stuck pump valve plate, blocked O₂ branch needle valve, excessive CO/CO₂ channel resistance, contaminated gas cell inlet, outlet back pressure, and leakage in the negative-pressure line.

The correct troubleshooting strategy is:

Restore gas flow first.

Then check response time.

Then perform calibration.

Finally verify the SBI software curves.

Section-by-section testing is the most effective diagnostic method. By isolating the sampling probe, condenser, filters, pump inlet, pump outlet, analyzer branches, and exhaust outlet, the technician can quickly determine whether the fault is in the front sampling system, the pump, the internal analyzer branch, or the outlet path.

For an SBI gas sampling system that has been contaminated by combustion smoke for a long time, replacing only the small filter is usually not enough. Contaminated tubes must be replaced, the condenser and drainage system must be cleaned, the sampling pump must be inspected, the O₂ and CO/CO₂ branches must be cleared, low-point water traps must be eliminated, and outlet restrictions must be removed.

Only when both gas channels return to the specified flow, the O₂, CO₂, and CO response times are normal, and the software curves are stable can the SBI test result be considered trustworthy.

Posted on

Troubleshooting Vacuum Equipment That Cannot Pump Down: A Systematic Analysis from Mechanical Pumps and Valve Lines to MKS Pressure Measurement Systems

Vacuum equipment is widely used in laboratory instruments, thin-film deposition systems, gas analysis platforms, material processing equipment, surface treatment systems, semiconductor processes, leak testing devices, vacuum drying systems, and small research platforms. Although many vacuum systems appear mechanically simple, usually consisting of a mechanical pump, vacuum chamber, valves, flexible hoses, pressure sensors, pressure readouts, and several gas ports, the fault known as “unable to pump down” is one of the most common and most easily misdiagnosed problems in the field.

A typical symptom is that the vacuum pump starts normally, the equipment makes an operating sound, and the indicator lights on the control panel are illuminated, but the pressure reading does not decrease to the expected range. In some cases, the pressure remains at several hundred mbar, tens of kPa, or several hundred Torr. In other cases, the displayed value does not change at all. Sometimes the pressure drops slightly at first and then stops at an intermediate value. In some systems, the pump is clearly running, but the pressure remains close to atmospheric pressure.

When this happens, many operators immediately assume that the vacuum pump is faulty. However, field repair experience shows that pump failure is only one possibility. In many cases, the real problem is caused by valve position, gas line configuration, chamber sealing, sensor power supply, pressure readout channel selection, unit setting, range configuration, pneumatic valve actuation, or electrical interlock logic.

Taking a small vacuum system equipped with an MKS PDR-C-2C pressure readout, MKS capacitance manometer, Edwards/Trivac mechanical pump, several manual valves, and pneumatic valves as an example, if the front panel displays around “+512.9” and the system cannot continue pumping down, it is not correct to conclude directly that the vacuum pump is damaged. This reading may mean that the real chamber pressure is still around half an atmosphere. It may also be caused by an incorrect pressure readout channel, unclear unit selection, sensor power supply fault, signal wiring error, or a pressure gauge that is not actually connected to the active chamber volume. Vacuum faults must be diagnosed as system-chain problems, not as isolated component faults.

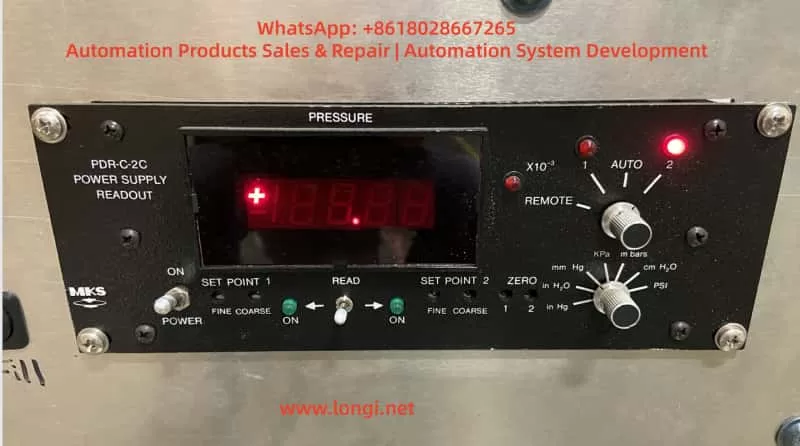
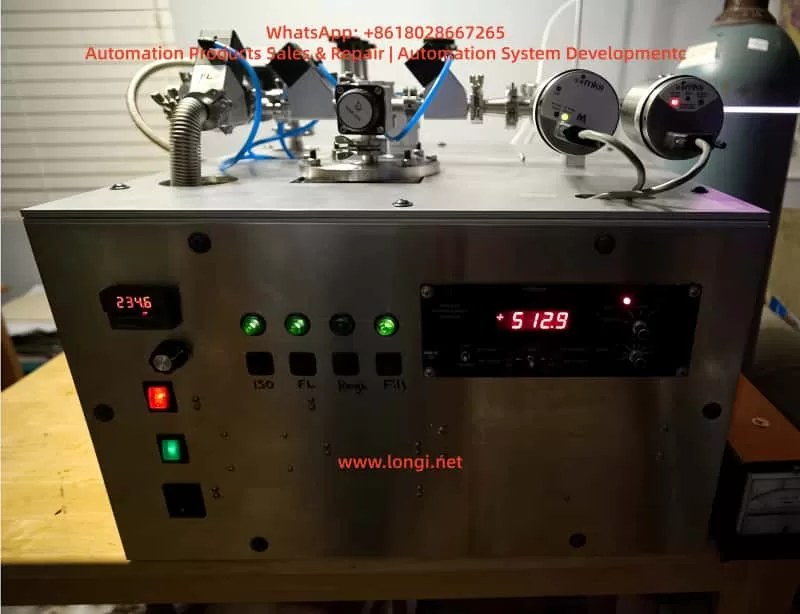
MKS PDR-C-2C pressure readout front panel displaying vacuum pressure, with channel selector, unit selector, set point controls, and illuminated channel indicator on a vacuum equipment control system.

1. Basic Structure and Fault Chains in a Vacuum System

A typical small vacuum system usually consists of several functional sections.

The first section is the pumping unit. This may be an oil-sealed rotary vane mechanical pump, dry pump, diaphragm pump, scroll pump, or another roughing pump. In small laboratory systems, pumps from Edwards, Leybold, Pfeiffer, Alcatel, Busch, and similar manufacturers are common. The pump is responsible for bringing the chamber down from atmospheric pressure to the rough vacuum range. It is the basic pumping source of the system.

The second section is the chamber and piping. This includes the vacuum chamber, KF flanges, CF flanges, flexible bellows, hoses, blanking plates, centering rings, O-rings, viewports, feedthroughs, and various fittings. The chamber and piping determine whether the system can seal properly and whether the effective pumping speed of the pump can actually reach the chamber.

The third section is the valve system. This includes roughing valves, isolation valves, vent valves, process gas inlet valves, bypass valves, protection valves, and pneumatic valves. Valves determine whether the gas path is open or closed. Whether the pump is truly pumping the chamber does not depend only on whether the pump motor is running. It depends on whether the correct valves between the pump and the chamber are actually open.

The fourth section is the pressure measurement system. This includes capacitance manometers, Pirani gauges, thermocouple gauges, cold cathode gauges, ion gauges, pressure transducers, pressure readouts, and signal acquisition circuits. A pressure readout such as the MKS PDR-C-2C not only displays pressure, but also supplies power to the pressure sensor and receives its output signal. If the sensor wiring, power supply, range setting, channel selection, or unit selection is incorrect, the displayed pressure may not represent the real chamber pressure.

The fifth section is the control and interlock system. This includes power supplies, relays, PLCs, push buttons, indicator lamps, solenoid valves, compressed air supply, door switches, emergency stop circuits, water flow protection, and software control logic. In some systems, even if the pump is running, the main valve may not open because an interlock condition is not satisfied. The final symptom is still the same: the equipment cannot pump down.

Therefore, a vacuum pump-down failure is not a single-point problem. It is a complete system-chain problem. The correct diagnostic sequence should start with the question: Does the pump have basic suction capability? Then determine whether the pump is actually connected to the chamber. Then check whether the chamber leaks. Finally, verify whether the pressure reading is trustworthy.

Laboratory vacuum equipment front view with MKS pressure readout, digital temperature controller, indicator lights, vacuum valves, pneumatic tubing, and pressure sensors mounted on the top panel.

2. An Abnormal Pressure Display Does Not Automatically Mean Pump Failure

The pressure display on most vacuum equipment comes from a pressure sensor, not directly from the pump. The number on the screen only proves that the measurement system is outputting a value. It does not prove the actual condition of the pump.

For example, an MKS PDR-C-2C pressure readout may have front-panel channel selection, unit selection, and range-related display functions. If the current display is CH2 but the actual pressure sensor is connected to CH1, the displayed number has little diagnostic value. If the unit selector position is unclear, the same number may represent mbar, kPa, mmHg, inHg, psi, or cmH2O. These units correspond to very different physical pressures.

If the panel displays “+512.9” and the unit is mbar, the pressure is approximately 512.9 mbar, which is close to half an atmosphere. For a normal mechanical pump connected to a small, sealed chamber, this is too high. Under normal conditions, the pressure should quickly decrease from atmospheric pressure to tens of mbar, a few mbar, or even lower. If the pressure remains around 500 mbar for a long time, the system may have a serious leak, a closed roughing valve, an open vent valve, disconnected gas path, weak pump, or faulty pressure measurement chain.

However, if the unit is not mbar, if the decimal point/range setting is wrong, or if the readout is displaying the wrong channel, the number “512.9” may be misleading. Repair personnel must always distinguish between real pressure and displayed pressure. Real pressure should be verified through pump inlet testing, an independent vacuum gauge, sectional pump-down testing, and pressure sensor analog output measurement. Displayed pressure must be verified by checking channel selection, unit setting, range setting, sensor power, and signal wiring.

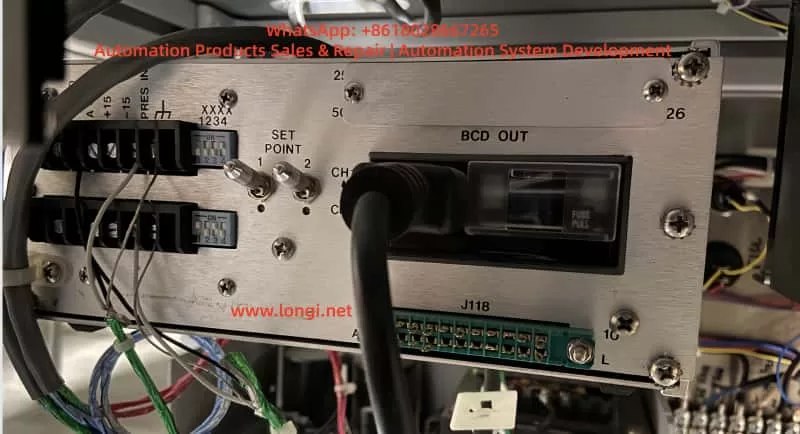
Rear panel of an MKS PDR-C-2C pressure readout showing CH1 and CH2 sensor wiring terminals, set point switches, BCD output connector, fuse holder, and rear interface connections.

3. The First Diagnostic Step: Check Whether the Mechanical Pump Can Pump

The first practical step in troubleshooting a vacuum system is to isolate and test the mechanical pump. This means temporarily disconnecting the pump from the full system piping and directly testing the pump inlet. This separates pump faults from system gas-line faults.

If the pump inlet is directly blanked off or connected to an independent vacuum gauge and still cannot produce a meaningful vacuum, the fault is likely inside the pump. Common mechanical pump problems include insufficient oil, emulsified oil, contaminated oil, worn vanes, damaged exhaust valve plates, stuck inlet valves, worn pump chamber, failed coupling, abnormal motor speed, incorrect motor rotation, and internal sealing failure.

For an oil-sealed rotary vane pump, oil quality is critical. The oil is not only a lubricant but also part of the sealing mechanism between the rotor and pump chamber. Darkened oil, emulsified oil, oil contaminated with solvent, water, or particles can seriously reduce ultimate vacuum.

If the pump inlet test is normal, the pump has basic pumping capability. At that point, the diagnostic focus should shift to the system gas path, valves, chamber sealing, and pressure measurement system. Many misdiagnoses happen because the pump inlet was never tested separately. A good pump may be wrongly judged as defective, leading to unnecessary oil changes, pump disassembly, or replacement, while the real fault is simply an open vent valve or a roughing valve that never opened.

The value of the pump isolation test is that it quickly defines the fault boundary. If the pump cannot pump at its own inlet, the pump is the issue. If the pump can pump at its inlet but not when connected to the equipment, the system is the issue. If the real system pressure is normal but the display is abnormal, the instrument chain is the issue.

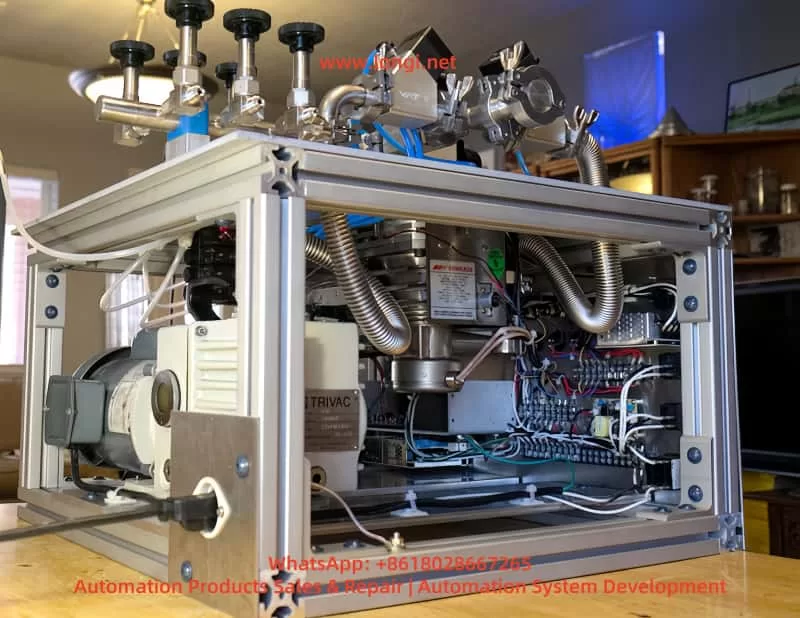
Open-frame laboratory vacuum system with Edwards mechanical vacuum pump, Trivac pump assembly, stainless steel bellows, pneumatic valves, wiring terminals, and vacuum chamber piping.

4. Valve and Gas Line Errors Are High-Frequency Causes

In a multi-valve vacuum system, the fact that the pump is running does not mean that the chamber is being evacuated. The mechanical pump must be connected to the chamber through an open roughing path. If the roughing valve is closed, a pneumatic valve has not actuated, an isolation valve is blocking the measurement branch, or the vent valve is open, the pressure will not decrease correctly.

The roughing valve is the main valve between the mechanical pump and the chamber. If it is not open, the pump may only be evacuating a short section near the pump inlet while the main chamber remains close to atmospheric pressure. If the equipment panel shows a “Pump” indicator but the “Rough” valve has not actuated, the operator may believe the system is pumping down, while in reality the chamber is isolated.

The vent valve is another common source of failure. Its function is to introduce air or gas into the chamber when venting the system. If the vent valve is not fully closed, the mechanical pump will pump continuously while air enters the chamber. The pressure may drop slightly from atmospheric pressure but then stabilize at several hundred mbar or tens of kPa. Internal leakage of the vent valve can produce the same symptom: the handle appears closed, but the internal seal is worn, contaminated, or not seating correctly.

Process gas inlet valves can also be overlooked. Many vacuum systems have nitrogen, argon, air, oxygen, or other process gas ports. If an inlet valve is not closed, or if a regulator, needle valve, or mass flow controller leaks internally, gas continues entering the system and prevents proper pump-down.

Pneumatic valve systems add another layer of complexity. Vacuum systems with blue air tubes often use compressed air to actuate valves. A pneumatic valve needs both an electrical command and sufficient compressed air pressure. If compressed air is not connected, pressure is too low, an air tube is inserted incorrectly, the solenoid coil does not energize, or the valve spool is stuck, the valve will not physically open. The panel indicator may look normal, but the gas path may not switch as expected.

The key to diagnosing valve-related faults is to establish a gas path logic diagram. The pump inlet, roughing valve, main chamber, pressure sensor, vent port, process gas inlet, and exhaust path must all be identified. Without this logic diagram, randomly rotating valves or pressing buttons may make the system state even more confusing.

5. System Leaks Can Make Pressure Stop at an Intermediate Range

If the mechanical pump is normal and the gas path is open, but the pressure still cannot decrease properly, leakage becomes the main suspect. Leaks can be divided into large leaks and small leaks. A large leak usually prevents the system from entering the normal rough vacuum range. The pump remains under a high gas load, and the pressure stays at several hundred mbar, tens of mbar, or another intermediate value. A small leak usually allows the system to reach a lower pressure but prevents it from achieving the specified ultimate vacuum, or causes the pressure to rise too quickly after the pump is stopped.

Common leak points include chamber covers, O-rings, KF clamps, blanking plates, bellows, manual valves, pneumatic valves, feedthroughs, viewports, pressure gauge ports, and unused fittings. A displaced O-ring, dusty sealing surface, aged seal, loose flange, misaligned centering ring, or insufficient clamp force can all create a serious leak. On frequently opened laboratory equipment, missing or incorrectly installed seals are very common.

KF fittings require special attention. KF flanges seal through a centering ring, O-ring, and external clamp. If the centering ring is not centered, the O-ring is squeezed out, or the clamp is not fully tightened, the fault may not be obvious by visual inspection, but the system will not pump down. Any unused KF port without a blanking plate can become a direct large leak to atmosphere.

Bellows and hoses can also leak in hidden ways. Stainless steel bellows may fatigue and crack after repeated bending. Hose fittings may loosen after equipment movement. If the mechanical pump vibrates significantly, piping joints can gradually loosen over time.

The pressure gauge port itself may also be a leak source. Many pressure sensors are installed on chamber sidewalls or branch lines. If the sensor flange seal is poor, it can both distort the pressure reading and introduce a leak.

Leak checking should proceed from obvious to hidden and from large to small. A large leak does not require immediate helium mass spectrometer testing. Sectional blanking, staged pump-down, clamp inspection, O-ring reseating, unused port blanking, and gently pressing chamber covers while observing pressure response can locate many large leaks quickly. Helium leak testing or residual gas analysis is usually needed only after the system can reach a reasonable vacuum but still fails to meet its final specification.

6. The Pressure Sensor Location Determines Whether the Reading Is Meaningful

The measurement point in a vacuum system is critical. A pressure gauge does not necessarily measure the main chamber pressure. It measures the pressure at the location where it is installed. If there is an isolation valve, restriction, blocked line, or closed valve between the gauge and the chamber, the reading may not represent the chamber at all.

For example, if the pressure sensor is installed on a branch line and that branch valve is closed, the pressure readout may show only the trapped pressure in the sensor branch. The chamber may already be evacuated while the gauge reading remains unchanged. Conversely, the gauge branch may be evacuated while the main chamber remains at atmospheric pressure because the main valve is closed. This type of misdiagnosis is common in multi-valve systems.

Therefore, when pressure readings are abnormal, the sensor location must be confirmed. The pressure sensor must be connected to the active pumping path. One practical method is to open and close the relevant valve while observing whether the pressure reading responds immediately. If valve operation produces no pressure response, the sensor may not be connected to the active gas path, the gauge inlet may be blocked, the valve may not have moved, or the sensor may not be responding.

During repair, it is often useful to temporarily connect an independent vacuum gauge near the main chamber and compare it with the built-in MKS reading. If the independent gauge shows normal pump-down while the MKS reading does not change, the fault is probably in the pressure measurement chain. If both gauges fail to decrease, the problem is still in the pump, valves, or leakage.

7. Diagnostic Focus for the MKS PDR-C-2C Pressure Readout System

The MKS PDR-C-2C is a common pressure readout used with capacitance manometers. It normally supplies power to the pressure sensor and displays the returned pressure signal. Its rear connections may include positive and negative power, pressure signal input, analog ground, chassis ground, and channel-related wiring. The dual-channel version can read CH1 and CH2 pressure sensors. The front-panel channel selector, unit selector, and indicator lights directly affect the displayed value.

When diagnosing an MKS pressure measurement system, the following points should be checked carefully.

First, confirm the active display channel. If the CH2 indicator is lit, the display is reading the CH2 input. If the actual sensor is connected to CH1, the current reading may be invalid. During troubleshooting, the channel selector should be fixed to the channel that is actually wired. AUTO or REMOTE mode should not be used initially because it can create confusion.

Second, confirm the pressure unit. Pressure units may include mbar, kPa, mmHg, inHg, psi, and cmH2O. The same numerical value represents different physical pressures under different units. During diagnosis, one unit should be fixed, preferably mbar or kPa.

Third, confirm the range and decimal point settings. Rear-panel DIP switches or internal settings may be associated with sensor full-scale range and decimal display. If a 1000 Torr full-scale sensor is displayed using a setting intended for 10 Torr or 100 Torr, the numerical display will be wrong. The readout range must match the sensor range.

Fourth, measure the sensor power supply. Capacitance manometers usually require stable bipolar power. Loss of +15 V or -15 V can cause abnormal output. Low voltage, excessive ripple, or poor grounding can also create drift or fixed readings.

Fifth, measure the pressure signal input. Many pressure transducers output a 0–10 V analog signal corresponding to 0 to full-scale pressure. The signal voltage should change between atmospheric pressure, pump-down, and venting. If the real pressure changes but the signal voltage remains fixed, the problem may be the sensor, wiring, or the gas path connected to the sensor.

Sixth, check signal ground and shielding. Analog pressure signals require a correct reference ground. A wrong ground, broken shield, or signal cable routed together with noisy power wiring can cause unstable, shifted, or fixed readings.

Seventh, check the readout itself. Older PDR readouts may suffer from aged power supply capacitors, oxidized terminals, poor channel switch contacts, damaged input amplifiers, display board faults, DIP switch contact problems, and cracked solder joints. If the sensor output voltage is normal but the display does not follow the signal, the readout electronics should be investigated.

The key principle is that the displayed number is only the final result. Sensor power and analog signal voltage are the real evidence for determining whether the pressure measurement chain is functioning.

8. What It Means When Pressure Stops Around 500 mbar

A pressure reading that remains around 500 mbar is diagnostically useful. It indicates that the system is not completely unchanged, but that pumping capacity and gas load may have reached an equilibrium. Common causes include the following.

The roughing path may be restricted. A roughing valve may be partly open, a valve spool may be stuck, a line may be blocked, an inlet filter may be clogged, or the pump inlet may be restricted. The pump is running, but the effective pumping speed at the chamber is too low.

A vent or inlet path may not be closed. A partially open vent valve, leaking process gas inlet valve, open needle valve, or leaking mass flow controller can continuously introduce gas and stabilize pressure at an intermediate level.

The chamber may have a large leak. A damaged O-ring, loose clamp, missing blanking plate, cracked bellows, or leaking viewport can make the pump continuously draw in air.

The mechanical pump performance may be degraded. Emulsified oil, worn vanes, damaged valve plates, or internal pump leakage can allow the pump to create some negative pressure but prevent further pressure reduction.

The pressure sensor display may be wrong. Incorrect channel selection, unclear unit setting, wrong decimal point setting, signal wiring error, or a fixed sensor output can make the readout appear stable at a misleading value.

A pneumatic valve may not be actuating. The control system may start the pump, but the main valve may not open, so the pump is not actually evacuating the chamber.

An equipment interlock may not be satisfied. Door switches, emergency stop circuits, air pressure switches, water flow switches, cooling conditions, temperature protection, or cover position sensors may prevent the main valve from opening. The equipment may enter only a partial pumping state.

Therefore, a value near 500 mbar does not directly identify one failed component. It indicates either an imbalance between pumping and gas load or a measurement-chain abnormality. Further isolation is required.

9. A Standard Diagnostic Procedure

A systematic procedure for vacuum equipment that cannot pump down should include the following steps.

First, record the initial state. This includes pressure value, pressure unit, channel selection, valve positions, button status, pump sound, pump oil condition, compressed air pressure, and any alarms. The more complete the initial record, the more accurate the diagnosis.

Second, isolate and test the mechanical pump. Disconnect the pump from the equipment and test vacuum directly at the pump inlet. If the pump cannot create vacuum at its own inlet, repair the pump first. If it can, proceed to the system.

Third, inspect the main pumping path. Confirm that the pipe between the pump inlet and chamber is connected, the roughing valve is open, isolation valves are in the correct position, and pneumatic valves actually actuate.

Fourth, close all gas inlet paths. This includes vent valves, process gas inlets, bypass valves, relief valves, and unused ports. All unused ports should be blanked off.

Fifth, perform staged pump-down testing. Pump down the shortest line first, then the line after the valve, then the chamber. Observe the pressure change each time a new section is added. If pressure becomes abnormal after adding a section, focus on that section’s valve, seal, and piping.

Sixth, check chamber sealing. Inspect O-rings, clamps, flanges, blanking plates, viewports, feedthroughs, bellows, and pressure gauge ports. Frequently opened parts should be checked first.

Seventh, verify the pressure measurement system. Confirm the gauge location, readout channel, unit, range, sensor power supply, and signal voltage. Use an independent vacuum gauge for comparison if possible.

Eighth, check electrical and pneumatic interlocks. Confirm solenoid valve power, compressed air supply, valve movement, and interlock conditions. For PLC-controlled equipment, input and output states should also be checked.

Ninth, perform fine leak testing if required. If the system reaches a partial vacuum but cannot meet specification, use alcohol testing, helium leak detection, residual gas analysis, or pressure rise testing.

The core of this procedure is to identify the main fault direction before replacing parts. The pump, gas path, sealing system, and measurement chain must be verified separately.

10. Judging and Handling Mechanical Pump Faults

The mechanical pump may indeed be the source of failure. If the pump cannot create sufficient vacuum at its own inlet, the pump itself should be inspected.

Oil problems are the most common. Low oil level reduces sealing and lubrication. Excessive oil level may cause backstreaming and exhaust problems. Dark, emulsified, solvent-contaminated, or particle-contaminated oil reduces ultimate vacuum. For oil-sealed rotary vane pumps, regular oil replacement is basic maintenance.

Worn vanes reduce sealing inside the pump chamber. The pump may still sound normal, but pumping speed and ultimate pressure decrease. Pumps used with dust, vapor, or corrosive gas are more likely to suffer accelerated vane and chamber wear.

Damaged exhaust valve plates affect compression and exhaust operation. Aged, deformed, carbonized, or contaminated valve plates can reduce pump performance.

A clogged inlet filter reduces effective pumping speed. Some systems use inlet filters or traps before the pump. If these are contaminated or blocked, the pump itself may be good but the system cannot evacuate efficiently.

Incorrect motor rotation should also be checked. Three-phase pumps can rotate in the wrong direction if phase sequence is incorrect, especially after motor replacement, power rewiring, or equipment relocation.

Internal leakage or aged seals can prevent the pump from reaching ultimate pressure. In this case, seal kits, vanes, valve plates, or pump-head repair may be required.

11. Judging and Handling Chamber and Line Leaks

If the pump is normal, leakage is one of the most likely system faults. Leak handling should start with simple checks.

All recently disassembled KF fittings should be rechecked. Confirm that the centering ring is present and properly seated, the O-ring is not cracked, flattened, contaminated, or displaced, and the clamp is evenly tightened.

All unused ports should be blanked. A single open port is enough to prevent the entire system from establishing vacuum.

Chamber cover seals should be inspected. Dust, metal chips, scratches, or adhesive residue on the sealing surface can prevent the O-ring from seating. The sealing surface should be cleaned and the O-ring replaced if necessary.

Bellows should be inspected for cracks and loose fittings. Suspicious bellows can be temporarily isolated with blanking plates to see whether pressure improves.

Valve internal leakage can be tested by blanking both sides or testing each valve separately. If a closed valve still allows significant gas flow, the seat, poppet, or seal has failed.

Viewports and feedthroughs deserve attention. Glass, ceramic, and electrical feedthrough seals can leak after aging or mechanical stress.

For leaks that are not visually obvious, alcohol or isopropanol may be used as a rough diagnostic aid. While the system is under vacuum, applying a small amount near a suspected seal may produce a pressure response if the location leaks. For high-requirement systems, helium leak detection should be used.

12. Electrical Interlocks and Pneumatic System Checks

Modern vacuum equipment often uses electrical controls to operate valves. Pump operation is only one condition. Whether the main valve opens may depend on multiple interlocks.

Compressed air pressure must be checked in pneumatic valve systems. Many pneumatic valves require a minimum air pressure to switch. If pressure is too low, the valve may remain in its default position. A panel lamp does not prove that the valve has opened.

Solenoid valve power should be measured. A dead coil, loose connector, failed PLC output, or broken cable can prevent valve actuation.

The valve spool may be stuck. Solenoid valves and pneumatic valves that have not operated for a long time may stick due to contamination, corrosion, or seal aging. The coil may be energized and air pressure available, but the valve still does not switch.

Interlock inputs should be confirmed one by one. Door switches, emergency stop buttons, water flow switches, air pressure switches, temperature protection, and cover position switches can all prevent the main valve from opening. Some equipment allows the pump to start but blocks chamber evacuation.

Relays and terminals should also be inspected. In older equipment, oxidized relay contacts, loose terminals, missing wire labels, and poor connector contact are common. Such faults may appear intermittently.

Electrical diagnosis must be combined with actual valve movement. Looking only at control panel lights is not enough. The physical valve position must be confirmed.

13. Repair Logic for Pressure Measurement System Faults

When the mechanical pump and gas path are normal but the pressure display remains abnormal, the pressure measurement system should be investigated.

First, confirm sensor type and range. Capacitance manometers, Pirani gauges, and thermocouple gauges operate differently and have different output signals and pressure ranges. If the readout configuration does not match the sensor, the display will be wrong.

Second, confirm the power supply. MKS-style capacitance manometers usually require stable supply voltage. Loss or deviation of power directly affects output. If the readout power returns to normal after disconnecting the sensor, the sensor may be shorted or overloaded.

Third, check the signal voltage. As pressure changes from atmosphere to vacuum, the sensor output voltage should change. If the voltage stays at 0 V, full-scale, or an intermediate fixed value, determine whether the sensor is faulty, the wiring is open, the inlet is blocked, or the sensor is isolated from the chamber.

Fourth, inspect the readout input channel. Dual-channel equipment requires correct CH1/CH2 identification. Wrong input wiring, wrong channel selection, or poor channel switch contact can all cause incorrect display.

Fifth, inspect the display board and analog circuit. The readout’s internal power supply, capacitors, operational amplifiers, DIP switches, terminal solder joints, and display driver can all fail with age. If the sensor output voltage is normal but the display does not follow it, the readout itself should be repaired.

The central method is signal tracing. Start at the pressure sensor output, follow the signal into the readout input, then through the amplifier and display circuit. The point where the signal becomes abnormal defines the fault area.

14. Common Misdiagnoses in Vacuum Equipment Repair

Several misdiagnoses are especially common.

The first is treating pump noise as proof of vacuum. A running motor only proves that the motor is turning. It does not prove the pump is healthy or connected to the chamber.

The second is treating the displayed pressure as the real pressure. Pressure display depends on the sensor, wiring, channel, unit, and range. An abnormal display does not always mean abnormal real pressure.

The third is checking the pump while ignoring valves. Many failures are caused by a closed valve, leaking vent valve, or inactive pneumatic valve, not by the pump.

The fourth is trusting panel lamps without confirming valve movement. A lamp may indicate a command, not the completion of the mechanical action.

The fifth is ignoring unused ports and blanking plates. One open fitting can prevent the entire system from pumping down.

The sixth is ignoring pressure gauge location. If the gauge is isolated by a valve, its reading does not represent chamber pressure.

The seventh is failing to perform staged pump-down testing. When a full system cannot pump down, the system must be divided into sections. Otherwise, leak points and blocked paths are difficult to locate.

Avoiding these mistakes requires treating the vacuum system as several linked functional chains, not reducing every problem to the pump or the sensor.

15. Conclusion

Failure to pump down is a typical system-level fault in vacuum equipment. It may be caused by degraded mechanical pump performance, but it may also be caused by a closed valve, leaking vent valve, chamber seal failure, inactive pneumatic valve, abnormal pressure sensor power supply, incorrect readout channel selection, or unsatisfied electrical interlock. In systems equipped with an MKS PDR-C-2C readout, MKS capacitance manometer, multiple valves, and a mechanical pump, the pressure value on the front panel alone is not enough to identify the failed component.

The correct diagnostic method follows a clear sequence. First, isolate and test the mechanical pump to confirm its basic pumping capability. Second, inspect the main pumping path between the pump and chamber and verify actual valve positions. Third, check the chamber, flanges, O-rings, blanking plates, bellows, and valves for leakage. Fourth, verify the pressure measurement system, including channel, unit, range, sensor power supply, and analog output signal. If the equipment uses pneumatic valves and interlock control, compressed air supply, solenoid valves, and interlock conditions must also be confirmed.

For repair personnel, the key is not to assume that a running pump means proper vacuum, and not to assume that an abnormal display means a faulty sensor. The pumping chain and measurement chain must be verified separately through isolation, staged testing, comparison, and electrical measurement. Only then can the fault be accurately located in the pump, valve system, leakage path, pressure sensor, readout electronics, or control system. This approach reduces unnecessary part replacement, avoids repeated misdiagnosis, and improves the efficiency and accuracy of vacuum equipment repair.

Posted on

Troubleshooting a Malvern Mastersizer 3000 Application Error During Software Startup

1. Overview of the Fault

In particle size analysis systems, the instrument hardware, operating software, communication drivers, database components, and Windows environment work together as one complete measurement platform. When a user reports that the software cannot start, it is easy to assume that the analyzer itself is faulty. However, software startup failure and instrument hardware failure are two different categories of problems and should be diagnosed separately.

A typical fault can occur on a Malvern Mastersizer 3000 system where the software starts, displays the Malvern splash screen, and then immediately shows an Application Error message:

An unexpected exception occurred while calling HandleException with policy ‘Default Policy’. Please check the event log for details about the exception.

At this stage, the software has not entered the main operating interface. The user cannot connect to the instrument, load measurement methods, perform background measurements, run samples, or analyze data. In the Windows Event Viewer, the user may find entries such as Application Error, Windows Error Reporting, Application Hang, .NET Runtime errors, or records mentioning KERNELBASE.dll.

The key point is that this type of error should not be immediately interpreted as a laser particle size analyzer hardware failure. It is more likely to be a Windows-side software environment problem, especially when the error appears before the main Mastersizer interface opens.

For a Malvern Mastersizer 3000 system, startup failure is usually related to one or more of the following:

Windows compatibility issue

Damaged software installation

Missing or corrupted .NET Framework components

Missing or corrupted Microsoft Visual C++ runtime libraries

Damaged user configuration files

Damaged local database or method database

Malvern background service failure

Device driver conflict

Permission issue

Windows update conflict

Security software interference

Only after the software can open normally and enter the instrument connection stage should the instrument body, laser source, optical bench, dispersion unit, communication interface, and hardware modules be considered as the primary fault targets.

mastersizer3000

2. Why This Fault Should Not Be Judged as Instrument Hardware Damage First

A Malvern Mastersizer 3000 system consists of several layers. The analyzer hardware is only one part of the system. The software layer must start correctly before any meaningful judgment can be made about the instrument body.

If the instrument hardware were the direct cause, the software would usually open first and then show instrument-related errors, such as:

Instrument not found

Communication failure

Laser status abnormal

Optical alignment failure

Background signal abnormal

Wet dispersion unit not detected

Dry dispersion unit not detected

SOP cannot initialize the accessory

Obscuration cannot be stabilized

Measurement signal unstable

In contrast, when the software crashes during the splash screen stage, before entering the main interface, the problem is normally located in the PC-side software environment. At this moment, the software may not even have started instrument communication. It may still be loading its program framework, local database, services, configuration files, user profile, report templates, runtime libraries, or graphical components.

Therefore, if the software fails before reaching the main interface, the correct diagnostic direction is:

First diagnose the computer, operating system, software installation, runtime components, database, configuration files, and services. Do not disassemble the particle size analyzer body at this stage.

A simple but important test is to disconnect the instrument from the computer and then open the software alone. If the software still reports the same Application Error without any instrument connected, the fault is almost certainly not caused by the analyzer hardware.

Application Error  of the mastersizer3000

3. Meaning of the Application Error Message

Windows Application Error is a general crash event. It does not represent one specific Malvern fault code. It only means that a program encountered an unhandled exception and Windows recorded the crash.

The most important fields in Windows Event Viewer are:

Faulting application name

Faulting module name

Exception code

Fault offset

Process ID

Application path

Module path

Time of event

Among these fields, the most important one is the faulting application name.

If the faulting application name is Mastersizer.exe, Malvern.exe, MalvernPanalytical-related executable, or another executable clearly belonging to the Mastersizer software, the log is useful for diagnosing the Mastersizer software failure.

If the faulting application name is mmc.exe, then the crashed program is not Mastersizer. mmc.exe is Microsoft Management Console. Windows Event Viewer, Device Manager, Services, and many Windows administrative tools run under mmc.exe.

For example, if the Event Viewer shows:

Faulting application name: mmc.exe

Faulting module name: KERNELBASE.dll

Application path: C:\Windows\System32\mmc.exe

This means the Windows management console itself crashed. It does not prove that the Mastersizer 3000 software crashed in KERNELBASE.dll. It also does not tell us which Mastersizer component failed.

This distinction is very important. A wrong interpretation of the Event Viewer log can lead to a completely wrong repair direction.

4. Understanding KERNELBASE.dll in the Event Log

KERNELBASE.dll is a core Windows system component. Many application exceptions are eventually reported through KERNELBASE.dll. Therefore, seeing KERNELBASE.dll in the faulting module field does not automatically mean that KERNELBASE.dll itself is damaged.

KERNELBASE.dll often appears when an application throws an exception that is not properly handled. The real cause may be:

.NET runtime exception

Application configuration error

Database access failure

Missing software dependency

Permission problem

Program module conflict

Windows compatibility problem

Access violation

Damaged user profile

Security software blocking the program

Corrupted application file

If the exception code is 0xe0434352, it often indicates a .NET-related exception. If the exception code is 0xc0000005, it often indicates an access violation, which may be caused by a damaged module, incompatible driver, memory access issue, or software conflict.

However, the KERNELBASE.dll record is only meaningful if the faulting application is the Mastersizer software. If the faulting application is mmc.exe, that record belongs to Windows Event Viewer or another Windows console tool, not to the Malvern application.

5. Windows 11 Compatibility Risk with Older Instrument Software

Many laboratory instruments are designed and validated for specific Windows versions. An instrument software package may install successfully on a newer Windows system, but that does not mean it is fully compatible or stable.

In many real service cases, older scientific instrument software may work reliably on Windows 10 but fail on Windows 11, especially after major Windows updates. Mastersizer 3000 software version 3.88, for example, may encounter compatibility risks on a newer Windows 11 environment, depending on the exact software release, driver package, service components, and instrument configuration.

Possible symptoms include:

Software installs but cannot start

Software starts but crashes at the splash screen

Local database cannot initialize

Malvern service fails to start

USB or Ethernet instrument driver does not load correctly

Software cannot register required components

Report or graph module fails to initialize

.NET component throws an exception

User configuration cannot be read

Windows security settings block background services

For normal office applications, Windows 11 may be suitable. For laboratory instrument software, however, stability and validated compatibility are more important than using the newest operating system.

If the problem appeared after replacing the computer, reinstalling the operating system, or upgrading to Windows 11, system compatibility should be treated as a high-priority suspect.

A practical service recommendation is to test the same Mastersizer software version on a clean Windows 10 64-bit computer. If the software opens normally on Windows 10 but not on Windows 11, the problem is very likely related to operating system compatibility or software environment differences.

6. What the Mastersizer 3000 Software Loads During Startup

When the Mastersizer 3000 software starts, it does much more than display a user interface. During startup, it may load and initialize:

Main application framework

User profile

Instrument configuration

Local database

Measurement records

SOP methods

Report templates

Analysis calculation modules

Graphical display components

Malvern background services

Communication services

USB or Ethernet drivers

License or authorization components

Cloud or update services

Windows user permissions

Temporary folders and cache files

If any of these components are missing, damaged, blocked, or incompatible, the software may crash before reaching the main interface.

For example, if the user configuration file is damaged, the software may fail while loading the last used instrument, window layout, default method, or user preference settings. If the local database is damaged, the software may fail while reading historical measurement data or method libraries. If a background service is not running, the main program may fail when trying to communicate with that service.

Therefore, the startup phase should be treated as a software environment initialization process, not as an instrument measurement process.

7. Recommended Diagnostic Procedure

A structured diagnostic sequence is essential. The goal is to separate software failure from hardware failure, then identify the exact software layer causing the crash.

Step 1: Disconnect the Instrument and Start the Software Alone

Disconnect the Mastersizer 3000 instrument body from the computer. Also disconnect wet dispersion units, dry dispersion units, USB cables, Ethernet cables, and any external accessories if possible.

Then start the Mastersizer software alone.

If the software opens normally without the instrument connected, the software itself may be functional, and the problem may be related to instrument communication, device driver initialization, or a connected accessory.

If the software still reports the same Application Error, the fault is most likely in the computer, software installation, database, configuration files, Windows environment, or runtime components.

This is the first and most important separation test.

Step 2: Run the Software as Administrator

Right-click the Mastersizer 3000 shortcut and choose Run as administrator.

If the software opens correctly as administrator, the fault may be caused by insufficient user permissions, blocked access to the database folder, blocked configuration directory, or restricted service communication.

If the software still reports the same error, the problem is not simply caused by normal user permissions.

Step 3: Find the Correct Event Viewer Log

Open Windows Event Viewer:

Windows Logs → Application

Run the Mastersizer software again and allow it to fail. Record the exact time of the error. Then check the Application log around that time.

Look for entries from:

Application Error

Windows Error Reporting

.NET Runtime

Application Hang

MalvernPanalytical

Malvern

Mastersizer

Open each related record and confirm the faulting application name.

A valid record should show a faulting application related to Mastersizer or Malvern. If the application name is mmc.exe, the user has selected the wrong record. That record belongs to Windows Event Viewer or another Windows management console.

The following fields should be recorded:

Faulting application name

Faulting module name

Exception code

Application path

Module path

Fault offset

Only after these details are available can the next diagnostic step be accurate.

Step 4: Check Malvern Services

Press Win + R, type:

services.msc

Then check whether Malvern or MalvernPanalytical services are present and running. Depending on the software version, there may be services related to cloud communication, data, instrument communication, update functions, or background control.

If a Malvern service is stopped, try to start it manually. If it fails to start, record the error message. A service that cannot start may indicate:

Damaged installation

Missing dependency

Permission issue

Database problem

Windows service registration failure

Security software blocking the service

The Mastersizer front-end software may rely on these background services. If service communication fails, the main software may crash during startup.

Step 5: Confirm the Windows Version

Confirm the operating system details:

Windows 10 or Windows 11

64-bit or 32-bit

Exact Windows build version

Whether Windows was recently updated

Whether the computer was recently replaced

Whether the software was installed on a newly prepared system

If the system is Windows 11 and the Mastersizer software version is older, compatibility must be considered. Testing on Windows 10 64-bit is often the fastest way to confirm whether the operating system is part of the problem.

Step 6: Check Recent Installation or Repair Activity

If the Event Viewer shows many MsiInstaller records, it may indicate that Windows Installer recently installed, repaired, reconfigured, or checked software components.

Ask the user:

Was the software recently installed?

Was the operating system reinstalled?

Was the software copied from another computer instead of installed properly?

Was a software repair attempted?

Were Malvern components removed?

Was a cleaner tool used?

Was antivirus software recently installed?

Was Windows recently updated?

Were ProgramData or AppData folders deleted?

A failed or incomplete installation is a common cause of startup errors.

Step 7: Back Up Data Before Repairing or Reinstalling

Before repairing or reinstalling the software, back up all important user data. This may include:

Measurement records

SOP methods

Report templates

Instrument configuration

User settings

Databases

Calibration-related records

Do not simply delete Malvern folders. Some folders may contain important laboratory data.

Possible data locations include:

C:\ProgramData\Malvern Instruments

C:\ProgramData\Malvern Panalytical

C:\Users\Public\Documents\Malvern Instruments

C:\Users[User]\AppData\Roaming\Malvern

C:\Users[User]\AppData\Local\Malvern

The exact location depends on software version and installation configuration, but the principle is the same: back up before removing or reinstalling.

8. Database or Configuration File Damage

Damaged configuration files or local databases are common in laboratory software. They may be caused by:

Unexpected power failure

Forced shutdown during software operation

Software crash during measurement

Disk space shortage

Antivirus quarantine

Windows update changing permissions

Damaged Windows user profile

File system error

Improper software migration

Manual deletion of folders

Typical symptoms include:

Software crashes before the main interface opens

Software cannot load methods

Historical records cannot be opened

Report templates disappear

Only one Windows user account fails

New Windows user account works

Software crashes when loading the last used configuration

A useful test is to create a new Windows administrator account and run the Mastersizer software from that account. If the software opens under a new user but not under the original user, the original user profile or user-level configuration is likely damaged.

If the software fails under all Windows users, the problem is more likely in the common software installation, database, runtime components, Windows services, or operating system compatibility.

9. .NET Framework and Visual C++ Runtime Issues

Many scientific instrument programs depend on Microsoft .NET Framework and Microsoft Visual C++ Redistributable packages. If these components are missing or damaged, the software may report Application Error, .NET Runtime error, KERNELBASE.dll exception, or crash during startup.

Important points:

Installing only the latest runtime may not be enough. Older software may require a specific Visual C++ runtime version.

Both x86 and x64 runtime packages may be required, even on a 64-bit Windows system.

.NET Framework 4.x components should be checked and repaired if the log points to .NET Runtime.

If the Event Viewer shows .NET Runtime, clr.dll, or exception code 0xe0434352, the issue should be treated as a .NET application exception.

In such cases, repair actions may include:

Repairing .NET Framework

Enabling required Windows .NET features

Repairing Visual C++ Redistributables

Reinstalling the Malvern software

Running the installer as administrator

Checking whether antivirus software blocked registration of DLL files

10. Instrument Communication and Driver Problems

Even though startup failure is usually a PC-side issue, communication and driver problems should not be ignored completely. Some instrument software automatically scans connected hardware during startup. If a device driver or external accessory responds abnormally, the software may crash.

This is why the disconnected-instrument test is necessary.

If the software opens when the instrument is disconnected but crashes when the instrument is connected, check:

Instrument power supply

USB or Ethernet cable

USB port stability

Device Manager recognition

Malvern instrument driver installation

IP address or network configuration

Firewall settings

Wet dispersion unit connection

Dry dispersion unit connection

Accessory communication

Malvern service status

For laboratory instruments, avoid unstable USB hubs, long USB extension cables, front-panel USB ports, and docking stations whenever possible. Direct rear-panel USB or a stable Ethernet connection is preferred.

11. How to Explain the Problem to the Customer

A professional explanation to the customer should avoid premature conclusions. The recommended wording is:

Based on the current symptom, the Mastersizer 3000 software crashes during startup before entering the main operating interface. This suggests a PC-side software or Windows environment issue rather than direct damage to the particle size analyzer hardware. The next step is to disconnect the instrument and open the software alone, then check the correct Windows Event Viewer record. The useful record must show Mastersizer or Malvern as the faulting application. If the log shows mmc.exe, it is the Windows Event Viewer itself and not the Mastersizer software. After the correct log is confirmed, we can determine whether the fault is related to .NET, KERNELBASE.dll, Malvern software modules, database files, configuration files, services, drivers, or Windows compatibility.

This explanation is clear and technically accurate. It also prevents the customer from unnecessarily disassembling the instrument or sending the analyzer body for repair before software-side diagnosis is complete.

12. Practical Service Strategy for Repair Companies

For a repair company or third-party service provider, this type of fault should be handled in three levels.

Level 1: Remote Diagnosis

Collect:

Photos of the error message

Video of the startup process

Software version

Windows version

Instrument connection status

Event Viewer details

Malvern service status

Recent installation or update history

The goal is to confirm whether the problem is software-side or hardware-side.

Level 2: PC-Side Software Repair

If the fault is confirmed as a PC-side software problem, the repair work may include:

Backing up data

Repairing runtime libraries

Repairing .NET Framework

Checking Windows services

Checking Malvern services

Reinstalling the Mastersizer software

Reinstalling drivers

Creating a new Windows user

Checking compatibility mode

Testing on Windows 10 64-bit

Level 3: Full Instrument Commissioning

Only after the software opens normally should the instrument be connected for complete testing.

Commissioning should include:

Instrument recognition

Communication stability

Laser status

Background signal

Optical alignment

Wet or dry dispersion unit recognition

Standard sample repeatability

SOP loading

Data saving and report generation

This sequence avoids unnecessary hardware repair and protects customer data.

13. Folders That Should Not Be Deleted Carelessly

Customers sometimes try to solve software problems by deleting folders. This is risky because laboratory software may store important data in hidden or system folders.

Avoid deleting Malvern-related folders before backup. They may contain:

Measurement history

SOP methods

User configuration

Report templates

Instrument configuration

Database files

Calibration-related files

Cache files

Important locations may include:

C:\ProgramData\Malvern Instruments

C:\ProgramData\Malvern Panalytical

C:\Users\Public\Documents\Malvern Instruments

C:\Users[User]\AppData\Roaming\Malvern

C:\Users[User]\AppData\Local\Malvern

Before reinstalling software, always back up these folders or use the manufacturer-recommended backup method.

14. Case-Based Preliminary Conclusion

Based on the described case, the following conclusions can be made:

The Mastersizer 3000 software displays an Application Error during startup.

The software crashes before entering the main operating interface.

Running as administrator does not solve the issue.

The Event Viewer contains Application Error and Windows Error Reporting records.

One opened Application Error 1000 record shows faulting application name mmc.exe, which means it is a Windows Event Viewer or Microsoft Management Console crash, not the Mastersizer software crash.

The computer appears to be running a newer Windows 11 environment.

Mastersizer 3000 software version 3.88 may have compatibility risks on newer Windows 11 systems.

There is currently no evidence proving damage to the analyzer hardware, laser unit, optical bench, or dispersion unit.

The next step is to generate the Mastersizer error again and locate the correct Event Viewer record where the faulting application is Mastersizer or Malvern.

If the software still crashes with the instrument disconnected, the fault should be handled as a PC-side software environment issue.

If the software opens when the instrument is disconnected but crashes when the instrument is connected, then instrument communication, drivers, or accessory hardware should be checked.

The most reasonable current repair direction is:

Repair or verify the PC-side software environment first, then perform instrument communication and hardware commissioning. Do not disassemble the analyzer body before confirming that the software can start correctly.

15. Recommended Final Troubleshooting Workflow

The following workflow is recommended for field service:

Disconnect the Mastersizer instrument and all accessories from the computer.

Start the Mastersizer software alone.

If the error appears again, record the exact time.

Open Windows Event Viewer.

Go to Windows Logs → Application.

Find records around the exact error time.

Open Application Error, Windows Error Reporting, and .NET Runtime records.

Confirm whether the faulting application is Mastersizer or Malvern.

Ignore records where the faulting application is mmc.exe unless troubleshooting Windows itself.

Record the faulting module and exception code.

Check Malvern services in services.msc.

Create a new Windows administrator account and test again.

Confirm whether the computer is Windows 10 or Windows 11.

If using Windows 11, test the same software on Windows 10 64-bit.

Back up measurement data, SOP methods, reports, and configuration files.

Repair or reinstall the Mastersizer software and required runtime components.

Restart the computer.

Start the software without the instrument connected.

If the software opens normally, reconnect the instrument.

Test communication, laser status, background signal, dispersion unit recognition, and standard sample repeatability.

This workflow is practical, safe, and technically logical. It reduces misdiagnosis and avoids unnecessary hardware repair.

16. Conclusion

A Malvern Mastersizer 3000 Application Error during software startup should be treated as a software-side startup failure until proven otherwise. When the error occurs before the main interface opens, the most likely causes are Windows compatibility, damaged software components, missing runtime libraries, corrupted configuration files, database problems, Malvern service failure, or driver conflicts.

The Windows Event Viewer is useful, but only if the correct record is selected. If the faulting application is mmc.exe, the crash belongs to Microsoft Management Console, not to the Mastersizer software. The useful log must show Mastersizer or Malvern as the faulting application. The faulting module, exception code, and application path should then be used to determine the next repair step.

For this type of fault, the correct principle is:

Software before hardware.

Logs before disassembly.

Backup before reinstallation.

Offline startup before instrument connection.

Windows compatibility before component-level repair.

Following this approach protects customer data, avoids unnecessary instrument disassembly, and greatly improves the accuracy of the diagnosis.

Posted on

Danfoss FC-051 Inverter AL29 Overtemperature Alarm: Causes, Diagnosis, and Repair Methods

The Danfoss VLT Micro Drive FC-051 is a compact general-purpose inverter widely used in fans, pumps, conveyors, packaging machines, light industrial equipment, mixers, textile machines, and standard three-phase asynchronous motor speed control systems. Because of its compact structure, limited heat dissipation space, and frequent use in dusty electrical cabinets, the FC-051 may report temperature-related faults after long-term operation. One of the common alarms seen on site is AL29.

When a Danfoss FC-051 displays AL29, it usually indicates an overtemperature condition in the power section, power board, heatsink, or related temperature detection circuit. The drive stops output to protect the IGBT module, rectifier bridge, DC bus capacitors, and gate drive circuit. This alarm should not be treated as a simple parameter error. It is a thermal protection alarm, and the correct troubleshooting direction should focus on cooling, load current, cabinet ventilation, ambient temperature, fan condition, and the temperature feedback circuit.

  1. Meaning of AL29 on Danfoss FC-051
AL29 FAULT OF FC-051 VFD

AL29 on the Danfoss FC-051 can generally be understood as a power board or heatsink overtemperature alarm. It means that the internal temperature of the drive has reached the protection threshold, or the temperature detection circuit has sent an abnormal high-temperature signal to the control board.

Inside the inverter, the main heat-generating components include the rectifier bridge, IGBT module, braking circuit, DC bus capacitors, switching power supply, power resistors, and high-current copper traces on the power board. Among these, the IGBT module and heatsink area are usually the most critical parts related to AL29.

During operation, the input AC power is rectified into DC bus voltage. The IGBT module then switches at high frequency to generate variable-frequency and variable-voltage three-phase output for the motor. The IGBT produces conduction loss and switching loss. The heavier the load and the higher the output current, the more heat the power module generates. If this heat cannot be removed quickly, the heatsink temperature rises. When the temperature reaches the trip point, the inverter stops output and displays AL29.

Therefore, AL29 is a protection result, not a single fixed component failure. It may be caused by real overheating due to poor cooling, a damaged cooling fan, excessive output current, overload, poor cabinet ventilation, high carrier frequency, or a faulty temperature detection circuit.

  1. Why the FC-051 Is Prone to AL29

The FC-051 is a compact inverter. Many machines install it in a small control cabinet to save space. Sometimes several drives are mounted close to each other, with insufficient clearance at the top and bottom. For small drives, users often underestimate the importance of airflow and heat dissipation.

In actual industrial environments, the control cabinet may also contain contactors, power supplies, PLCs, servo drives, braking resistors, transformers, and other heat-generating components. If the cabinet is closed, the filter is blocked, or the cabinet fan does not work properly, the internal cabinet temperature can be much higher than the workshop temperature.

For example, the workshop temperature may be 35°C, but the internal cabinet temperature may rise to 45°C or even higher. If the inverter is running near full load under such conditions, the thermal margin becomes very small. AL29 then becomes likely, especially during summer, continuous operation, or high-load operation.

The FC-051 is also commonly used on fans and pumps. After long-term use, these machines may develop mechanical problems such as bearing wear, blocked impellers, dirty fan blades, pipe blockage, excessive pressure, belt over-tension, or increased mechanical resistance. These issues increase motor current and make the inverter heat up. In many cases, the drive alarm is only the visible symptom, while the real cause is a mechanical load problem.

  1. Common Causes of AL29

3.1 Blocked cooling path and dusty heatsink

FC-360H2K2T4E20H2B

A very common cause of AL29 is dust blockage. If the front panel of the inverter is already covered with dust, the rear heatsink, bottom air inlet, top air outlet, and internal airflow path may also be dirty.

The inverter does not mainly dissipate heat through the front panel. The heat from the IGBT module is transferred to the heatsink through thermal grease and then removed by airflow. If the heatsink fins are blocked by dust, oil, cotton fiber, metal powder, or other contaminants, air cannot flow through the fins properly. Even if the load current is not excessive, the inverter may still trip on AL29 after running for some time.

In dusty environments, overtemperature alarms often become more frequent gradually. At first, the drive may trip only occasionally in summer. Later, it may trip after a few hours. Eventually, it may trip after only several minutes of operation. This pattern usually indicates worsening cooling conditions, fan aging, or heatsink contamination.

3.2 Cooling fan failure

Some FC-051 models or power ratings use a cooling fan. The fan must be checked carefully when troubleshooting AL29.

Fan faults include complete failure to rotate, slow rotation, difficult starting, intermittent stopping, bearing noise, vibration, dirty blades, or insufficient airflow. A fan may still rotate but provide very little airflow because of aging bearings or dust accumulation. This is why simply seeing the fan rotate is not enough. The actual airflow must also be checked.

The correct inspection method is to observe the fan during startup, listen for abnormal sound, feel the airflow at the air outlet, check the fan connector, and measure the fan supply voltage if necessary. If the fan is noisy, weak, unstable, or slow to start, it should be replaced.

3.3 Poor cabinet ventilation or high ambient temperature

Poor ventilation is one of the most common site-related causes. The drive may be installed too close to other components. The top outlet may be blocked by wiring ducts. The lower air inlet may be restricted by terminals or cables. Several drives may be mounted vertically, causing the upper drive to inhale hot air from the lower drive.

A control cabinet must have a clear airflow path. If there is no cabinet fan, if the filter cotton is blocked, or if the cabinet is located near a heat source, the internal temperature will rise. Under this condition, AL29 is not caused by a single defective part but by poor thermal design of the cabinet.

The cabinet temperature, inverter inlet temperature, outlet temperature, and heatsink temperature should be measured during continuous operation. If the internal cabinet temperature is too high, improving cabinet ventilation is necessary. Repeatedly resetting the alarm will not solve the problem.

3.4 Excessive load or mechanical resistance

The output current of the inverter directly affects heat generation. If the motor load is heavy, the inverter output current increases, and the power module produces more heat. If AL29 appears after a period of operation and the motor sounds heavy, the current should be checked immediately.

Common mechanical causes include damaged bearings, dry bearings, dirty fan impellers, blocked air ducts, stuck pump impellers, high pipe pressure, wrong valve position, tight belts, gearbox problems, heavy material load, misaligned couplings, or brakes not fully released.

A frequent mistake is to assume that the inverter is faulty just because it trips. In reality, the machine load may have changed after years of use. A motor that previously ran at 60% rated current may now run at 90% or higher due to mechanical deterioration. The inverter will naturally heat up more and may trip on AL29.

3.5 Undersized inverter

If the motor rated current is close to or higher than the inverter rated output current, the drive may run near its thermal limit. This is especially risky in high-temperature cabinets, continuous-duty operation, heavy starting conditions, frequent acceleration, or low-speed high-torque applications.

Some users select replacement drives only by kilowatt rating and ignore rated current, overload capacity, load type, and cooling margin. Different inverter series may have different overload capability even at the same power rating. If the drive is undersized, AL29 can occur even if the drive itself is not defective.

To evaluate sizing, compare the motor nameplate current, the inverter rated output current, and the actual running current. If the actual current is continuously close to the drive rating, a larger inverter or load reduction may be required.

3.6 Carrier frequency set too high

A higher carrier frequency can reduce motor noise, but it also increases IGBT switching losses. This causes the inverter to run hotter. If the FC-051 is used in a normal fan or pump application, unnecessarily high carrier frequency should be avoided.

When AL29 occurs and cooling conditions appear acceptable, check whether the carrier frequency has been set too high. Reducing the carrier frequency can lower inverter heat generation and improve thermal stability.

3.7 Acceleration time too short or frequent start-stop operation

During acceleration, the inverter may need to provide high current to the motor. If the acceleration time is too short, current stress increases. In high-inertia loads or machines with frequent start-stop cycles, the drive may repeatedly operate under high thermal stress.

For conveyors, mixers, centrifuges, packaging machines, and similar equipment, check the acceleration time, deceleration time, braking method, load inertia, and start-stop frequency. Excessive acceleration current can contribute to overheating and eventually trigger AL29.

3.8 Aging thermal grease or poor contact between module and heatsink

After years of use, the thermal grease between the IGBT module and the heatsink may dry out, crack, or lose thermal conductivity. Loose screws or poor mounting after repair can also reduce heat transfer.

In this condition, the outside of the heatsink may not feel extremely hot, but the internal junction temperature of the IGBT may be high. If the inverter has been used for many years, or if the module was previously removed, the thermal interface should be checked. Old grease should be cleaned, new thermal grease should be applied thinly and evenly, and the module should be tightened properly.

3.9 Faulty temperature detection circuit

If the drive displays AL29 immediately after power-on while the heatsink is still cold, it is unlikely to be a real overtemperature condition. The temperature detection circuit should then be suspected.

The temperature feedback circuit may include an NTC thermistor, voltage divider resistors, filter capacitors, connector wiring, and an ADC input on the control board. An open thermistor, shorted thermistor, drifting resistor, corroded connector, damaged cable, or faulty ADC circuit can cause a false overtemperature alarm.

This type of fault cannot be solved by cleaning the heatsink or replacing the fan. The thermistor resistance should be measured at room temperature and compared with a known good unit if possible. Heating the sensor slightly should cause a predictable resistance change. If the resistance is open, shorted, or abnormal, the sensor or related circuit must be repaired.

3.10 Power board abnormal heating

If the inverter still reports AL29 after cleaning, fan replacement, and load verification, the power board should be checked. Possible defects include IGBT aging, rectifier bridge heating, DC bus capacitor degradation, gate drive waveform abnormality, loose power terminals, burned copper traces, or high-resistance connections.

A drive that has operated for a long time under high temperature may suffer from capacitor aging and power semiconductor stress. If the power board shows discoloration, burned terminals, bulging capacitors, or abnormal smell, deeper board-level repair is required.

  1. How to Judge Real Overtemperature or False Alarm

The most important step in troubleshooting AL29 is to determine whether the drive is actually overheating.

If AL29 appears after the drive has been running for some time and the heatsink is hot, this is likely a real overtemperature alarm. The main checks should be cooling path, fan, cabinet temperature, load current, carrier frequency, and mechanical load.

If AL29 appears immediately after power-on while the drive is cold, it is more likely a false overtemperature signal. The main checks should be the temperature sensor, wiring, connector, sampling circuit, and power board.

If AL29 appears mainly in summer, under full load, or only when the cabinet door is closed, the drive may not have a component failure. The problem is more likely insufficient thermal margin, poor ventilation, or high cabinet temperature.

This distinction prevents incorrect repair decisions. Many AL29 cases are misdiagnosed because technicians only reset the alarm or replace parts without checking the operating condition.

  1. Practical Troubleshooting Procedure

First, record the alarm condition. Ask whether AL29 appears immediately after power-on or after running for a period of time. Ask how long the drive runs before tripping, whether the fault happens at high speed or low speed, whether it happens more often in summer, and whether the machine load has recently changed.

Second, disconnect the power safely. The inverter DC bus capacitors can retain dangerous voltage after power-off. Wait for discharge and measure the DC bus voltage before touching internal parts.

Third, inspect the installation. Check whether the drive has enough clearance, whether the air inlet and outlet are blocked, whether wiring ducts are too close, whether multiple drives are installed too tightly, and whether the cabinet fan works.

Fourth, clean the cooling path. Clean the bottom air inlet, top outlet, rear heatsink, fan blades, fan cover, and cabinet filter. Do not only clean the front panel. If the heatsink fins are blocked, the inverter cannot dissipate heat properly.

Fifth, check the cooling fan. Confirm whether the fan starts normally, runs steadily, and provides sufficient airflow. Replace the fan if it is noisy, weak, slow, or intermittent.

Sixth, measure the actual output current. Compare the actual current with the motor nameplate current and inverter rated output current. If the current is too high, inspect the mechanical load and motor condition.

Seventh, perform a light-load or no-load test if possible. If the drive does not trip under no load but trips under load, the mechanical system or load condition is the main suspect. If it trips even under no load, the drive hardware should be checked.

Eighth, review the parameters. Check motor rated voltage, current, frequency, power, acceleration time, deceleration time, carrier frequency, torque boost, and control mode. Incorrect parameters can increase current and heat generation.

  1. Repair Methods

If the cause is poor cooling, clean the heatsink and airflow path thoroughly. Replace old fans and improve cabinet ventilation. Make sure the cabinet has a proper inlet and outlet airflow path. Do not allow hot air to circulate inside the cabinet.

If the fan is faulty, replace it with the correct specification. Pay attention to voltage, size, connector, airflow direction, and mounting position. A fan installed in the wrong direction may appear to work but will not cool the inverter correctly.

If the load is too heavy, repair the mechanical system. Check bearings, belts, couplings, gearboxes, impellers, pipes, valves, brakes, and material load. If the process requires the motor to run continuously at high current, a larger inverter may be needed.

If the carrier frequency is too high, reduce it to a reasonable value. If acceleration is too aggressive, increase the acceleration time. If torque boost is excessive, adjust it properly. Parameter optimization should reduce unnecessary current and heat while maintaining stable machine operation.

If the temperature detection circuit is faulty, inspect the NTC thermistor, connector, cable, sampling resistor, filter capacitor, and control board input. Replace damaged or drifting components. Compare resistance values with a good unit whenever possible.

If the power board is defective, check the IGBT module, rectifier bridge, DC bus capacitors, gate drive circuit, power terminals, and thermal interface. After board repair, the drive should be tested carefully with current limiting, no load, light load, and then full load.

  1. When to Replace the Inverter

Not every AL29 alarm means the inverter must be replaced. If the cause is dust, fan failure, high cabinet temperature, excessive carrier frequency, or mechanical overload, the drive may continue to operate after proper maintenance.

Replacement or major repair should be considered if the drive reports AL29 immediately when cold, the temperature detection circuit is damaged, the power board has burn marks, the IGBT or rectifier bridge is abnormal, the DC bus capacitors are aged, or the drive continues to trip after cleaning and fan replacement.

If the drive has repeatedly operated under overtemperature conditions, internal components may already have suffered thermal stress. Even if it can be reset temporarily, long-term reliability may be poor. For critical production equipment, repeated AL29 alarms should be treated seriously.

  1. Relationship Between AL29 and Other Faults

AL29 may appear together with overload, overcurrent, undervoltage, or overvoltage alarms. For example, a stuck mechanical load may first cause high current, then heat accumulation, and finally AL29. A damaged fan may cause only AL29. Poor cabinet ventilation may cause several drives in the same cabinet to report temperature-related alarms.

Therefore, the alarm code should not be interpreted in isolation. AL29 tells the technician that the drive has detected a thermal problem, but the root cause may be mechanical, electrical, environmental, installation-related, or internal to the power board.

  1. Preventive Maintenance Recommendations

To prevent AL29, the inverter and control cabinet should be maintained regularly. In a clean environment, the airflow path and cabinet filter can be inspected every few months. In dusty, oily, or fiber-rich environments, inspection should be much more frequent.

The fan should be treated as a wear part. If it becomes noisy, unstable, or weak, it should be replaced before it causes repeated shutdowns. The cabinet filter should be cleaned or replaced regularly. The drive should not be installed too close to other heat sources, and sufficient clearance should be maintained.

During routine inspection, record the running current, cabinet temperature, heatsink temperature, and alarm history. If the running current increases compared with previous records, the mechanical load should be checked immediately. Many inverter failures can be predicted by rising current, rising temperature, increasing fan noise, and more frequent alarms.

  1. Example Diagnosis

If a Danfoss FC-051 used on a fan runs for one hour and then displays AL29, and the front panel is covered with dust, the first suspicion should be real overheating. The correct process is to power off safely, clean the heatsink, check the fan, measure cabinet temperature, check output current, and inspect the fan bearings and impeller. If cleaning delays the alarm but does not fully solve it, cabinet ventilation and load current must be checked further.

If another FC-051 displays AL29 immediately after power-on while the heatsink is cold, the problem is different. In that case, cleaning and fan replacement are unlikely to solve the fault. The temperature sensor, connector, sampling circuit, and power board should be checked.

These two examples show that the same AL29 alarm can require completely different repair paths. The key is to analyze the timing, temperature, current, and load condition.

Conclusion

AL29 on a Danfoss FC-051 inverter is mainly a power board or heatsink overtemperature alarm. The most common causes are blocked airflow, dusty heatsink, failed cooling fan, poor cabinet ventilation, high ambient temperature, excessive load current, undersized drive selection, high carrier frequency, aging thermal grease, faulty temperature feedback circuit, or abnormal heating on the power board.

The correct repair method is not to reset the alarm repeatedly or assume that the control board is faulty. The technician must first determine whether the alarm is caused by real overheating or a false temperature signal. If the drive trips after running and the heatsink is hot, focus on cooling, fan, cabinet temperature, load current, and mechanical load. If the drive trips immediately while cold, focus on the temperature sensor, sampling circuit, and power board.

Only by combining temperature measurement, current measurement, airflow inspection, load analysis, and board-level diagnosis can the AL29 fault be solved accurately and reliably.

Posted on

Deep Analysis of VACON Inverter Fault F59: Motor Temperature Signal Instability Diagnostics and Solutions

In modern industrial automation, a Variable Frequency Drive (VFD) is not only a speed controller but also the core of comprehensive motor protection. Among the Vacon (now Danfoss) series, F59 (Tmot unstable) is a highly representative fault code. Unlike the common “F16 Motor Overheat” error, F59 does not necessarily mean the motor is physically overheating; rather, it indicates that the monitoring signal itself is unreliable.

This article provides a deep technical analysis of the F59 fault, covering hardware principles, signal chains, software logic, and Electromagnetic Compatibility (EMC) to offer a practical guide for engineers.


VACON0020-1L-0004-2+DLCN

I. Definition and Essence of F59 “Tmot unstable”

In Vacon firmware, F59 represents “Motor temperature signal unstable.”

1. Fault Logic Mechanism

The inverter reads the resistance of temperature sensors (typically PT100, PT1000, or KTY84) installed in the motor windings via expansion I/O cards (such as OPT-BH or OPT-AF). The microprocessor (MCU) monitors this resistance at millisecond intervals.

If the MCU detects a drastic fluctuation in resistance that contradicts physical laws—for example, a temperature jump of more than 20°C within 100ms—the system deems the signal unstable and triggers F59. This prevents false protection or protection failure due to poor wiring.

2. Difference from F16

  • F16 (Motor Overheat): The signal is stable, but the value exceeds the protection threshold (e.g., 150°C).
  • F59 (Tmot unstable): The signal value itself is erratic, and the inverter cannot confirm the actual motor temperature.

II. Hardware Level: Sensors and Measurement Circuits

Understanding F59 requires knowing how the inverter “perceives” temperature.

1. Sensor Characteristics

Resistance Temperature Detectors (RTDs) are most common. For a PT100 sensor, the resistance at $0^\circ\text{C}$ is $100\Omega$, increasing by approximately $0.385\Omega$ per $1^\circ\text{C}$. When contact resistance or electromagnetic noise is superimposed on the circuit, the measured value oscillates, inducing F59.

2. Vacon Expansion Cards

The display showing T1->T16 suggests a multi-channel temperature acquisition module. Vacon NXP/NXS series often use the OPT-BH module. Because measurement signals are usually at the millivolt (mV) level, they are highly susceptible to interference from high-frequency carrier frequencies.


F59 fault of VACON VFD

III. Four Core Causes of F59 Faults

Based on engineering practice, F59 faults generally stem from four dimensions:

1. Physical Connection: Fatigue and Contact Resistance

  • Loose Terminals: In high-vibration environments, terminals may loosen, causing instantaneous resistance changes.
  • Shielding Failure: If the cable shield is not grounded correctly (e.g., using a long “pig-tail” instead of a 360-degree clamp), shielding effectiveness drops significantly at high frequencies.

2. Environmental Interference: EMC

  • Common Mode Coupling: High $dv/dt$ from the inverter output can couple into sensor cables. Without twisted-pair shielded cables, this noise causes sampling errors.
  • Carrier Interference: High carrier frequencies (e.g., >10kHz) combined with short sampling filter times can lead the MCU to misidentify noise as temperature spikes.

3. Hardware Aging

  • Slot Oxidation: Oxidation between the OPT-BH card and the control board can cause transient communication interruptions.
  • Capacitor Degradation: Aging filter capacitors on the expansion card lose their ability to suppress high-frequency noise.

4. Configuration: Floating Channels

If channels are activated in the software (e.g., T1->T16) but have no physical sensor attached or no matching resistor, induced voltages on these floating channels can interfere with active channels.


IV. Diagnostic Process: Step-by-Step Elimination

Step 1: Static Resistance Test

  1. Power down the inverter and wait 5 minutes.
  2. Disconnect sensor leads and measure resistance with a multimeter.
    • Reference: At $20^\circ\text{C}$, a PT100 should be approx. $107.7\Omega$.
    • Stability: If the value jumps wildly while the motor is static, the sensor or cable is damaged.

Step 2: Signal Loop and Shielding

  1. Ensure sensor cables are not parallel to power cables (maintain >30cm gap).
  2. Key Test: Replace the motor sensor at the inverter terminals with a fixed precision resistor (e.g., $110\Omega$).
    • If the fault disappears, the problem is in the external cable or motor.
    • If the fault persists, the problem is the expansion card or internal logic.

Step 3: Software Parameter Adjustment

  • Temperature Signal Filtering: Increase the filter time constant (e.g., from 1.0s to 3.0s) to smooth out transient pulses.
  • Unused Channels: Deactivate any monitored channels that do not have sensors connected.

V. Preventive Measures

  • Proper Grounding: Use single-ended grounding for sensor signals. The shield should have large-area contact with the inverter chassis via a metal clamp.
  • Signal Conversion: For distances over 50 meters, use a signal transmitter to convert PT100 signals to 4-20mA, which is much more noise-resistant.
  • Routine Maintenance: Periodically re-seat expansion cards to break through oxidation layers on pins.

Conclusion

The F59 Tmot unstable code is a warning regarding signal integrity. As seen in the provided image, the drive is in a STOP state with the red fault light active, indicating the issue exists even when the motor is not running. By focusing on physical connections, EMC shielding, and proper filtering, this technical hurdle can be efficiently resolved to ensure stable production.

Posted on

BT500 Series Inverter ERR14 Fault Analysis: Root Cause and Engineering-Level Solutions for Delayed Overload Trips

In industrial applications, faults that occur only after a period of normal operation are often more difficult to diagnose than immediate startup errors. The ERR14 fault on the BOTten BT500 series inverter is a typical example. Many engineers simply interpret it as “motor overload,” but the actual root causes are usually more complex.

This article provides a systematic and engineering-oriented analysis of the ERR14 fault, including its underlying mechanism, typical triggers, and practical troubleshooting methods.


Err14 fault of BT500 VFD

1. Definition of ERR14 Fault

ERR14 indicates a motor overload protection fault.

It is important to distinguish this from overcurrent faults. ERR14 is not triggered by a short-term current spike. Instead, it is based on an electronic thermal model inside the inverter, which simulates the heating process of the motor.

The inverter continuously calculates:

  • Motor current
  • Time duration
  • Thermal accumulation

When the accumulated thermal value exceeds a predefined threshold, the inverter trips and reports ERR14.


2. Why the Fault Occurs After One Hour of Operation

This is a key characteristic of ERR14.

The fault is triggered by thermal accumulation over time, not instantaneous conditions.

The internal logic can be summarized as follows:

  • Higher current leads to faster heat generation
  • Longer operation leads to greater heat accumulation
  • When the thermal limit is exceeded, protection is triggered

This explains the typical behavior:

  • The system runs normally at startup
  • After tens of minutes or about one hour, the fault occurs

This type of issue is essentially a chronic overload condition, not an immediate failure.


BT500 VFD displays normally

3. Five Primary Causes of ERR14 Fault

3.1 Excessive Mechanical Load (Most Common)

This is the most frequent cause in real-world applications.

Typical scenarios include:

  • Increased mechanical resistance (bearing wear, misalignment, or jamming)
  • Process changes (blocked pump, increased airflow resistance in fans)
  • Long-term operation near or above rated load

Observed behavior:

  • Normal operation at the beginning
  • Gradual increase in current
  • Eventual overload trip

3.2 Incorrect Motor Parameter Settings

If the motor parameters configured in the inverter are inaccurate, the inverter may misjudge the load condition.

Common issues include:

  • Rated current set too low
  • Incorrect motor power rating
  • Wrong number of poles

As a result:

  • The inverter may trigger overload protection prematurely
  • Or fail to reflect the actual operating condition

3.3 Over-Sensitive Overload Protection Settings

The key parameter is:

  • F9-01: Motor Overload Protection Gain

This parameter determines how quickly the inverter interprets a condition as overload.

If set too low:

  • Even moderate load levels may be treated as overload
  • Fault occurs after a period of operation

3.4 Poor Cooling Conditions

From typical field conditions, many units suffer from:

  • Heavy dust accumulation
  • Poor cabinet ventilation

These factors cause:

  • Increased internal temperature of the inverter
  • Reduced cooling efficiency of the motor

Resulting in:

  • Lower effective current capacity
  • Faster thermal accumulation
  • Increased likelihood of ERR14

3.5 Low-Speed High-Torque Operation

At low frequency operation:

  • Motor speed is low
  • Cooling fan efficiency decreases
  • Torque demand remains high

This leads to:

  • Increased current
  • Rapid heat buildup
  • Higher risk of overload trip

4. Standard Troubleshooting Procedure

The following step-by-step process can be directly applied on site.


Step 1: Check Operating Current

Use the inverter monitoring interface to read:

  • Actual running current
  • Motor rated current

Evaluation:

  • Above rated current: real overload
  • Near rated current: critical condition
  • Well below rated current: parameter or protection issue

Step 2: Inspect Mechanical System

Check for:

  • Bearing overheating
  • Mechanical jamming
  • Excessive coupling tension
  • Blockage in pumps or fans

In many cases, the root cause is mechanical rather than electrical.


Step 3: Verify Motor Parameters

Ensure the following match the motor nameplate:

  • Rated voltage
  • Rated current
  • Rated power

Incorrect parameters directly affect overload judgment.


Step 4: Optimize Overload Protection Parameters

Recommended adjustments:

  • F9-01: increase from 1.0 to 1.2–1.5
  • F9-02: increase to around 90%

Important:

  • Do not increase excessively
  • Over-adjustment may eliminate necessary protection

Step 5: Improve Cooling Conditions

Required actions:

  • Clean internal and external dust
  • Ensure cooling fans are operational
  • Improve cabinet ventilation
  • Avoid heat accumulation

Step 6: Analyze Operating Conditions

Check whether the system is:

  • Running at low frequency for long periods
  • Operating under high load continuously

If so:

  • Increase operating frequency where possible
  • Reduce load if feasible

Step 7: Evaluate Inverter Sizing

If the system operates near full load continuously:

  • The inverter may be undersized

Recommended action:

  • Upgrade to a higher power rating

5. Typical Fault Patterns

Case A

  • Fault occurs after a period of operation
  • Current near rated value
  • Visible dust accumulation

Conclusion:

  • Mild overload combined with poor cooling

Case B

  • Current is low
  • Fault still occurs

Conclusion:

  • Incorrect parameter configuration

Case C

  • Fault occurs at a consistent time interval

Conclusion:

  • Thermal model accumulation triggering protection

6. Engineering-Level Solutions

Solution 1: Reduce Mechanical Load

  • Eliminate unnecessary resistance
  • Optimize process conditions

Solution 2: Adjust Protection Parameters

Recommended setting:

  • F9-01 = 1.3
  • F9-02 = 90%

Solution 3: Correct Motor Parameters

  • Input accurate nameplate data
  • Perform motor auto-tuning if available

Solution 4: Enhance Cooling System

  • Clean dust
  • Add ventilation or fans
  • Improve airflow path

Solution 5: Upgrade Equipment

If operating current exceeds 80% of rated value continuously:

  • Replace with a higher capacity inverter

7. Conclusion

The ERR14 fault is not simply a “motor problem” or “inverter failure.” It is a system-level issue involving:

  • Electrical load
  • Thermal accumulation
  • Mechanical conditions

A delayed fault occurrence indicates that the system is operating near its thermal limit over time.

To fully resolve the issue, engineers must address three key aspects:

  • Mechanical load
  • Electrical parameter configuration
  • Cooling conditions

Only when all three are properly matched can ERR14 faults be completely eliminated in long-term operation.

Posted on

ERR05 Overvoltage Fault in ACD 900 Series (M900) VFD: Root Cause Analysis and Engineering-Level Solutions for Intermittent Shutdown After Long Runtime

In industrial applications, ACD 900 Series (M900) variable frequency drives are widely used in fans, pumps, conveyors, and general automation systems. A common field issue reported after a period of normal operation is:

The drive runs for several hours or even more than ten hours, then suddenly trips with ERR05, and the shutdown timing is irregular.

This type of fault is often misinterpreted as random failure or unstable electronics. In reality, it is a deterministic energy management problem that develops over time due to component aging, thermal effects, and load behavior.

This article provides a detailed engineering-level analysis of ERR05 faults in ACD 900 Series VFDs, along with practical diagnostic steps and permanent solutions.


ERR05 fault

1. What ERR05 Really Means in ACD 900 Series

According to the manual, ERR05 is defined as:

Acceleration Overvoltage

However, this definition is misleading in real-world scenarios.

From an engineering standpoint, ERR05 should be understood as:

DC bus overvoltage caused by regenerative energy that cannot be dissipated

In other words:

  • ERR05 is not only related to acceleration
  • ERR05 is primarily a regenerative overvoltage condition

2. Internal Mechanism of Overvoltage

The internal energy flow of the ACD 900 VFD is:

  1. AC input → Rectifier → DC bus (~540V for 380V systems)
  2. DC bus → IGBT inverter → Motor

During certain operating conditions:

  • Deceleration
  • Load inertia release
  • External force driving the motor

The motor acts as a generator:

Mechanical energy → Electrical energy → Fed back into DC bus

If this energy has no discharge path:

→ DC bus voltage rises
→ Protection threshold exceeded
→ ERR05 triggered


3. Key Characteristics of This Case

Based on the field description:

  • The drive has been used for a period (not new)
  • Fault appears after several hours
  • Fault timing is irregular
  • No fault at startup

These characteristics clearly indicate:

This is NOT a parameter or wiring issue, but a degradation or dynamic condition problem


4. Four Major Root Causes (Ranked by Probability)


4.1 DC Bus Capacitor Aging (Primary Cause)

The ACD 900 series uses electrolytic capacitors for DC bus energy storage.

Over time, capacitors degrade:

  • Capacitance decreases
  • ESR (Equivalent Series Resistance) increases
  • Heat generation increases

Consequences:

  • Reduced ability to absorb regenerative energy
  • Increased voltage fluctuation

Result:

Conditions that were previously safe now trigger overvoltage

This is the most common reason why:

  • The system worked before
  • But starts failing after months or years

4.2 Braking Resistor or Braking Unit Failure

In normal design:

  • Regenerative energy is dissipated through a braking resistor
  • Connected between “+” and “PB” terminals

Typical failures:

  • Open circuit braking resistor
  • Loose wiring
  • Damaged braking transistor (IGBT)
  • Resistance value drift

If the braking circuit fails:

Regenerative energy accumulates in DC bus → inevitable overvoltage

This matches the symptom:

  • Random trips
  • Load-dependent behavior

ACD M900 VFD

4.3 Thermal Effects and Cooling Degradation

The delayed fault (after hours) strongly suggests thermal influence.

Over time:

  • Cooling fans slow down or fail
  • Heat sinks accumulate dust
  • Internal temperature rises

Effects:

  • Capacitor ESR increases further
  • Voltage sensing drifts
  • IGBT switching characteristics change

Result:

System becomes unstable under thermal conditions


4.4 Load Condition Changes (Often Ignored)

In many cases, the VFD is not the root cause.

Typical mechanical causes:

  • Fan reverse airflow
  • Pump backflow
  • Increased inertia (belt, flywheel)
  • Mechanical looseness

These cause:

Motor enters regenerative mode unexpectedly


5. Why the Fault Appears Random

ERR05 is triggered only when multiple factors coincide:

  • High DC bus voltage
  • Certain load condition
  • Elevated temperature
  • Slightly higher supply voltage

Only when all conditions align:

Threshold exceeded → trip occurs

Therefore, the fault appears:

  • Intermittent
  • Non-repeatable at fixed times
  • “Random” to operators

But in reality:

It is a predictable physical process


6. Field Diagnostic Procedure (Practical Approach)


Step 1: Monitor DC Bus Voltage

Check monitoring parameters:

  • Normal: ~540V (380V system)
  • Before trip: rises significantly

If confirmed:

✔ Regenerative overvoltage


Step 2: Check Braking Resistor

After power off:

  • Measure resistance
  • Check for open circuit

Also verify:

  • Wiring at + / PB terminals
  • Physical condition (burn marks)

Step 3: Increase Deceleration Time

Parameter:

  • Deceleration time (e.g., F0-05)

Action:

  • Increase 2–3 times

Result:

  • If fault disappears → regeneration issue confirmed

Step 4: Inspect Cooling System

Check:

  • Fan operation
  • Dust accumulation
  • Cabinet ventilation

Step 5: Measure Input Voltage

Record:

  • Line voltage level
  • Voltage fluctuations

If consistently high:

→ reduced safety margin


Step 6: Run Without Load

Disconnect mechanical load:

  • No fault → mechanical issue
  • Still fault → electrical issue

7. Engineering Solutions (From Temporary to Permanent)


Solution 1: Increase Deceleration Time (Temporary)

Advantages:

  • Easy implementation
  • Immediate effect

Disadvantages:

  • Slower process response
  • Not a root fix

Solution 2: Install or Replace Braking Resistor (Recommended)

Advantages:

  • Directly handles regenerative energy
  • Most effective solution

Solution 3: Replace DC Bus Capacitors (Permanent Fix)

Applicable when:

  • Equipment has long service time
  • Capacitor degradation confirmed

Solution 4: Improve Cooling System

Actions:

  • Clean heat sinks
  • Replace fans
  • Improve cabinet airflow

Solution 5: Optimize Mechanical System

Examples:

  • Prevent reverse driving
  • Reduce inertia
  • Improve load stability

8. Is Main Board Failure Possible?

Main board faults typically show:

  • Immediate fault after power-on
  • Repeatable and stable error

In this case:

  • Delayed occurrence
  • Load-dependent behavior

Conclusion:

Main board failure is unlikely and should NOT be the first assumption


9. Final Engineering Conclusion

ERR05 faults in ACD 900 Series VFDs, especially after a period of operation, are not random failures but a result of energy imbalance in the system.

Core mechanism:

Regenerative energy generation → Reduced absorption capability (capacitor aging / braking failure) → DC bus voltage rise → ERR05 trip

Recommended troubleshooting priority:

  1. Braking circuit condition
  2. DC bus capacitor health
  3. Cooling system
  4. Load behavior

Only by addressing the system as a whole can the issue be permanently resolved, rather than relying on repeated parameter adjustments or component replacement.


Posted on

DELIXI CDJ1 Soft Starter Displaying E.AA With No Keypad Response: Why the Main Control Board Should Be Suspected First

When a DELIXI CDJ1 soft starter powers on, the display lights up, but shows E.AA, and none of the keypad buttons respond, this should not be treated as a normal motor overload, overcurrent, phase loss, or emergency stop fault.

For CDJ1 series soft starters, ordinary protection faults are usually displayed as defined fault codes such as Err-0, Err-1, Err-2, Err-3, Err-4, Err-5, Err-6, Err-7, Err-8, or d.Err. However, E.AA is not listed in the standard fault table. More importantly, the keypad has no response. This means the problem is probably not a normal external running fault, but an internal control system fault.

In this situation, the most likely causes are:

  • Main control board failure
  • Keypad communication failure
  • Low-voltage control power supply fault
  • EEPROM parameter storage fault
  • MCU reset or oscillator failure
  • Damaged keypad board or ribbon cable

Among these possibilities, the main control board should be considered the primary suspect, especially if reseating the keypad cable and checking the external control terminals does not change the fault.

E.AA fault

1. Basic Structure of the CDJ1 Soft Starter

The CDJ1 soft starter is used to start three-phase squirrel-cage induction motors smoothly. Its main function is to control the firing angle of three-phase thyristors, allowing the motor voltage to rise gradually during startup. This reduces starting current, mechanical shock, and stress on the motor and driven machine.

A typical CDJ1 soft starter contains several main sections.

The first section is the power circuit. This includes the three-phase input terminals, three-phase output terminals, anti-parallel thyristor modules, current detection circuits, heat sink, temperature detection, and bypass contactor control circuit.

The second section is the low-voltage control power supply. This circuit generates voltages such as +5V, +12V, or +15V for the control board, keypad board, detection circuits, relay circuits, optocouplers, and communication circuits.

The third section is the main control board. This board normally contains the MCU, EEPROM or parameter memory, reset circuit, crystal oscillator circuit, current and voltage sampling circuits, phase loss detection, thyristor trigger output, relay drive circuit, keypad interface, and communication interface.

The fourth section is the keypad display board. This board displays operating status and fault codes, scans keypad buttons, and communicates with the main control board through a ribbon cable or connector.

Under normal conditions, after power-on, the main control board performs self-checking, reads parameters from memory, checks the three-phase input, checks control terminals, verifies emergency stop input, monitors current detection signals, and then enters standby or ready mode.

If a standard fault is detected, the soft starter displays a defined fault code. If the system does not even enter the normal display and operation logic, then the fault may be inside the control system itself.

2. Why E.AA Is Not Like a Normal External Fault

For normal CDJ1 protection faults, the display should follow the fault code table. For example:

Err-0 usually indicates phase loss.

Err-1 usually indicates overheating.

Err-2 usually indicates overload.

Err-3 usually indicates light load.

Err-4 usually indicates three-phase current imbalance.

Err-5 usually indicates emergency stop.

Err-6 usually indicates overcurrent.

Err-7 usually indicates control board fault.

Err-8 usually indicates excessive starting time.

d.Err usually indicates parameter error.

The displayed code E.AA does not belong to this normal fault code format. Therefore, it should not be directly treated as phase loss, overload, overcurrent, or emergency stop.

The more important symptom is that the keypad does not respond. In a normal protection fault, the control board is still running. It detects the fault and displays the corresponding code. In that condition, the keypad should usually still work. The user should normally be able to press STOP, RESET, PRG, SHIFT, or other keys to check parameters or clear the fault.

If all buttons have no response, it means the control logic may not be running properly. The keypad board may not be communicating with the main board, or the main control board may be stuck during initialization.

This is why E.AA plus no keypad response is much more serious than an ordinary protection alarm.

CDJ1 soft starter

3. Why the Main Control Board Is a High-Probability Fault Point

The main control board is responsible for almost all logic functions inside the soft starter. If it fails, the unit may still power on and the display may still light up, but the machine will not operate correctly.

A main board fault may cause:

Abnormal display code

No keypad response

No access to parameter menu

No reset function

No RUN command acceptance

No relay output

No thyristor trigger output

No communication response

Failure to complete power-on self-test

The common causes of main board failure include aged electrolytic capacitors, unstable +5V power supply, damaged reset circuit, failed crystal oscillator, corrupted EEPROM data, damaged MCU, damaged communication interface, or external control terminal overvoltage damage.

In many cases, the board is not completely dead. The display may still show something, but the program is not running normally. This creates the impression that the machine is “alive,” while the control system is actually locked or abnormal.

That is exactly the type of condition suggested by an undefined code such as E.AA with no keypad response.

4. Low-Voltage Control Power Supply Must Be Checked First

Before replacing the main control board, the first technical check should be the low-voltage control power supply.

The +5V supply is especially important. The MCU, EEPROM, keypad communication circuit, display driver, and logic ICs all depend on a stable +5V rail. If the +5V voltage is too low, unstable, or has excessive ripple, the control board may behave abnormally.

A soft starter can still light its display even when the control power is poor. Therefore, “the display is on” does not prove that the control power supply is normal.

The technician should measure:

+5V on the main control board

+5V at the EEPROM

+5V at the keypad connector

Power supply ripple with an oscilloscope

Power-on voltage rise waveform

Relay or auxiliary control voltage

If the 5V line is only 4.3V to 4.7V, or if the ripple is very high, the MCU may reset repeatedly or run incorrectly. In that case, the fault should be repaired from the power supply section first.

Common failed parts include:

Electrolytic capacitors

Switching power supply IC

Optocoupler feedback circuit

TL431 reference circuit

Rectifier diode

Voltage regulator

Startup resistor

Solder joints around the power supply section

In older soft starters, aged electrolytic capacitors are very common. Replacing the weak capacitors may restore the main board without replacing the entire board.

5. MCU Reset Circuit Failure Can Cause No Keypad Response

The MCU needs three basic conditions to run correctly:

Stable power supply

Stable clock signal

Correct reset signal

If the reset circuit is abnormal, the MCU may not start correctly. It may remain in reset, reset repeatedly, or start before the power supply is stable.

In this condition, the display board may still light up, but the main program will not run normally. The keypad will not respond because the MCU is not processing key commands.

The reset circuit may use an RC reset circuit, a reset IC, or a watchdog reset circuit. The technician should measure the MCU reset pin during power-on. A normal reset signal should change state after the power supply becomes stable.

If the reset pin remains permanently active, the MCU will not run.

If the reset pin keeps pulsing, the board may be repeatedly restarting.

If there is no proper power-on reset delay, the MCU may start incorrectly and lock up.

Therefore, when E.AA is displayed and no key works, the reset circuit should be checked carefully.

6. Crystal Oscillator Failure Can Stop the Main Program

The MCU also needs a clock source. Many industrial control boards use an external crystal oscillator or ceramic resonator. If the oscillator does not start, the MCU cannot execute the program correctly.

Typical symptoms of oscillator failure include:

Display abnormality

No keypad response

No relay operation

No communication activity

No trigger pulse output

No parameter access

The oscillator should be checked with an oscilloscope using a 10X probe. The probe should measure each crystal pin to ground. A low-impedance probe or long ground lead may load the oscillator and stop it, so measurement technique is important.

Causes of oscillator failure include:

Damaged crystal

Changed or leaking load capacitors

Cracked solder joints

PCB contamination

Damaged MCU oscillator pins

Abnormal reset state

Noisy power supply

If replacing the crystal and capacitors does not restore oscillation, the MCU itself may be damaged.

7. EEPROM or Parameter Memory Fault

The CDJ1 soft starter depends on stored parameters. Parameters such as starting voltage, starting time, stopping time, starting mode, load type, control mode, emergency stop setting, overload protection factor, light-load detection, communication settings, parameter protection, and factory reset status are stored in non-volatile memory.

If the EEPROM data is slightly abnormal, the unit may display a parameter error such as d.Err. But if the EEPROM is seriously corrupted, shorted, unreadable, or incompatible, the MCU may fail during initialization and display an undefined code.

EEPROM-related faults can cause:

Abnormal startup display

Failure to enter parameter menu

No response to keys

Parameter error

Incorrect current rating

Communication abnormality

Random fault display

The technician should check:

EEPROM VCC voltage

SDA and SCL line voltage

Pull-up resistors on the I2C bus

Communication waveform during power-on

Whether SDA or SCL is stuck low

EEPROM solder joints

Board corrosion around the memory IC

If SDA or SCL is permanently low, the I2C bus may be locked. The cause may be the EEPROM itself, the MCU, or another device on the same bus.

If a compatible good unit is available, EEPROM data comparison may help. However, copying EEPROM data must be done carefully, because different power ratings or software versions may use different parameter calibration data.

8. Keypad Board and Ribbon Cable Should Not Be Ignored

Although the main control board is a strong suspect, the keypad board and ribbon cable must also be checked.

A faulty keypad board can create the same symptom:

Display abnormality

No key response

Wrong code shown

No communication with main board

The ribbon cable may also be loose, oxidized, broken, or poorly seated.

Common keypad-related problems include:

Aged membrane keys

Water or oil contamination

Conductive dust

Cracked solder joints

Damaged display driver

Damaged keypad MCU

Broken ribbon cable

Oxidized connector

Poor contact after vibration

The best method is cross-testing with a known good keypad board of the same model. If the machine returns to normal after replacing the keypad board, the main board may be good. If the fault remains unchanged after replacing the keypad board, the main control board becomes the most likely fault point.

The keypad model must be compatible. Similar-looking keypad boards from different versions may not use the same communication protocol.

9. External Control Terminal Damage Can Kill the Main Board

Soft starters have external control terminals such as RUN, STOP, RET, EMS, COM, relay outputs, analog output, and RS485. These terminals are designed for specific signal types. If AC220V, AC380V, or another incorrect voltage is connected to a low-voltage control terminal, the input circuit can be destroyed.

Damage may occur in:

Optocouplers

Input resistors

Zener diodes

Protection diodes

MCU input pins

RS485 communication IC

Control power supply

Once the input section is damaged, the failure may not appear as a simple terminal fault. It may cause the whole main board to lock up, display undefined codes, or stop responding to the keypad.

Therefore, before replacing a control board, all external wiring should be checked. Otherwise, a new board may be damaged again immediately after installation.

Particular attention should be paid to:

RUN/STOP/COM wiring

EMS emergency stop input

RET reset input

RS485 A/B terminals

Relay output wiring

Any external voltage connected to control terminals

Signs of burning near terminal circuits

If an external overvoltage caused the main board failure, the wiring error must be corrected before power is applied again.

10. Thyristor Trigger Circuit May Also Affect the Main Board

Although E.AA is more likely a control board fault, the thyristor trigger circuit should still be considered in deeper repair.

The main board sends trigger pulses to the thyristors through optocouplers, pulse transformers, or driver circuits. If a thyristor gate circuit is shorted, or if the trigger board is damaged, it may load the control board output or pull down the power supply.

Possible symptoms include:

Low control voltage

Hot driver components

Abnormal resistance on trigger outputs

No trigger pulses

Display abnormality when trigger cable is connected

Normal control voltage after trigger cable is disconnected

A useful method is separation testing. Disconnect the keypad board, trigger cable, communication board, or external terminal wiring one by one and observe whether the +5V supply or display behavior changes.

If the main board behaves differently after disconnecting a certain external section, that section may be dragging the main board down.

11. When Can We Say the Main Board Is Probably Faulty?

It is reasonable to suspect the main board if most of the following conditions are present:

The displayed code is not listed in the manual.

The display shows E.AA instead of a standard Err code.

All keypad buttons have no response.

External control wiring has been removed or checked.

Three-phase input is normal.

Keypad ribbon cable has been reseated.

A known good keypad board does not solve the problem.

The +5V supply, reset, oscillator, or EEPROM bus shows abnormal behavior.

There is visible corrosion, overheating, or damaged components on the main board.

SDA/SCL, reset, or communication lines are stuck.

The main board does not communicate or respond normally.

If these conditions are confirmed, the main control board fault probability is high.

However, “main board fault” is still a broad conclusion. The technician should further determine whether the problem is in the power supply, reset circuit, oscillator circuit, EEPROM, communication interface, input terminal circuit, or MCU itself.

12. Recommended Troubleshooting Procedure

A practical repair sequence should be as follows.

First, confirm the fault. Power on the soft starter and verify whether E.AA appears every time. Press all keys and check whether there is any response.

Second, disconnect external control wiring. Keep only the necessary three-phase input and ground. Remove RUN, STOP, EMS, RET, and other external control connections temporarily.

Third, inspect the keypad cable. Power off, reseat the ribbon cable, clean the connector, check for oxidation, and inspect the keypad board for contamination.

Fourth, test with a compatible keypad board if available.

Fifth, measure the control power supply. Check +5V, auxiliary voltages, and ripple with an oscilloscope.

Sixth, check the MCU reset signal during power-on.

Seventh, check the crystal oscillator waveform.

Eighth, check EEPROM VCC, SDA, and SCL lines.

Ninth, inspect the main board visually. Look for burnt resistors, cracked solder joints, leaking capacitors, corroded areas, damaged optocouplers, hot ICs, and terminal input damage.

Tenth, disconnect external internal modules one by one if needed, such as trigger cables or communication boards, to see whether the control voltage recovers.

This sequence avoids unnecessary replacement of power components and focuses on the most likely fault area first.

13. Common Repair Mistakes

One common mistake is treating every soft starter alarm as a motor problem. E.AA is not a normal overload or overcurrent code, especially when the keypad does not respond.

Another mistake is assuming that the control power supply is good because the display is lit. A weak 5V supply can still light the display but fail to run the MCU correctly.

Another mistake is trying to restore parameters through the keypad when the keypad itself has no response. Parameter recovery is impossible until the control system can operate normally.

Another mistake is replacing the keypad board without testing the main board. The keypad may be faulty, but the main board may also be the real cause.

Another mistake is replacing the main board without checking external control wiring. If a wrong external voltage damaged the first board, it may damage the replacement board again.

Another mistake is ignoring environmental causes. Dust, humidity, oil mist, heat, and vibration can cause leakage, corrosion, connector failure, and capacitor aging.

14. Repair Value Assessment

For a CDJ1-132 soft starter, board-level repair can be worthwhile if the fault is limited to the power supply, reset circuit, crystal oscillator, EEPROM, optocoupler, RS485 chip, or input protection circuit.

Repair becomes more difficult if the MCU is damaged. The MCU program is usually not publicly available. A blank MCU cannot simply be installed unless the firmware can be obtained or copied from a compatible board.

If the board is heavily corroded, burnt, carbonized, or mechanically damaged, repair reliability may be poor.

If both the main control board and power thyristor section are damaged, the repair cost will increase significantly. In that case, the cost of repair should be compared with replacing the soft starter.

For critical production equipment, the best solution is often to repair the board while preparing a replacement soft starter or spare control board at the same time. This reduces downtime risk.

15. Practical Conclusion

When a DELIXI CDJ1 soft starter displays E.AA after power-on and the keypad has no response, the fault should be treated as an internal control system abnormality rather than a normal motor or load protection fault.

The most likely fault areas are:

Main control board

Keypad communication circuit

Low-voltage control power supply

MCU reset circuit

Crystal oscillator circuit

EEPROM parameter memory

Keypad board or ribbon cable

External control terminal damage

Among these, the main control board is the most important suspect, especially if the keypad cable and external wiring have already been checked.

A proper diagnosis should focus on five basic conditions of the control board:

Power supply

Reset

Clock

Memory

Communication

If any one of these conditions is abnormal, the soft starter may display an undefined code, fail to respond to the keypad, and remain locked before entering normal operation.

Therefore, the judgment that “the main board is probably faulty” is reasonable. But in professional repair, the next step is not simply to replace the entire unit blindly. The correct approach is to locate the exact failed section on the control board, beginning with the +5V power supply, reset circuit, oscillator, EEPROM, keypad communication, and external terminal input circuits.

Posted on

After Eliminating F01112: Why a SINAMICS S120 Drive Still Shows a Flashing RDY LED and How to Restore Full Ready Status

In industrial field service, repairing a Siemens drive is rarely a matter of simply replacing a faulty board and powering the unit back on. This is especially true for the SINAMICS S120 platform, which is a highly modular drive system. In S120 architecture, the Control Unit, Power Module, EEPROM identity data, drive objects, motor data, encoder configuration, and communication structure are all tightly interlinked. A repair that resolves one layer of the system may expose issues in another.

A common and often misunderstood scenario occurs when a drive initially reports fault F01112. After replacing the power PCB or rewriting the EEPROM data, the fault disappears, the drive powers up normally, and no errors are displayed. However, a new symptom appears: the RDY (Ready) LED flashes slowly, while the COM LED remains solid green. At the same time, an identical drive installed nearby shows both RDY and COM LEDs solid green.

At this point, many engineers mistakenly assume the EEPROM data is still incorrect or that the replacement board is incompatible. In reality, this situation usually indicates that the problem has moved from a hardware identity mismatch to a commissioning state issue. The drive now recognizes the hardware, but the system has not yet completed or exited its commissioning phase.

This article provides a structured analysis of this condition, explaining the transition from EEPROM-related faults to commissioning mode behavior, and outlines a practical method to restore the drive to full Ready status.


6SL3040-1LA01-0AA0

1. Understanding the Original Fault: F01112

The fault code F01112 is often loosely interpreted as an EEPROM failure or a defective power board. However, this is not technically precise. The real meaning of F01112 is:

The Control Unit does not accept the connected Power Module due to an identity or compatibility mismatch.

In the SINAMICS S120 system, the Control Unit (such as CU310-2 PN) performs an identity verification during startup. It reads electronic nameplate data stored in the EEPROM of the power section. This data includes not only identification but also system classification, version compatibility, and configuration attributes.

If the EEPROM contains data belonging to a different system—such as G120 instead of S120—the Control Unit will reject the module and issue F01112. Importantly, this rejection occurs even if the hardware itself is electrically sound.


2. Why S120 and G120 Cannot Be Interchanged

At a hardware level, some G120 and S120 components may appear physically compatible. However, their system architectures are fundamentally different.

  • G120 is typically a more integrated system with predefined relationships between control and power components.
  • S120 is modular, with flexible combinations of Control Units, Power Modules, Motor Modules, and communication interfaces.

The CU310-2 PN is designed specifically for S120 architecture and expects a compatible Power Module with corresponding identity data. A board carrying G120 identity data may function electrically, but will not be accepted logically within an S120 system.


PM340

3. What It Means When F01112 Disappears

When F01112 is successfully cleared after rewriting EEPROM data, this indicates that:

The Control Unit now accepts the identity of the Power Module.

This is a critical milestone. It confirms that the system has passed the hardware identity verification stage. Any remaining issues are no longer related to hardware compatibility, but rather to system configuration and operational state.

At this point, continuing to suspect EEPROM data is usually a misdirection. The focus must shift to the commissioning and parameter layers.


A5E03894525

4. Interpreting the LED Status

The LED indicators provide useful but limited diagnostic information.

COM LED (Solid Green)

A solid green COM LED indicates that communication is active. This suggests that fieldbus or internal communication (such as DRIVE-CLiQ) is functioning correctly.

RDY LED (Slow Flashing Green)

A slowly flashing RDY LED, combined with no fault messages, typically indicates that:

  • The drive is not in a fault condition
  • The system is not yet fully ready for operation
  • The drive is likely in a commissioning or pre-ready state

This is consistent with a system that has not completed initial setup or has not exited commissioning mode.


5. Why Commissioning Mode Appears After EEPROM Replacement

Rewriting the EEPROM resolves identity-related issues, but does not restore all system parameters. The S120 system requires a complete set of configuration data, including:

  • Drive object definitions
  • Motor data sets (MDS)
  • Encoder data sets (EDS)
  • Control modes
  • Parameter interconnections (BICO)
  • Communication mappings

If any of these are incomplete or inconsistent, the drive may automatically enter a commissioning state.

In effect:

The system recognizes the hardware but cannot confirm that it is fully configured for operation.

This leads to the observed behavior: no fault, but not fully Ready.


s120 commissioning mode

6. Distinguishing Hardware Issues from Commissioning State

A key skill in troubleshooting is distinguishing between these two categories.

Hardware Identity Issue

  • Fault codes present (e.g., F01112)
  • System refuses to initialize
  • No progression beyond startup checks

Commissioning State Issue

  • No active fault codes
  • Communication operational
  • RDY LED flashing
  • System not enabling drive operation

Recognizing this distinction prevents unnecessary hardware interventions and focuses troubleshooting on parameter verification.


7. Critical Parameters to Check

LED indicators alone are insufficient for diagnosis. The following parameters must be checked:

r0002 – Drive State

This parameter indicates the current system status.

Typical relevant values:

  • Indicates initial commissioning required
  • Indicates commissioning mode not exited

p0009 – Control Unit Commissioning State

p0010 – Drive Object Commissioning State

p3900 – Commissioning Completion Trigger

In a fully operational system:

  • p0009 = 0
  • p0010 = 0

If p0010 is non-zero, the drive is still in commissioning mode.

To exit commissioning:

  • Complete required parameter entries
  • Execute commissioning completion (e.g., p3900)
  • Save parameters and reboot

8. Using a Working Drive as Reference

In this case, the presence of an identical, fully operational drive is extremely valuable.

The most effective approach is:

  • Read key parameters from the working drive
  • Compare them with the repaired unit
  • Identify differences in:
    • Drive object configuration
    • Motor and encoder data
    • Commissioning parameters
    • Communication setup

This direct comparison eliminates guesswork and provides a reliable path to resolution.


9. Recommended Troubleshooting Procedure

  1. Confirm that F01112 is fully cleared
  2. Observe LED states (RDY flashing, COM solid)
  3. Read r0002 to determine system state
  4. Check p0009 and p0010 for commissioning status
  5. If necessary, complete commissioning process
  6. Execute commissioning completion via p3900
  7. Save parameters to non-volatile memory
  8. Power cycle the drive
  9. Compare with a known-good system if available

10. Common Pitfalls

Many repair attempts fail at this stage due to:

  • Continuing to suspect EEPROM after it is already correct
  • Ignoring parameter-level diagnostics
  • Relying solely on LED indicators
  • Not saving parameters after modification
  • Skipping commissioning completion steps

Understanding that the problem has shifted from hardware to system configuration is essential.


11. Key Takeaways for Engineers

This case highlights three important principles:

1. Hardware and System Layers Are Interdependent

Fixing hardware identity does not guarantee operational readiness.

2. Faults Evolve Through Stages

The problem moved from identity mismatch to commissioning state.

3. Parameter Analysis Is Critical

Final system readiness depends on correct parameter configuration.


12. Final Conclusion

When a SINAMICS S120 drive clears F01112 after EEPROM correction but shows a flashing RDY LED, the issue is no longer hardware-related. Instead, it indicates that the system has not completed or exited commissioning mode.

The correct approach is to verify system state parameters, complete any required commissioning steps, and ensure all parameters are saved properly.

Only when the drive exits commissioning mode and reaches a stable state will the RDY LED become solid green, matching the behavior of a fully operational unit.

In advanced drive systems like S120, successful repair requires not only restoring hardware functionality but also ensuring full system-level readiness.