Posted on

Laser Beam Expander: Principles, Structure, Functions, Applications, Usage and Testing Methods

Introduction

Laser technology has become one of the most important technologies in modern industrial manufacturing, scientific research, precision measurement, and automated inspection systems. With the continuous improvement of measurement accuracy requirements, traditional laser sources with small beam diameters are often unable to meet the requirements of long-distance transmission, large-area measurement, and high-precision optical detection. Therefore, an important optical component called a laser beam expander has been widely adopted in various laser systems.

Although a laser beam expander may appear to be a simple optical accessory, it plays a critical role in controlling and improving laser beam characteristics. It can enlarge the laser beam diameter, reduce beam divergence, improve beam collimation, and optimize optical performance for different applications.

In industrial laser measurement equipment, such as laser diameter gauges, optical micrometers, and dimensional inspection systems, beam expanders are commonly installed at the laser emission side. By expanding the laser beam, they create a larger and more stable measurement field, improving measurement accuracy and system reliability.

A typical example is the LaserMike FLM series beam expander, which is used as an optical component in industrial measurement systems. Some models not only contain precision optical lenses but also integrate electronic control circuits, beam shutters, electromagnetic actuators, and feedback mechanisms.

This article provides a comprehensive introduction to laser beam expanders, including:

  • Operating principles
  • Optical structure
  • Mechanical and electronic design
  • Main functions
  • Industrial applications
  • Proper usage methods
  • Common failures
  • Testing and troubleshooting procedures

It is intended for engineers, technicians, equipment maintenance personnel, and anyone interested in industrial laser systems.


LaserMike FLM-101-03 laser beam expander optical micrometer module with blue metal housing, beam shutter control, optical aperture, and multi-pin cable connector shown in a professional product view.

1. What Is a Laser Beam Expander?

A laser beam expander, also known as a beam enlarger or laser beam expansion system, is an optical device designed to increase the diameter of a laser beam while reducing its divergence angle.

Simply speaking, it transforms:

Small diameter laser beam
          |
          |
          ↓
    Laser Beam Expander
          |
          |
          ↓
Large diameter low-divergence laser beam

For example:

A laser source may produce a beam with a diameter of:

2 mm

After passing through a:

5× beam expander

the output beam diameter becomes approximately:

10 mm

At the same time, the divergence angle is reduced by approximately five times.

This characteristic allows the laser beam to travel farther while maintaining better direction stability and optical quality.


2. Basic Operating Principle of Laser Beam Expanders

2.1 Telescope Optical Principle

Most laser beam expanders are based on the same principle as an astronomical telescope.

They use a combination of lenses to change the beam diameter.

The expansion ratio is determined by the focal length relationship between the lenses.

The basic relationship is:

Expansion Ratio = Output Lens Focal Length / Input Lens Focal Length

For example:

If:

  • Input lens focal length = 20 mm
  • Output lens focal length = 100 mm

The expansion ratio is:


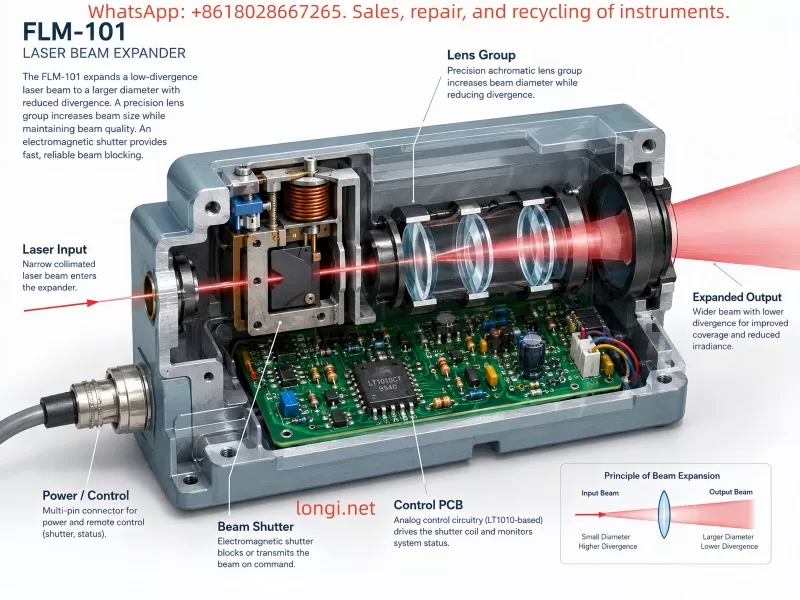
Technical cutaway illustration of a laser beam expander showing internal lens group, electromagnetic beam shutter mechanism, LT1010-based control PCB, optical path, laser input beam, and expanded low-divergence output beam.

3. Types of Laser Beam Expanders

3.1 Galilean Beam Expander

The Galilean type is the most common industrial design.

It consists of:

  • One negative lens (concave lens)
  • One positive lens (convex lens)

Basic structure:

Laser Input

     )
 Negative Lens


          (

       Positive Lens


Laser Output

Advantages:

  • Compact structure
  • No internal focal point
  • Low optical loss
  • Suitable for industrial laser systems

Because there is no internal focus point, it is widely used in high-power laser applications.


3.2 Keplerian Beam Expander

The Keplerian design uses:

  • Two positive lenses

Structure:

Positive Lens

      |
      |
  Focus Point

      |
      |

Positive Lens

Advantages:

  • Better beam quality
  • Easier to add spatial filters
  • Suitable for scientific optical systems

Disadvantages:

  • Larger physical size
  • Internal focus point exists

4. Why Does a Beam Expander Reduce Laser Divergence?

A laser beam has an important optical relationship:

When beam diameter increases, beam divergence decreases.

The approximate relationship is:

Beam Diameter × Divergence Angle = Constant

Therefore:

If a beam expander increases the beam diameter by five times:

The divergence angle decreases by approximately five times.

Example:

Before expansion:

Beam diameter:

1 mm

Divergence:

2 mrad

After 5× expansion:

Beam diameter:

5 mm

Divergence:

0.4 mrad

The expanded beam can maintain better collimation over a longer distance.


5. Internal Structure of a Laser Beam Expander

A professional industrial beam expander usually contains several important components.


5.1 Optical Lens Assembly

The optical lens assembly is the core part of the beam expander.

It usually contains:

Input Lens

Function:

  • Receives laser input
  • Adjusts initial beam characteristics

Requirements:

  • High optical transmission
  • Low optical distortion
  • High surface precision

Output Lens

Function:

  • Produces the expanded laser beam
  • Maintains beam collimation

High-quality systems use precision-ground optical lenses with anti-reflection coatings to reduce energy loss.


5.2 Mechanical Housing

Industrial beam expanders normally use:

  • Aluminum alloy
  • Stainless steel
  • Precision-machined optical mounts

The housing provides:

  • Optical alignment stability
  • Vibration resistance
  • Environmental protection

Because optical alignment accuracy can directly affect measurement accuracy, mechanical stability is extremely important.


5.3 Adjustment Mechanism

Some advanced beam expanders include adjustment mechanisms such as:

  • Magnification adjustment
  • Focus adjustment
  • Optical axis alignment

These mechanisms allow engineers to optimize the laser beam during installation and calibration.


5.4 Beam Shutter System

Many industrial laser systems include a beam shutter.

The beam shutter controls whether the laser beam can pass through.

Typical states:

OPEN

Laser beam transmitted


CLOSED

Laser beam blocked

Functions include:

  • Laser safety protection
  • Automatic machine control
  • Startup protection
  • Emergency shutdown

The LaserMike FLM-101-03 Beam Expander, for example, includes a beam shutter mechanism controlled by internal electronics.


5.5 Electronic Control Circuit

Unlike simple laboratory beam expanders, industrial models may include electronic control systems.

These circuits may contain:

  • Operational amplifiers
  • Power drivers
  • Transistor circuits
  • Electromagnetic actuator control
  • Position feedback circuits

For example, the LaserMike FLM-101-03 contains:

  • Analog control circuitry
  • LT1010CT power buffer
  • Electromagnetic shutter drive system

The electronic circuit controls the opening and closing of the optical shutter.


6. Main Functions of Laser Beam Expanders

6.1 Increasing Laser Beam Diameter

The primary function is expanding the beam diameter.

Applications include:

  • Wire diameter measurement
  • Cable inspection
  • Tube measurement
  • Precision dimensional analysis

6.2 Reducing Beam Divergence

A larger beam diameter allows the laser to maintain better collimation.

This is important for:

  • Long-distance measurement
  • Large inspection areas
  • Optical communication

6.3 Improving Measurement Stability

In industrial measurement systems, beam quality directly affects measurement accuracy.

For example, a laser diameter gauge typically works like:

Laser Source

      ↓

Beam Expander

      ↓

Measurement Field

      ↓

Receiver

A stable expanded beam creates a more accurate measurement curtain.


6.4 Increasing Scanning Range

Beam expanders are widely used in:

  • Laser scanning systems
  • 3D measurement
  • Machine vision
  • Automated inspection

7. Applications of Laser Beam Expanders

7.1 Laser Diameter Measurement Systems

This is one of the most common industrial applications.

Examples:

  • LaserMike optical micrometers
  • Laser diameter gauges
  • Wire and cable inspection systems

Applications:

  • Electrical wire
  • Optical fiber
  • Plastic tubing
  • Metal wire

Measurement principle:

The laser creates a measurement field. When an object blocks part of the beam, the receiver calculates the object size.


7.2 Laser Processing Equipment

Applications include:

  • Laser cutting
  • Laser welding
  • Laser marking

Beam expansion improves:

  • Beam quality
  • Processing stability
  • Energy distribution

7.3 Scientific Optical Systems

Used in:

  • Laser interferometers
  • Spectroscopy
  • Optical experiments
  • Research laboratories

7.4 Free-Space Laser Communication

Long-distance laser communication requires:

  • Low divergence
  • High beam stability

Beam expanders improve transmission performance by reducing beam spreading.


8. Correct Usage of Laser Beam Expanders

8.1 Laser Safety

Many beam expanders are used with:

  • Class 3B lasers
  • Class 4 lasers

Safety rules:

Do not:

  • Look directly into the output aperture
  • Observe laser emission with eyes
  • Use reflective objects for testing

8.2 Optical Lens Cleaning

Contaminated lenses may cause:

  • Reduced optical power
  • Beam distortion
  • Measurement errors

Recommended cleaning tools:

  • Optical cleaning tissue
  • Lens cleaning solution
  • Dust-free swabs

Avoid:

  • Ordinary paper
  • Rough cloth

8.3 Avoid Mechanical Shock

The internal optical alignment may require micron-level precision.

Strong impact can cause:

  • Lens displacement
  • Optical axis deviation
  • Measurement errors

9. Common Failure Analysis

Failure 1: No Laser Output

Possible causes:

Beam shutter closed

Check:

  • Mechanical shutter position
  • Control signal

Control circuit failure

Possible problems:

  • Damaged driver transistor
  • Failed power buffer
  • Broken electromagnetic coil

Missing external control signal


Failure 2: Abnormal Laser Spot

Possible causes:

  • Dirty lens
  • Damaged optical coating
  • Optical misalignment

Failure 3: Incorrect Expansion Ratio

Possible causes:

  • Mechanical adjustment failure
  • Lens position change
  • Internal mechanism blockage

Failure 4: Electronic Control Failure

Check:

  • Power supply
  • Driver circuit
  • Output stage

For example:

A damaged LT1010CT power buffer may cause:

  • Shutter failure
  • Insufficient actuator current
  • Abnormal optical control

10. Testing Methods for Laser Beam Expanders

10.1 Visual Inspection

Check:

  • Housing condition
  • Optical window
  • Connectors
  • Labels

Look for:

  • Mechanical damage
  • Corrosion
  • Moisture contamination

10.2 Optical Inspection

Use:

  • Low-power visible light source

Check:

  • Optical path condition
  • Lens contamination
  • Abnormal scattering

Never directly observe a high-power laser output.


10.3 Electrical Testing

For beam expanders with electronic control:

Do not apply power immediately.

Recommended procedure:

Step 1: Measure connector resistance

Check:

  • Short circuits
  • Open circuits
  • Coil resistance

Step 2: Identify power supply pins

Use:

  • PCB tracing
  • Component identification
  • Circuit analysis

Confirm:

  • Voltage level
  • Ground reference

10.4 Beam Shutter Test

Check:

OPEN/CLOSE operation.

Observe:

  • Mechanical movement
  • Abnormal noise
  • Sticking

10.5 PCB Testing

Important areas:

Power Section

Check:

  • Input protection
  • Filtering capacitors
  • Voltage regulation

Driver Section

Check:

  • LT1010 power buffer
  • Transistors
  • Electromagnetic coil

11. Case Study: LaserMike FLM-101-03 Beam Expander

The LaserMike FLM-101-03 is a typical industrial beam expansion module.

Its internal structure includes:

  • Optical expansion system
  • Beam shutter mechanism
  • Analog control PCB

The operating process is:

External Laser Controller

          ↓

7-pin Interface

          ↓

Analog Control Circuit

          ↓

LT1010CT Power Driver

          ↓

Electromagnetic Shutter

          ↓

Laser Beam Control

When testing this type of equipment, engineers should not simply connect a power supply and observe whether it moves.

Correct testing requires:

  1. Identifying power input pins
  2. Confirming operating voltage
  3. Checking actuator resistance
  4. Testing control electronics
  5. Verifying optical movement

Old industrial optical devices often use analog circuits rather than modern digital controllers, so careful reverse engineering and measurement are important.


12. Future Development Trends

With the development of:

  • Smart manufacturing
  • Automated inspection
  • Artificial intelligence vision systems

laser beam expanders will continue to play an important role.

Future trends include:

12.1 Higher Precision

Optical manufacturing accuracy will continue moving toward nanometer-level performance.


12.2 Intelligent Control

Future systems may include:

  • Automatic calibration
  • Beam monitoring
  • Digital communication interfaces

12.3 Integrated Optical Modules

Future laser measurement heads may integrate:

  • Laser source
  • Beam expander
  • Receiver
  • Controller

Creating complete intelligent measurement systems.


Conclusion

Although a laser beam expander is only one component in a laser system, it plays a critical role in improving beam quality, extending measurement range, reducing divergence, and increasing system stability.

Modern industrial beam expanders are not always simple optical devices. Many models integrate:

  • Precision optical lenses
  • Beam shutters
  • Electromagnetic actuators
  • Analog control circuits
  • Power driver electronics

Therefore, maintenance and troubleshooting require a comprehensive understanding of:

  • Optical principles
  • Mechanical structures
  • Electronic circuits
  • Control methods

By understanding the working principles, internal structure, applications, and testing procedures of laser beam expanders, engineers can improve equipment installation, maintenance efficiency, and fault diagnosis capability in industrial laser measurement systems.
Posted on

WDI ATF5 Laser Displacement Sensor Troubleshooting and Repair Guide: A Systematic Approach from Laser Failure to Measurement Recovery

Introduction

In modern industrial automation systems, laser displacement sensors have become essential measurement devices due to their high accuracy, fast response speed, and non-contact measurement capability. They are widely used in precision manufacturing, mechanical positioning, dimensional inspection, thickness measurement, robotic applications, and automated quality control systems.

Among industrial laser sensors, the WDI (WDI Device, Canada) ATF5 series laser displacement sensors were widely installed in industrial equipment worldwide. These sensors were designed for high-precision distance measurement applications and typically integrate a laser emission module, optical receiving system, signal processing circuits, and industrial communication interfaces.

However, after years of continuous operation, many WDI ATF5 sensors eventually experience failures caused by aging components, harsh industrial environments, electrical stress, contamination, vibration, and long-term operation.

Typical failures include:

  • Laser beam completely missing after power-up;
  • Laser is visible but distance measurement fails;
  • Unstable measurement values;
  • Large measurement drift;
  • Communication failure;
  • Internal power supply damage;
  • Laser driver circuit failure;
  • Optical receiver degradation.

For example, a WDI ATF5 SYS 658mm laser sensor manufactured in 2010 has already operated for more than ten years in many applications. Since some older models are discontinued or no longer supported by the original manufacturer, replacing the entire sensor may be expensive and time-consuming.

Professional repair and technical analysis can often restore these sensors and significantly reduce equipment downtime.

This article introduces the structure, operating principle, common failures, diagnostic procedures, and repair considerations of WDI ATF5 industrial laser sensors, providing practical guidance for maintenance engineers and industrial equipment technicians.


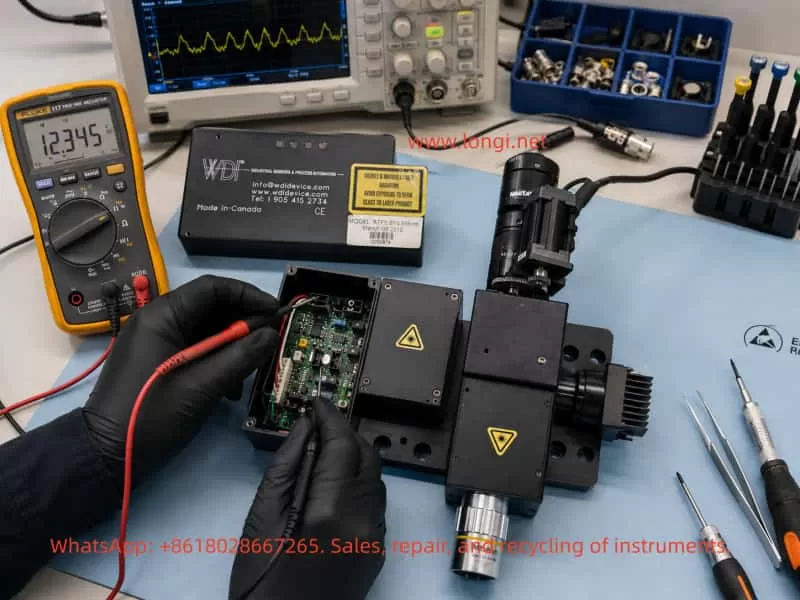
WDI ATF5 laser displacement sensor repair process with technician testing internal electronics using multimeter and oscilloscope on an industrial maintenance workbench

1. Overview of WDI ATF5 Laser Displacement Sensor

According to the equipment label:

Manufacturer: WDI Device Canada

Model: ATF5 SYS 658mm

Manufacturing Date: 08/2010

Laser Classification: Class 3B Laser Product

The device belongs to an industrial-grade laser measurement sensor equipped with a Class 3B laser source.

Class 3B laser products usually provide higher optical output power compared with ordinary industrial sensors, allowing longer measurement distances and higher measurement stability. However, they also require strict safety procedures during maintenance.

WDI ATF series sensors have been used in applications such as:

  • Automated production lines;
  • Steel processing equipment;
  • Automotive manufacturing systems;
  • CNC machines;
  • Robotic positioning systems;
  • Packaging inspection systems;
  • Precision mechanical measurement equipment.

2. Operating Principle of Industrial Laser Displacement Sensors

Understanding the measurement principle is essential before troubleshooting.

Most industrial laser displacement sensors operate based on optical triangulation technology.

2.1 Laser Emission

Inside the sensor, a semiconductor laser diode generates a stable laser beam.

The optical system focuses the laser onto the target surface.

The laser spot is projected onto the measured object.


2.2 Reflection From Target Surface

When the laser beam reaches the object:

  • Part of the light is absorbed;
  • Part of the light is reflected back toward the sensor.

The reflected light carries distance information.


2.3 Optical Receiving System

The reflected laser is captured by an optical receiver.

Common receiving components include:

  • CCD arrays;
  • CMOS sensors;
  • PSD (Position Sensitive Detector);
  • APD (Avalanche Photodiode).

The receiving element detects the position of the reflected laser spot.


2.4 Signal Processing and Distance Calculation

The internal processor calculates the distance based on:

  • Laser projection angle;
  • Receiving position;
  • Optical geometry;
  • Calibration parameters.

The final output can be provided through:

  • Analog signals;
  • Digital communication;
  • RS232/RS485 interfaces;
  • Industrial communication protocols.

3. Common Failure Modes of WDI ATF5 Laser Sensors

During industrial maintenance, WDI ATF5 sensors commonly fail in several areas.


3.1 Laser Completely Not Working

Symptoms

Typical symptoms include:

  • No visible laser spot;
  • No distance measurement output;
  • Machine controller reports measurement failure.

Many users immediately assume the laser diode is damaged. However, the actual failure may come from several different circuits.


Possible Cause 1: Laser Diode Aging or Failure

Laser diodes are consumable optical components.

After long-term operation, the laser diode may experience:

  • Reduced optical output power;
  • Increased threshold current;
  • Weak laser intensity;
  • Complete loss of emission.

For sensors manufactured around 2010, laser diode aging is a realistic possibility.


Possible Cause 2: Laser Driver Circuit Failure

The laser diode cannot be directly connected to the power supply.

It requires a dedicated driver circuit, usually including:

  • Constant-current control;
  • Current feedback circuit;
  • Temperature compensation;
  • Protection circuits.

If the laser driver fails, the laser diode may remain completely off even if the diode itself is still good.

Common failed components include:

  • MOSFET transistors;
  • Operational amplifiers;
  • Switching regulators;
  • Current sensing resistors;
  • Voltage regulators.

Possible Cause 3: Internal Power Supply Failure

Industrial laser sensors usually contain multiple voltage rails:

Examples:

  • +5V digital supply;
  • +12V analog supply;
  • Laser driver supply;
  • Optical receiver bias voltage.

If internal DC/DC conversion fails, the sensor may show:

  • No laser output;
  • No processor operation;
  • Communication failure.

3.2 Laser Works but Measurement Fails

This failure is frequently misunderstood.

A visible laser does not mean the sensor is functioning correctly.

The emission system may work while the receiving or processing system has failed.


Possible Cause 1: Optical Receiver Failure

The receiving module may fail due to:

  • Strong light exposure;
  • Dust contamination;
  • Aging;
  • Static electricity damage.

The sensor may still emit laser light but cannot calculate distance.


Possible Cause 2: Optical Window Contamination

Industrial environments often contain:

  • Oil mist;
  • Dust;
  • Metal particles;
  • Chemical contamination.

Contamination on the optical window can reduce reflected light intensity.

The result:

  • Laser is visible;
  • Measurement becomes unstable;
  • Distance readings become incorrect.

Cleaning must be performed carefully.

Ordinary paper or rough materials should not be used because optical coatings can easily be damaged.


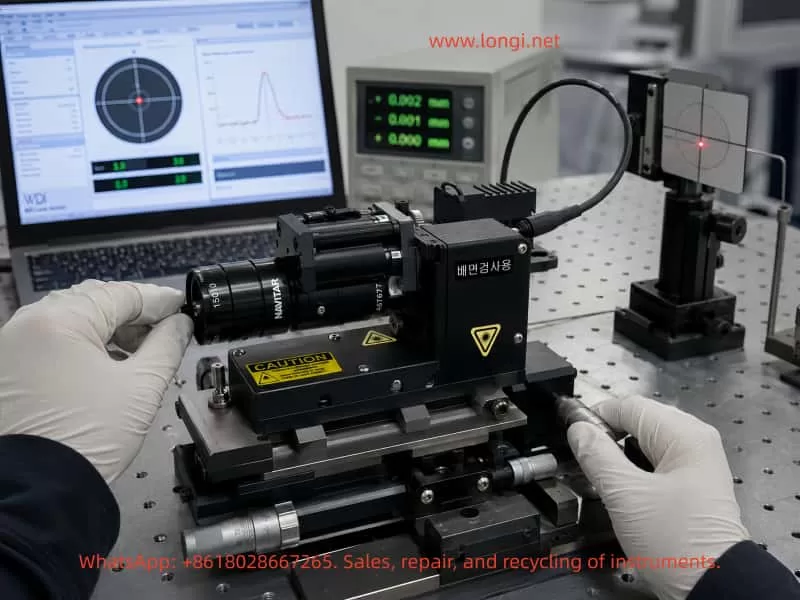
WDI ATF5 laser sensor optical calibration and alignment testing on precision optical bench with laser measurement equipment

3.3 Unstable Measurement or Signal Drift

Symptoms

The sensor operates but produces:

  • Jumping values;
  • Poor repeatability;
  • Incorrect distance readings.

Cause 1: Unstable Laser Output

When laser power decreases:

The receiving signal becomes weak.

The internal algorithm continuously compensates, causing:

  • Measurement fluctuation;
  • Increased noise;
  • Drift.

Cause 2: Temperature Compensation Failure

Industrial laser sensors usually include temperature compensation.

The system uses:

Temperature sensor → Compensation algorithm → Corrected output

If:

  • Temperature sensor fails;
  • Calibration data is lost;
  • Processor malfunctions;

temperature-related measurement errors may occur.


Cause 3: Mechanical Installation Problems

Laser measurement accuracy depends heavily on mechanical alignment.

Problems such as:

  • Loose mounting screws;
  • Equipment vibration;
  • Optical axis movement;

can create measurement errors.


4. Professional Diagnostic Procedure for WDI ATF5 Repair

When a customer reports:

“The laser is broken”

the first step should not be replacing the laser module.

A systematic inspection process is required.


Step 1: Check External Conditions

Power Supply Inspection

Measure:

  • Input voltage;
  • Voltage stability;
  • Startup voltage behavior;
  • Power ripple.

Many sensor failures are caused by:

  • Incorrect voltage;
  • Reverse polarity;
  • Damaged industrial power supplies.

Wiring Inspection

Confirm:

  • Positive and negative power connections;
  • Signal wiring;
  • Communication cables.

Step 2: Check Indicator Status

Observe:

  • LED indicators;
  • Alarm status;
  • Communication status.

Different symptoms indicate different failure areas.

For example:

CPU running but laser missing

Focus on:

  • Laser driver circuit;
  • Laser diode.

No indicators at all

Focus on:

  • Internal power supply.

Step 3: Internal Circuit Inspection

After opening the sensor, inspect key sections.


Power Supply Section

Check:

  • DC/DC converter output;
  • Voltage regulators;
  • Electrolytic capacitors;
  • Switching devices.

Aged capacitors are common problems in older industrial electronics.


Laser Driver Section

Important measurements:

  • Laser supply voltage;
  • Driver current;
  • Feedback signal.

Special caution:

A laser diode should never be tested like a normal resistor.

Incorrect measurement methods may permanently damage the laser component.


Step 4: Determine Whether the Laser Module Is Damaged

Method 1: Measure Driver Output

If:

  • Driver circuit output is normal;
  • Correct current is supplied;
  • Laser remains off;

the laser diode is likely damaged.


Method 2: Replace With a Compatible Module

A replacement laser module can be used for testing.

However, replacement is not simply a plug-and-play operation.

The following may require adjustment:

  • Optical alignment;
  • Laser power;
  • Calibration parameters.

5. Major Technical Challenges During Laser Sensor Repair

5.1 Laser Module Matching

Industrial laser modules require precise specifications:

Including:

  • Wavelength;
  • Optical output power;
  • Operating current;
  • Beam divergence;
  • Focal distance.

Using an incorrect replacement may cause:

  • Reduced measurement range;
  • Poor accuracy;
  • Signal instability.

5.2 Optical Calibration

The most important part of a laser displacement sensor is not only the laser source.

It is the complete combination of:

Laser source + optical structure + calibration algorithm

After replacing optical components, recalibration is usually required.

Otherwise:

  • Short distance measurement may work;
  • Long distance measurement may become inaccurate.

5.3 Lack of Technical Documentation

Many older industrial sensors have problems such as:

  • Manufacturer discontinued support;
  • Software unavailable;
  • Calibration files missing.

Repair engineers often need to rely on:

  • Circuit analysis;
  • Component testing;
  • Comparison with working units;
  • Reverse engineering techniques.

6. Common Mistakes During Repair

Mistake 1: Assuming Laser Failure Immediately

A missing laser beam does not always mean the laser diode is damaged.

Many failures are caused by:

  • Power supply circuits;
  • Driver circuits;
  • Control electronics.

Mistake 2: Replacing Laser Diode Without Calibration

A new laser diode may not match the original optical characteristics.

Without calibration:

  • Measurement accuracy cannot be guaranteed.

Mistake 3: Ignoring Environmental Factors

Some sensors recover simply after:

  • Optical window cleaning;
  • Connector cleaning;
  • Cable inspection.

7. Testing Requirements After Repair

A repaired WDI ATF5 sensor should not only be tested for laser emission.

A complete verification procedure is required.


7.1 Laser Output Verification

Confirm:

  • Stable laser emission;
  • Correct beam intensity;
  • No abnormal fluctuation.

7.2 Distance Accuracy Test

Test multiple measurement points.

Example:

  • 100 mm;
  • 300 mm;
  • 500 mm;
  • 658 mm.

Check:

  • Linearity;
  • Measurement error;
  • Repeatability.

7.3 Long-Term Stability Test

Perform continuous measurement testing.

Observe:

  • Data fluctuation;
  • Temperature influence;
  • Communication stability.

7.4 Machine Integration Test

After repair:

Install the sensor back into the machine.

Verify:

  • PLC communication;
  • Measurement feedback;
  • Automatic control operation.

8. Economic Value of Repairing WDI ATF5 Sensors

For industrial equipment, replacement is not always the best solution.

Reason 1: Production Downtime Cost

A factory shutdown can cost much more than sensor repair.


Reason 2: Replacement Compatibility Problems

A new sensor may require:

  • Mechanical modification;
  • New wiring;
  • Software changes;
  • PLC programming updates.

Reason 3: Existing Calibration Data

The original sensor already matches:

  • Machine geometry;
  • Software settings;
  • Control system parameters.

Repair allows the equipment to continue operating with minimal changes.


Conclusion

The WDI ATF5 SYS 658mm laser displacement sensor is an example of a high-value industrial measurement device that can often be restored despite being more than ten years old.

When facing problems such as:

  • No laser output;
  • Measurement failure;
  • Signal instability;
  • Communication errors;

engineers should avoid replacing components blindly.

A professional diagnostic process should follow:

Power inspection → Control circuit analysis → Laser driver testing → Optical system inspection → Calibration → Machine operation verification

Industrial laser sensor repair is not simply replacing damaged parts. It requires understanding the interaction between optical systems, electronic circuits, mechanical alignment, and software calibration.

Through systematic troubleshooting and professional repair methods, many discontinued industrial laser sensors can be successfully restored, reducing equipment replacement costs and improving the reliability of automation systems.

Posted on

Diagnosing and Maintaining Stiff Stereomicroscope Holder Rotation on an Ultramicrotome

In an ultramicrotome, the stereomicroscope holder is not merely an accessory for visual observation. It is an important part of the operator interface that affects how easily the user can monitor the specimen block, knife edge, water boat, floating sections, and ribbon formation during cutting.

On systems such as the RMC PowerTome XL, the stereomicroscope is mounted on an adjustable support assembly that can be moved laterally or rotated to provide a suitable viewing angle. Under normal conditions, this holder should move smoothly across its working range while still maintaining enough friction to remain stable in the selected position.

A common problem on older ultramicrotomes is that the stereomicroscope holder becomes stiff, uneven, or difficult to move. In some cases, the holder may rotate freely on both sides but become noticeably resistant only when it approaches the central position, approximately parallel to the main longitudinal axis of the instrument.

This type of symptom is important because it does not always indicate a simple lack of lubrication in the vertical pivot. When resistance appears only at one particular angle, the cause is often related to local mechanical interference, internal cable tension, misalignment, or a binding linkage rather than a uniformly dry rotation shaft.

This article explains the mechanical logic behind this fault, describes likely causes, and provides a structured troubleshooting and maintenance approach for stereomicroscope holder rotation problems on ultramicrotomes.


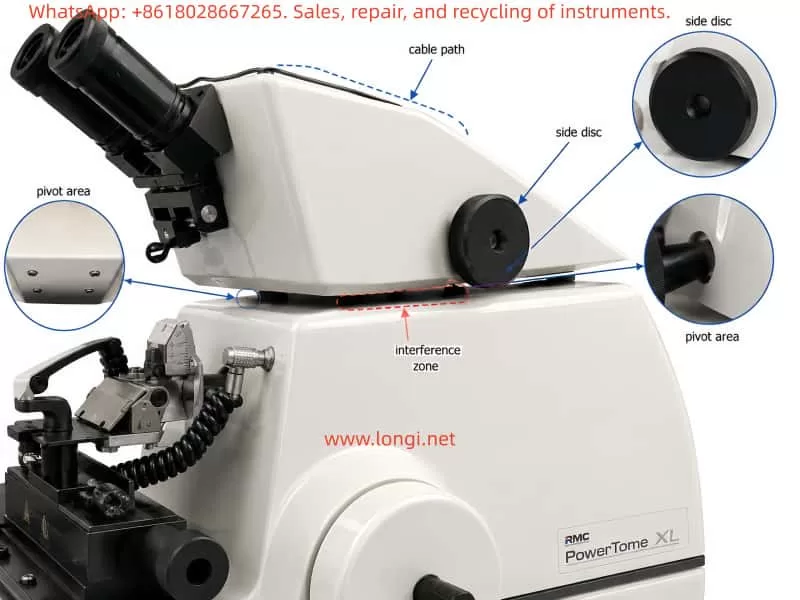
Technical diagnostic illustration of an RMC PowerTome XL ultramicrotome stereomicroscope holder, highlighting the pivot area, side adjustment disc, cable path, and possible interference zone that may cause localized rotation resistance.

1. Function of the Stereomicroscope Holder

During ultrathin sectioning, the operator must accurately observe the relationship between the specimen block and the knife edge. The stereomicroscope is used to inspect:

  • Specimen trimming progress
  • Knife edge position
  • Clearance angle
  • Water boat condition
  • Floating section ribbons
  • Section compression
  • Knife contamination
  • Section collection area

For this reason, the stereomicroscope holder must allow comfortable positioning without excessive force. At the same time, the holder must remain stable once the desired observation angle has been selected.

A properly functioning holder should have the following characteristics:

  • Smooth movement over the full rotation range
  • Light but controlled friction
  • No sudden increase in resistance
  • No metal-to-metal rubbing noise
  • No cable pulling or twisting
  • No visible movement of the microscope when the holder is stationary
  • Stable positioning without drifting or swinging back

The ideal mechanical condition is not “completely loose.” A well-designed holder usually has a small amount of intentional friction or damping so that the microscope remains where the operator places it.


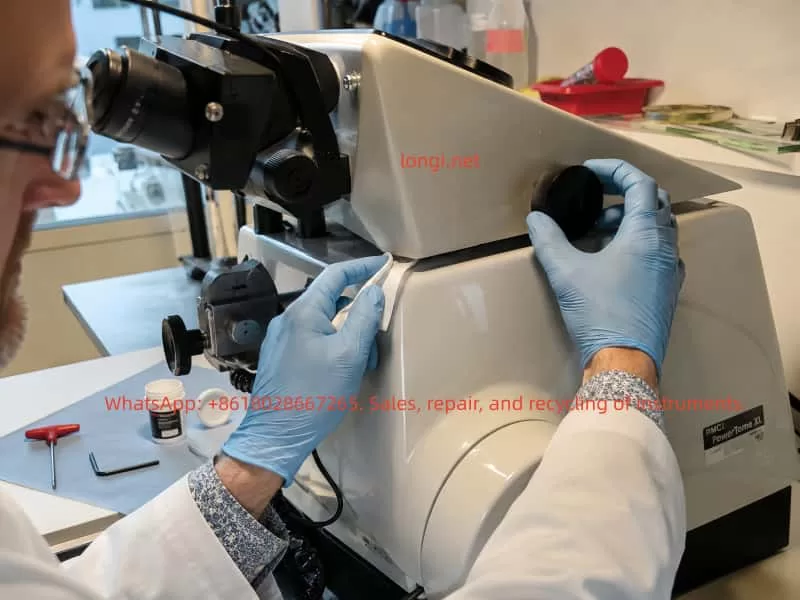
Laboratory technician inspecting and servicing the stereomicroscope holder mechanism on an RMC PowerTome XL ultramicrotome, checking the side adjustment disc and pivot area for friction, binding, or lubrication issues.

2. Common Mechanical Designs Used in Microscope Holders

The mechanical design of microscope holders varies between manufacturers and instrument generations. However, most designs fall into several general categories.

2.1 Single Vertical Pivot Design

The simplest design uses a central vertical shaft mounted in a bushing or bearing. The microscope support rotates around this vertical axis.

The assembly may include:

  • Vertical steel shaft
  • Bronze or polymer bushing
  • Thrust washer
  • Friction disc
  • Spring washer
  • Adjustment screw
  • Locking screw
  • Retaining collar

In this type of system, dried grease or excessive preload usually causes resistance across the entire rotation range.

2.2 Dual-Side Support or Synchronized Adjustment Design

Some ultramicrotomes use a more complex holder structure with two external side discs, knurled wheels, or adjustment knobs. These may be connected internally through a shaft, linkage, cam system, or friction mechanism.

The visible black discs may not be simple locking knobs. They may be part of a synchronized lateral viewing system or a mechanical support structure for the stereomicroscope holder.

Possible internal components include:

  • Connecting shafts
  • Cam followers
  • Friction discs
  • Eccentric mechanisms
  • Linkage rods
  • Gear segments
  • Retaining collars
  • Compression springs
  • Position stops

In such systems, a problem that occurs only at one angle may be caused by internal binding rather than a dry central axis.

2.3 Combined Sliding and Rotating Support Systems

Some holders include both lateral travel and rotational movement. These may use guide rails, sliding blocks, pivot joints, or adjustable friction pads.

Over time, hardened grease, dust accumulation, corrosion, or mechanical misalignment may cause uneven movement.

2.4 Holder Assemblies with Internal Wiring

Modern stereomicroscope holders may contain or guide several cables, including:

  • Microscope illumination wires
  • Camera cables
  • LED power cables
  • Video output cables
  • Fiber-optic light guides
  • Sensor wiring
  • Internal control harnesses

These cables move with the holder. If they are routed incorrectly, trapped inside the support, or too tight, they can create resistance at a specific point in the rotation travel.


3. Why Localized Resistance Is an Important Clue

One of the most useful diagnostic details is whether the resistance is uniform or localized.

If the holder feels stiff through the entire movement range, likely causes include:

  • Dried grease
  • Corroded pivot shaft
  • Tight friction adjustment
  • Overloaded spring washer
  • Worn bushing
  • Excessive mechanical preload
  • Contaminated thrust surface

However, if the holder moves relatively freely on both sides and becomes difficult only near the central position, the diagnosis changes.

Localized resistance usually suggests one of the following:

  • A cable is being stretched or compressed
  • A mechanical stop is contacting too early
  • A linkage is binding at its center position
  • A cam or friction plate is misaligned
  • A support component is touching the instrument housing
  • An internal wire harness is trapped
  • A retaining collar is offset
  • The holder assembly is slightly distorted
  • A side adjustment mechanism is becoming tight at a specific geometry

This distinction is critical. Adding oil to a pivot will not solve a cable-routing problem, a misaligned cam, or a mechanical interference issue.


4. Typical Failure Modes

4.1 Hardened or Aged Lubricant

Lubricants gradually age. Grease may become thick, dry, sticky, or contaminated by dust. In humid or coastal environments, corrosion can also accelerate degradation.

Typical symptoms include:

  • Stiff movement across the full rotation range
  • Rough or dry feeling during movement
  • Resistance increasing in cold conditions
  • Slight improvement after repeated movement
  • Uniform friction in both directions

The correct repair normally involves disassembly, removal of old grease, cleaning of the shaft and bushing, inspection for damage, and application of a thin layer of suitable precision lubricant.

4.2 Excessive Friction Adjustment

Many support systems include a friction adjustment mechanism to prevent the microscope from moving unintentionally.

If this adjustment becomes too tight, the holder may become difficult to rotate. Causes include:

  • Adjustment screw tightened too much
  • Spring washer compressed excessively
  • Friction pad swollen or distorted
  • Incorrect reassembly after previous service
  • Retaining collar moved from its original position

In some systems, the friction is not perfectly uniform. A cam, offset washer, or eccentric component may cause higher resistance near one position.

4.3 Internal Cable Tension

Internal cable tension is one of the most overlooked causes of localized resistance.

A cable may be pulled tight when the holder reaches a certain angle. The cable may then act like a spring, pulling the holder back or creating a noticeable resistance zone.

Signs of cable-related resistance include:

  • Holder moves freely on one side but tightens near the center
  • Resistance changes if cables are moved by hand
  • Visible cable stretching or twisting
  • Resistance stronger in one direction than the other
  • No obvious grinding sound
  • Holder tends to return slightly after release

Cable problems may occur because of:

  • Incorrect cable routing
  • Lost cable clamp
  • Cable tie installed too tightly
  • Aged stiff cable insulation
  • Excessive cable shortening during previous repair
  • Internal harness trapped between moving parts

4.4 Mechanical Interference with the Housing

If the holder or support structure has shifted slightly, it may contact the main instrument housing at a particular angle.

This may be caused by:

  • Instrument impact during transport
  • Loose mounting screws
  • Deformed sheet-metal cover
  • Bent support bracket
  • Misaligned bearing housing
  • Previous incorrect assembly
  • Wear in the pivot bushing

Visible clues may include:

  • Paint scratches
  • Bright metal rubbing marks
  • Plastic dust
  • Black powder from friction surfaces
  • Uneven gaps between the holder and instrument body
  • Contact marks near the pivot region

4.5 Binding in a Dual-Side Adjustment Mechanism

When a holder has large side discs or synchronized wheels, the mechanism may include a complex internal transmission system.

Potential faults include:

  • Dry cam surface
  • Misaligned synchronizing shaft
  • Loose retaining screw
  • Damaged friction disc
  • Uneven spring tension
  • Bent internal linkage
  • Worn or cracked plastic bushing
  • Binding gear segment
  • Offset eccentric mechanism

This type of problem often produces localized resistance because the mechanical geometry changes during rotation.


5. Why Oil Should Not Be Applied Immediately

It is tempting to apply oil directly into a visible gap around the rotation axis. However, this is not recommended until the fault source has been confirmed.

Several risks exist.

5.1 Oil Can Enter Sensitive Areas

Low-viscosity oil may migrate into:

  • Microscope optics
  • Knife area
  • Sample stage
  • Internal electronic components
  • Friction pads
  • Cable channels
  • Instrument housing

Once oil migrates, it can collect dust and create sticky deposits.

5.2 Penetrating Sprays Can Remove Original Grease

Products such as general-purpose penetrating sprays may temporarily reduce friction, but they can also dissolve or displace the original grease. This may leave internal components poorly protected after the solvent evaporates.

5.3 Excess Lubricant Can Create New Problems

Too much grease or oil can:

  • Attract dust
  • Increase contamination risk
  • Spread into the cutting area
  • Affect friction adjustment
  • Cause the holder to become too loose
  • Stain laboratory surfaces or specimens

5.4 Lubrication Will Not Fix Mechanical Interference

If the real problem is a trapped cable, a rubbing housing, or a binding linkage, oil will not solve it. It may only hide the issue temporarily.


6. Recommended Inspection Procedure

Before considering disassembly, the following inspection procedure should be followed.

Step 1: Make the Instrument Safe

Before handling the holder:

  • Switch off the instrument
  • Disconnect power if necessary
  • Remove the knife or move it to a safe position
  • Remove the specimen block if possible
  • Protect the cutting area
  • Ensure the holder cannot swing into the knife assembly

Ultramicrotome knives are extremely sharp. Even minor movement of the microscope holder can create an accident risk if the knife is exposed.

Step 2: Identify the Exact Tight Position

Move the holder slowly through its full travel and record:

  • Where the resistance begins
  • Whether the resistance is repeatable
  • Whether it is stronger when moving left-to-right or right-to-left
  • Whether the holder stops suddenly or gradually
  • Whether any rubbing sound is present
  • Whether the holder moves more easily when lifted slightly

If the resistance always occurs at the same position, this strongly indicates a geometry-related issue rather than random lubrication failure.

Step 3: Inspect Cables and Wiring

Carefully check:

  • Microscope rear cables
  • Illumination cables
  • Fiber-optic light guides
  • Camera wiring
  • Cable loops behind the holder
  • Cable routing under the support
  • Wiring near the side adjustment discs
  • Any wires entering the main housing

At the tight position, inspect whether any cable becomes:

  • Straightened
  • Twisted
  • Compressed
  • Pulled against a sharp edge
  • Pinched between moving parts
  • Tensioned around the pivot

A cable may be hidden inside the support housing, so visible external wiring should not be assumed to be the only source.

Step 4: Check for Contact Marks

Inspect the holder and surrounding housing for:

  • Scratched paint
  • Polished metal contact areas
  • Plastic rubbing marks
  • Wear debris
  • Uneven clearances
  • Deformed covers
  • Loose panels

Mechanical interference often leaves visible evidence.

Step 5: Test the Side Adjustment Discs

If two large side discs or knurled wheels are present, compare their behavior at different holder positions.

Check:

  • Are both discs equally easy to turn?
  • Do they become tight when the holder reaches the difficult central position?
  • Does turning one disc affect the other?
  • Is there any slipping, clicking, or irregular motion?
  • Does one disc have significantly more resistance than the other?

If the discs also become stiff near the same position, the problem is likely inside the synchronized adjustment mechanism.

If the discs remain smooth but the holder itself becomes difficult to swing, the problem is more likely related to the main pivot, cable routing, or housing interference.


7. Components That Should Not Be Removed First

Without a detailed service manual or exploded drawing, several components should not be removed casually.

These include:

  • Large black knurled side discs
  • Center screws inside the side discs
  • Retaining screws supporting the holder assembly
  • Bottom screws that may hold the entire support structure
  • Screws near internal spring or friction mechanisms
  • Any screw that appears to retain a shaft

Removing these parts may cause:

  • Misalignment of the microscope holder
  • Loss of synchronization between both sides
  • Release of springs or friction washers
  • Shift of the rotation center
  • Loss of stable positioning
  • Difficulty restoring original adjustment
  • Damage to internal cable routing

Before removing any screw, the support structure should be properly supported and photographs should be taken from multiple angles.


8. Proper Lubrication Method

If inspection confirms that the pivot shaft or bushing is genuinely dry or contaminated, lubrication should be performed correctly.

The goal is not to flood the mechanism with oil. The goal is to restore a thin, stable lubricating film.

A suitable lubricant should have:

  • Low evaporation rate
  • Good metal compatibility
  • Good plastic compatibility
  • Stable behavior over time
  • Low migration tendency
  • Appropriate viscosity
  • Resistance to humidity and oxidation

Suitable choices may include precision synthetic grease or PTFE-compatible instrument grease, depending on the materials involved.

A typical lubrication procedure includes:

  1. Remove the holder assembly carefully.
  2. Photograph all components before disassembly.
  3. Clean old grease from the shaft, bushing, thrust washers, and friction surfaces.
  4. Inspect for corrosion, scoring, burrs, cracks, or uneven wear.
  5. Apply a very thin layer of suitable grease.
  6. Reassemble in the original order.
  7. Adjust preload gradually.
  8. Test movement across the full rotation range.
  9. Confirm that the holder remains stable but not excessively tight.

Excess lubricant should always be removed. The mechanism should not have visible grease squeezing out around the pivot.


9. When Professional Service Is Recommended

Professional service should be considered when any of the following conditions are present:

  • The holder binds strongly at one position
  • The holder produces metal scraping sounds
  • The side adjustment discs are not synchronized
  • The holder has vertical play or wobble
  • The holder suddenly releases after resistance
  • Internal cables appear to be trapped
  • The support structure touches the instrument housing
  • The holder is difficult to reassemble after partial disassembly
  • The instrument has high-value optical or cutting accessories
  • The mechanism includes hidden springs, cams, or friction components

Although the fault may appear minor, incorrect disassembly can affect the microscope position, viewing geometry, cable routing, and long-term usability of the ultramicrotome.


10. Conclusion

A stiff stereomicroscope holder on an ultramicrotome should not automatically be treated as a lubrication problem.

When the holder is difficult to move only near the central position, the most likely causes are localized mechanical interference, cable tension, internal linkage binding, misalignment, or non-uniform friction adjustment.

The correct diagnostic approach is:

  1. Identify whether resistance is uniform or localized.
  2. Inspect cables and external contact points.
  3. Check for housing interference and wear marks.
  4. Compare the behavior of side adjustment mechanisms.
  5. Avoid unnecessary disassembly.
  6. Lubricate only after confirming that the pivot or bushing is the true source of the problem.

A careful inspection sequence can prevent unnecessary damage and reduce the risk of contaminating a precision ultramicrotome with unsuitable lubricants. Proper diagnosis is more important than immediately applying oil, especially when the symptom is angle-dependent rather than constant.

Posted on

Systematic Diagnosis of Oxygen Measurement Errors in Online Oxygen Analyzers: From Optical Source Overheating and Optical Path Misalignment to Analog Signal Acquisition Faults

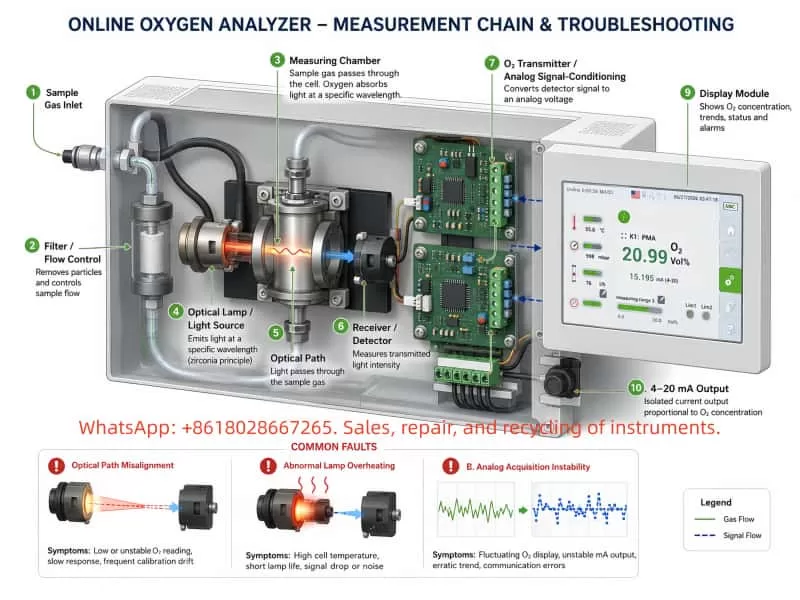
Online oxygen analyzers are widely used in flue gas monitoring, industrial furnaces, inert-gas protection systems, chemical processes, combustion control, gas blending, environmental monitoring, and laboratory applications. Compared with portable oxygen meters, an online analyzer is usually a multi-module system consisting of a sample gas path, flow-control section, measuring chamber, optical source or sensing element, signal-conditioning circuit, analog acquisition module, display controller, alarm circuit, and 4–20 mA output stage.

When an analyzer begins to show incorrect oxygen concentration, users often suspect sensor aging, chamber contamination, or calibration drift. In many cases, operators attempt to correct the issue by adjusting zero, span, or internal parameters. However, for analyzers incorporating an optical source, measuring chamber, optical receiver, analog conditioning circuitry, and signal-acquisition electronics, calibration alone may only temporarily correct the displayed value. It may not resolve deeper problems such as optical reference drift, excessive optical-source heating, optical-path misalignment, or unstable analog acquisition.

This article examines a representative troubleshooting case involving an online oxygen analyzer with abnormal oxygen readings, an overheating optical lamp assembly, intermittent analog signal loss, and a condition in which the displayed oxygen value could be adjusted close to 20.99% O₂ by changing the lamp position. The purpose is to provide a systematic diagnostic framework for third-party maintenance engineers and technical personnel.


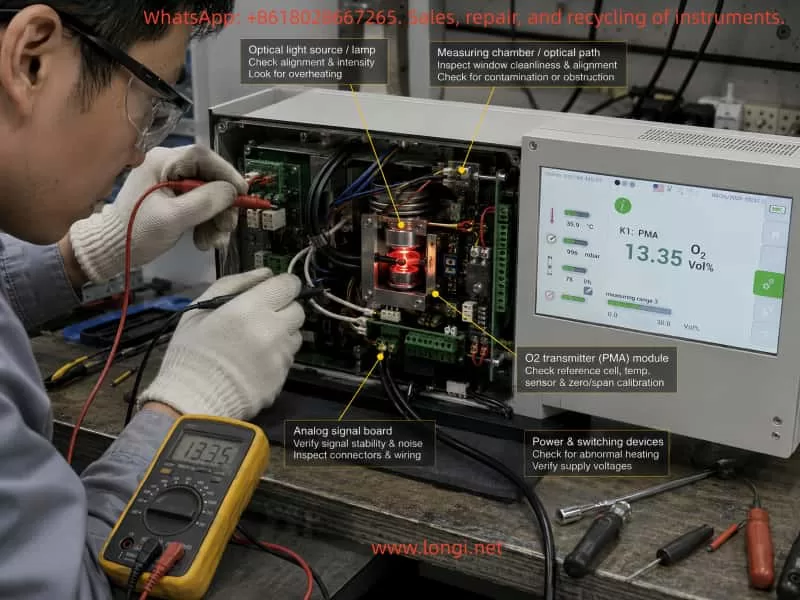
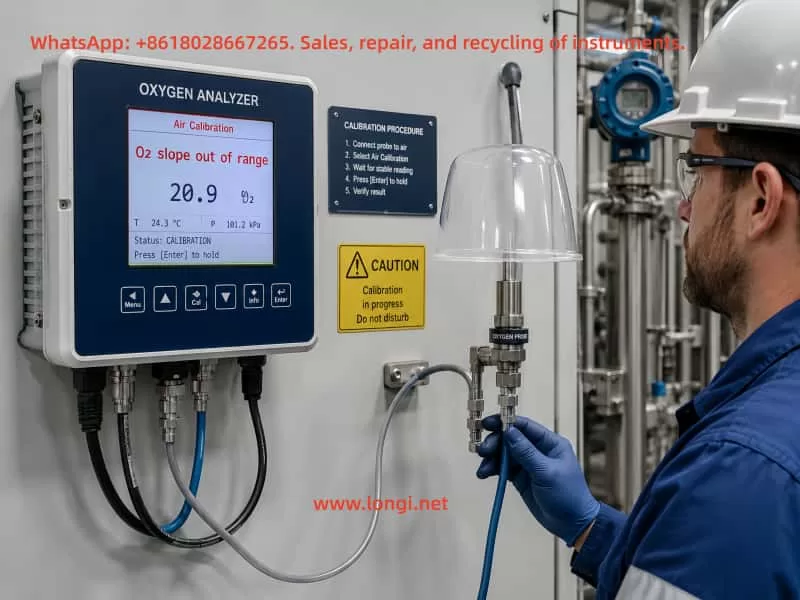
Technician diagnosing an online oxygen analyzer with the enclosure open, inspecting the optical light source, measuring chamber, analog signal board, transmitter module, and power switching devices using a multimeter.

1. A Displayed Oxygen Value Does Not Prove That the Measurement System Is Healthy

One of the most common misunderstandings in analyzer troubleshooting is assuming that the instrument is functioning normally simply because it powers on, displays an oxygen value, and has a normal sample flow.

In reality, the displayed oxygen concentration is the final result of a multi-stage measurement chain. If any part of that chain drifts, weakens, becomes contaminated, or loses electrical stability, the analyzer may still display a seemingly reasonable value even though the actual oxygen measurement is incorrect.

A typical measurement chain can be summarized as follows:

Sample Gas
   ↓
Sampling Line and Filter System
   ↓
Flow Control and Pressure Stabilization
   ↓
Measuring Chamber
   ↓
Optical Source / Sensing Element / Receiver
   ↓
Analog Signal Conditioning
   ↓
A/D Conversion and Controller Processing
   ↓
Display, Alarm, and 4–20 mA Output

Any fault within this chain can create measurement errors. Typical examples include:

  • Air leakage into the sample gas line;
  • Plugged filters reducing actual sample flow;
  • Moisture or condensate entering the chamber;
  • Oil mist or dust contamination on optical windows;
  • Optical lamp aging or reduced brightness;
  • Optical source position shift;
  • Receiver sensitivity reduction;
  • Analog amplifier offset drift;
  • Reference-voltage instability;
  • A/D conversion errors;
  • Connector oxidation or intermittent contact;
  • Analog-output failure;
  • Incorrect parameter compensation masking hardware faults.

Therefore, an engineer should never evaluate an oxygen analyzer only by looking at the final number on the display. The correct question is:

How is that number being generated, and are all physical and electrical stages producing valid information?


2. Persistent Low or High Oxygen Readings Should Not Immediately Be Attributed to Chamber Contamination

Measuring-chamber contamination is indeed one of the most common causes of online analyzer errors. In flue gas, chemical off-gas, oil mist, dusty gas streams, humid gas, or corrosive process environments, the internal gas path can become contaminated by:

  • Fine dust deposits;
  • Condensed moisture;
  • Oil film;
  • Hydrocarbon residue;
  • Acidic compounds;
  • Salt crystals;
  • Optical-window contamination;
  • Internal flow-path deposits;
  • Restricted flow channels;
  • Filter blockage.

These conditions can cause slow response, zero drift, span deviation, poor repeatability, nonlinear response, or unstable oxygen readings.

However, chamber contamination should not become the default explanation for every oxygen-measurement problem.

If the analyzer also shows any of the following conditions, the problem is likely more complex than simple chamber contamination:

  • The optical lamp or glass source becomes abnormally hot;
  • Lamp brightness appears unusually strong or unstable;
  • A power transistor or switching device overheats severely;
  • Analog output cannot be read intermittently;
  • Internal analog acquisition becomes unavailable;
  • Disconnecting a cable causes the display to fall to zero;
  • Reconnecting a cable restores the reading but with offset;
  • Moving the lamp position significantly changes the oxygen reading;
  • Mechanical adjustment of lamp distance can force the display close to 20.99% O₂.

These symptoms indicate that the fault may involve the optical measurement system, lamp-driving circuit, analog conditioning stage, or A/D acquisition path.


Technical cutaway diagram of an online oxygen analyzer showing the sample gas path, filter and flow control, measuring chamber, optical lamp, detector, analog signal-conditioning board, display module, and 4–20 mA output with common fault locations.

3. The Optical Source Is a Measurement Reference, Not Merely a Lamp

In analyzers using an optical source, optical chamber, receiver, and signal-processing circuit, the lamp is not simply an illumination device. It is part of the measurement reference system.

Depending on the analyzer design, the source may be a miniature lamp, infrared emitter, heated optical element, or special light-emitting component. Regardless of design, its function is to provide stable optical energy to the measurement chamber. The receiver then evaluates light intensity, absorption changes, spectral behavior, or optical-path variation to determine the gas concentration.

For correct operation, the optical source must satisfy several conditions:

  1. Stable light output;
  2. Stable operating position;
  3. Correct optical direction;
  4. Accurate alignment with the receiving area;
  5. Proper electrical drive current;
  6. Controlled operating temperature;
  7. Fixed geometric relationship to the chamber and receiver;
  8. No movement due to vibration, thermal expansion, loose mounting, or previous maintenance work.

Even a small mechanical shift in lamp distance, angle, height, or centering can alter the received optical signal.

For example:

  • Increasing lamp-to-receiver distance may reduce received light intensity;
  • Moving the lamp off-axis may reduce effective light transmission;
  • Changing lamp height may shift the light spot away from the receiver window;
  • Changing lamp angle may alter reflection and refraction characteristics;
  • A loose mounting bracket may create unstable readings during vibration.

Therefore, if moving the optical lamp causes a major oxygen-reading change, the lamp position and optical alignment are directly influencing the measurement.

This is an important diagnostic finding, but it does not automatically mean the analyzer is fully repaired.


4. Why Adjusting the Reading to 20.99% O₂ Does Not Automatically Mean the Analyzer Is Fully Repaired

The oxygen concentration in clean ambient air is approximately 20.9%. Therefore, when an analyzer displays around 20.99% O₂ while sampling air, it may appear to have returned to normal operation.

However, from an engineering and measurement perspective, this only proves that:

At the current lamp position, current temperature, current gas flow, and current environmental condition, one measurement point is close to the expected value.

It does not prove that the entire analyzer has been restored to specification.

The following conditions may still be incorrect:

  • Zero-point accuracy;
  • Span-point accuracy;
  • Mid-range linearity;
  • Lamp alignment relative to design center;
  • Lamp current and electrical drive condition;
  • Lamp thermal stability;
  • Receiver sensitivity;
  • Analog signal stability;
  • 4–20 mA output accuracy;
  • Long-term drift behavior;
  • Temperature influence;
  • Flow-rate influence;
  • Pressure influence;
  • Repeatability after restart.

For example, an analyzer may display 20.99% O₂ in air but still display 1.5% O₂ when exposed to nitrogen or 90% O₂ when exposed to a high-oxygen calibration gas. In such a situation, the air point appears correct while the zero point, span point, or linearity remains defective.

Therefore:

Adjusting the air point to approximately 20.99% O₂ is a positive indication that the optical path can still generate usable signal, but it is not a replacement for complete calibration and stability verification.


5. Diagnostic Significance of Optical Source Heating and Power Transistor Overheating

If the glass lamp, optical source, nearby metal fixture, or lamp-driving transistor becomes noticeably hot, the condition must be evaluated carefully.

Some lamp temperature rise may be normal. However, there is a major difference between normal operating temperature and abnormal overheating.

Normal operating behavior may include:

  • Gradual warm-up after power-on;
  • Stable light intensity after warm-up;
  • Controlled temperature rise;
  • No continuous brightness increase;
  • Manageable temperature on the driving device;
  • No smell of overheating;
  • No discoloration of wiring or plastic;
  • Stable oxygen reading;
  • Stable analog output.

Abnormal overheating may include:

  • Lamp brightness gradually increasing without stabilization;
  • Temperature continuing to rise;
  • Power transistor becoming too hot to touch quickly;
  • Strong heat around the glass lamp;
  • Oxygen reading drifting with temperature;
  • Analog output becoming unstable;
  • Reading changing significantly when the lamp is moved;
  • Measurement returning to zero or becoming implausible;
  • Burnt smell or thermal discoloration;
  • Output instability after several minutes of operation.

When a power transistor overheats, it may be operating under one or more abnormal conditions:

  1. Excessive lamp current;
  2. Continuous full-duty operation;
  3. Incorrect PWM duty cycle;
  4. Incomplete transistor switching;
  5. Linear-region operation with high power dissipation;
  6. Optical lamp load abnormality;
  7. Current-limiting circuit failure;
  8. Current-sense resistor drift;
  9. Lamp resistance change due to aging;
  10. Drive voltage too high;
  11. Faulty solder joints;
  12. Degraded capacitors or gate-drive components;
  13. Inadequate heatsinking.

For this reason, any analyzer with a visibly overheating lamp and hot switching transistor should not be left powered for long periods during troubleshooting. Continued operation may damage the lamp, power transistor, PCB traces, connectors, wiring insulation, or surrounding plastic components.


6. Avoid Misidentifying the Optical Lamp as a Temperature Sensor

Inside industrial analyzers, many components are black, glass-sealed, mounted under metal clamps, or connected with two wires. Such parts can easily be mistaken for thermistors, temperature probes, thermal cutoffs, optical sensors, or heating elements.

In optical analyzers, however, a glass-bodied component may simply be the optical lamp.

A lamp and a temperature sensor can appear physically similar, but their behavior is different.

FeatureOptical Lamp / Light SourceNTC/PTC Temperature Sensor
Emits visible light when poweredOften yesNormally no
Generates significant heatOften yesUsually minimal
Driven by power transistorCommonUsually not directly
Affects optical signal directlyYesNormally indirect
Reading changes when position is movedYesUsually no
Requires optical alignmentYesNo
May contain visible filament or glowing areaOftenNormally not

If moving the component changes oxygen readings significantly, it is much more likely to be part of the optical source or optical path than a simple temperature-measurement device.

This distinction is important because an incorrect assumption may send troubleshooting in the wrong direction. A glowing lamp should not be treated as a failed thermistor merely because it becomes hot.


7. Why Analog Signal Acquisition Faults Can Make an Analyzer Look Normal While Remaining Unreliable

Many online oxygen analyzers do not display raw sensor output directly. Instead, the signal passes through several analog and digital stages before appearing on the screen.

A simplified signal path may look like this:

Optical Receiver Signal
   ↓
Pre-Amplifier
   ↓
Filtering and Offset Conditioning
   ↓
Reference Comparison
   ↓
A/D Conversion
   ↓
Microcontroller Calculation
   ↓
Display Value
   ↓
4–20 mA Output

If any stage in this signal chain becomes unstable, the analyzer may display an incorrect value even while the optical system remains functional.

Typical analog-chain problems include:

  • Operational-amplifier offset drift;
  • Precision-resistor value change;
  • Reference-voltage instability;
  • Connector oxidation;
  • Broken solder joints;
  • Weak analog ground;
  • A/D input-channel fault;
  • Leaky filter capacitors;
  • Reduced photodetector output;
  • Gain change in amplifier stages;
  • Faulty analog isolator;
  • Internal 4–20 mA output failure;
  • Electrical interference entering weak signal lines.

When the analyzer has previously shown symptoms such as “analog signal unreadable,” “output temporarily missing,” “display returns to zero after a connector is removed,” or “reading restores after reconnection,” the following areas should be inspected carefully:

  1. Sensor-to-transmitter connectors;
  2. Signal-conditioning board supply rails;
  3. Analog ground and reference ground;
  4. Optical receiver output;
  5. Amplifier input and output stages;
  6. A/D converter input;
  7. 4–20 mA output module;
  8. Connector pins and solder joints;
  9. Cable strain-relief points;
  10. Isolation circuits and internal relays.

Such faults are dangerous because the analyzer may appear normal under one condition but drift again when temperature changes, vibration occurs, power fluctuates, or a connector moves slightly.


8. Optical Path Errors and Analog Acquisition Errors Are Often Coupled

In many analyzers, optical faults and analog signal faults are not independent.

For example, if the lamp moves away from its intended optical position, the receiver receives less light. The analog amplifier may then amplify a weaker signal more aggressively. The display may still show a reasonable oxygen value, but the signal-to-noise ratio becomes poor.

Under these conditions, the analyzer may become sensitive to:

  • Vibration;
  • Temperature variation;
  • Lamp movement;
  • Power-supply ripple;
  • Flow-rate changes;
  • Connector contact resistance;
  • Electromagnetic interference;
  • Warm-up time;
  • Internal mechanical stress.

Typical field behavior may include:

  • Calibration appears successful but does not remain stable;
  • Reading changes after warm-up;
  • Oxygen display fluctuates after vibration;
  • 4–20 mA output differs from displayed value;
  • Small lamp movement causes large oxygen changes;
  • A stable reading is only achieved at a very specific lamp position;
  • Restarting the analyzer temporarily changes performance;
  • Analog signal becomes weak or unavailable intermittently.

Therefore, adjusting the lamp position alone may produce a correct reading at one point but does not address the underlying electrical stability of the analog measurement chain.

Likewise, repairing only the analog board without restoring correct lamp alignment may leave the optical measurement reference unstable.

A reliable repair requires both the optical and electronic measurement chains to be restored.


9. Recommended Diagnostic Sequence: Confirm the Physical Measurement Chain Before Adjusting Parameters

For an online oxygen analyzer showing inaccurate readings, the following diagnostic sequence is recommended.

Step 1: Verify Basic Operating Conditions

Check:

  • Supply voltage stability;
  • Grounding quality;
  • Sample flow rate;
  • Sample pressure;
  • Gas dryness;
  • Filter condition;
  • Condensate presence;
  • Sampling-line leakage;
  • Air ingress;
  • Measuring-chamber contamination.

This step eliminates external gas-path problems.


Step 2: Verify Optical Source Operation

Check:

  • Whether the lamp turns on correctly;
  • Whether brightness stabilizes after warm-up;
  • Whether heating is excessive;
  • Whether the lamp mount is loose;
  • Whether lamp position is centered;
  • Whether lamp distance has changed;
  • Whether the lamp is tilted;
  • Whether the glass body is darkened or aged;
  • Whether lamp leads are oxidized;
  • Whether the socket or clamp is loose;
  • Whether supply voltage and lamp current are reasonable.

If moving the lamp slightly causes a large oxygen-reading change, inspect the lamp holder, mounting bracket, alignment guide, retaining clip, positioning slot, and mechanical reference surfaces.


Step 3: Inspect the Optical Path and Measuring Chamber

Check:

  • Optical-window contamination;
  • Oil film;
  • Dust accumulation;
  • Condensate;
  • Oxidation on reflective surfaces;
  • Receiver-window contamination;
  • Obstruction in the optical path;
  • Lamp-to-receiver alignment;
  • Loose internal fasteners;
  • Incorrect position after previous maintenance.

The purpose of this step is to restore optical transmission efficiency and mechanical alignment.


Step 4: Inspect the Power Driver and Heating Circuit

Check:

  • Lamp supply voltage;
  • Lamp operating current;
  • Switching-transistor temperature;
  • Heatsink condition;
  • Transistor leakage or short circuit;
  • PWM drive waveform if available;
  • Current-sense resistor value;
  • Current-limiting components;
  • Electrolytic capacitor condition;
  • Gate-drive components;
  • PCB solder joints;
  • Supply voltage level.

If the switching transistor becomes extremely hot, do not run the analyzer for long periods until the drive stage has been checked. Continued overheating may damage the lamp and PCB.


Step 5: Inspect Analog Acquisition and Signal Conditioning

Check:

  • Signal-conditioning board supply rails;
  • Sensor signal presence;
  • Amplifier output stability;
  • Reference voltage;
  • Analog ground;
  • Connector integrity;
  • A/D sampling input;
  • 4–20 mA output consistency;
  • Signal behavior when lamp position changes;
  • Signal behavior when connectors are moved.

The objective is to confirm that the physical optical signal is being converted and delivered correctly to the controller.


Step 6: Perform Calibration Only After Hardware Stability Is Confirmed

Once the optical source, optical path, power driver, measuring chamber, and analog acquisition chain are stable, perform zero and span calibration.

Recommended verification points include:

  • Zero gas point;
  • Ambient air point;
  • Span-gas point;
  • Intermediate concentration point;
  • Long-term stability;
  • 4–20 mA output accuracy;
  • Alarm threshold behavior;
  • Flow-rate sensitivity;
  • Temperature sensitivity.

Adjusting parameters before restoring the hardware baseline may hide the real fault and make subsequent diagnosis more difficult.


10. Post-Repair Verification Must Include Stability, Not Only Instantaneous Accuracy

After repairing an online oxygen analyzer, the instrument should not be considered acceptable based only on one displayed value.

At minimum, the following verification steps are recommended.

1. Ambient Air Verification

With clean air applied, the analyzer should indicate approximately 20.9% O₂.

However, this is only one verification point.

2. Zero Verification

Apply suitable zero gas and confirm that the low-oxygen reading approaches the expected zero range without excessive residual value.

3. Span Verification

Apply a known oxygen calibration gas to verify span accuracy.

4. Linearity Verification

Use at least two different oxygen concentrations to check whether the analyzer responds proportionally across its intended range.

5. Long-Term Run Test

Operate the analyzer for at least 30 minutes, one hour, or longer while observing:

  • Lamp temperature;
  • Power-transistor temperature;
  • Oxygen drift;
  • Analog-output stability;
  • Flow stability;
  • Alarm behavior;
  • Signal dropouts;
  • Restart repeatability.

6. Analog Output Verification

Confirm that displayed oxygen value and 4–20 mA output correspond correctly. Verify the output at:

  • Zero oxygen point;
  • Ambient-air point;
  • Full-scale point;
  • Intermediate concentration point.

Only after all of these conditions are satisfied can the analyzer be considered stable for long-term operation.


11. Conclusion: Oxygen Measurement Errors Are Often System-Level Faults Rather Than Single-Component Problems

For online oxygen analyzers containing an optical source, measuring chamber, receiver, and analog signal-acquisition circuitry, inaccurate oxygen readings should not automatically be blamed on chamber contamination or calibration drift.

When the analyzer shows a combination of symptoms such as:

  • Incorrect oxygen concentration;
  • Abnormal lamp or glass-source heating;
  • Severe heating of the power transistor;
  • Oxygen reading affected by lamp position;
  • Display returning close to 20.99% after optical adjustment;
  • Intermittent analog signal loss;
  • Display changes caused by connector status;
  • Temporary recovery after parameter calibration;
  • Risk of drift after warm-up,

the problem should be treated as a combined fault involving the optical measurement chain, lamp-driving system, and analog acquisition electronics.

The correct maintenance philosophy is not merely to adjust parameters or clean the measuring chamber. The analyzer should be examined sequentially through:

Gas path → optical source → optical path → power driver → analog acquisition → output circuit → calibration → stability verification.

Only when the optical source is mechanically stable, lamp heating is controlled, the receiver signal is sufficient, analog acquisition is stable, 4–20 mA output matches the display, zero and span are correct, and long-term drift remains within acceptable limits can the analyzer be considered fully restored for reliable industrial operation.

Posted on

Repair and Functional Verification of the AM IN Port on a Gooch & Housego 200 MHz RF Driver

1. Background and Practical Repair Challenges

RF drivers manufactured by Gooch & Housego and similar companies are widely used in laser processing systems, acousto-optic modulators, optical measurement instruments, fiber laser systems, laboratory equipment, and precision motion or beam-control applications.

These RF drivers are normally designed to drive AOMs, AO deflectors, or other loads requiring a stable RF excitation source. In many systems, the RF driver runs at a fixed carrier frequency while an external modulation input controls whether the RF output is enabled, disabled, or amplitude-modulated.

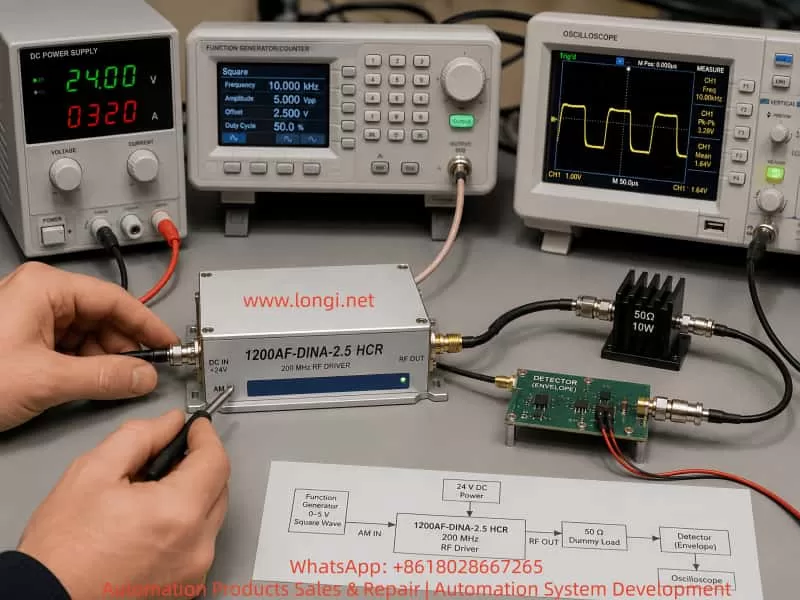
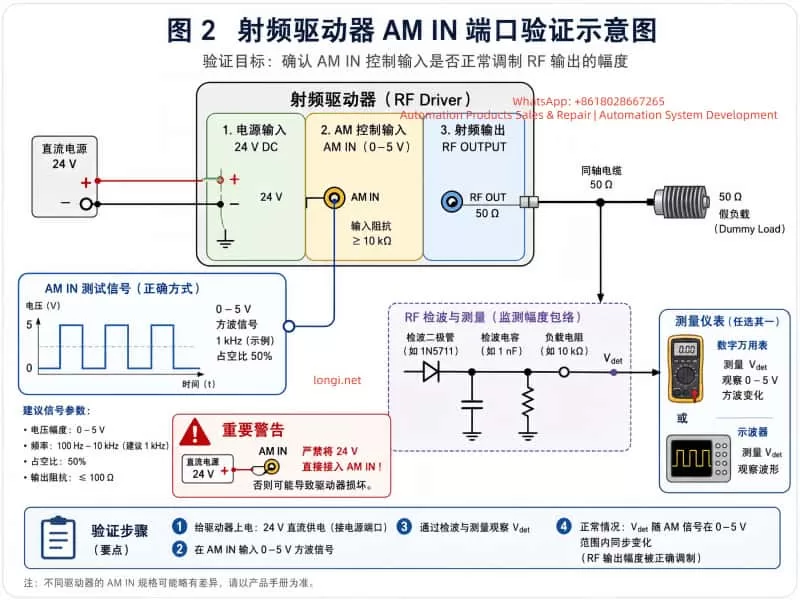
This article uses the Gooch & Housego 1200AF-DINA-2.5 HCR RF driver as an example. The discussed fault condition is a common field failure: the external AM IN port was incorrectly connected to a 24 V industrial control signal, causing damage to the modulation input circuit. After repair, the main question becomes: how can a technician safely verify that the AM IN function, RF switching path, and RF output path have been restored when only basic instruments are available?

The difficulty is not simply whether the unit powers up. A correct repair verification requires answering several technical questions:

  1. What is the correct DC supply voltage for the RF driver?
  2. Is AM IN a 24 V industrial control input, a TTL input, or an analog modulation input?
  3. How should the RF output be terminated during test?
  4. Can a normal oscilloscope probe be connected directly to the RF output?
  5. How can RF output activity be confirmed without an RF power meter or spectrum analyzer?
  6. How should a simple detector circuit be connected?
  7. What conditions prove that AM IN actually controls the RF output?

A proper test sequence should follow the logic below:

Verify correct DC supply
→ Connect a suitable RF load
→ Apply the correct AM IN control voltage
→ Convert RF output into a low-frequency or DC detector signal
→ Compare RF output at AM IN low and high states
→ Apply square-wave modulation and verify synchronized switching

Only after this chain has been verified can the technician reasonably conclude that the AM IN interface, control logic, RF generation path, RF power amplifier, and RF output path are operating normally.


A real-world electronics laboratory setup showing a Gooch & Housego 1200AF-DINA-2.5 HCR 200 MHz RF driver under test. The device is connected to a 24V DC power supply, a function generator producing a 0–5V square wave into the AM IN port, and an RF output feeding a 50Ω dummy load. A simple RF detector circuit is connected to an oscilloscope displaying the modulation waveform. The scene includes test instruments, coaxial cables, SMA connectors, and a technician’s hand probing the AM IN input, illustrating practical RF driver repair and verification.

2. Main Interfaces and Operating Principle

The front panel of this type of RF driver normally includes three important electrical connections:

AM IN
Vcc +24V
RF OUTPUT

Their functions are different:

  • Vcc +24V: Main DC supply input.
  • AM IN: External modulation or RF-enable control input.
  • RF OUTPUT: RF power output to the AOM, AO device, or matched RF test load.

The internal architecture of a typical fixed-frequency RF driver can be simplified as follows:

24 V DC input
↓
Internal DC regulation and bias circuits
↓
RF oscillator or frequency source
↓
RF enable / modulation control circuit
↓
RF pre-amplifier stage
↓
RF power amplifier stage
↓
RF OUTPUT connector

The AM IN port is not a power supply terminal. It is a control input. Depending on the model, AM IN may be an analog modulation input, a digital enable input, a TTL input, or a logic-controlled RF switching input.

For a model identified as DINA, the practical testing approach should normally follow a digital-input logic method. In other words:

Low level → RF output disabled or strongly reduced
High level → RF output enabled

For initial testing, the safest control levels are generally:

Low level: 0 V
High level: approximately +3.3 V to +5 V

A 24 V industrial control signal must not be applied directly to this port unless the manufacturer explicitly specifies a 24 V input rating.


3. Why Applying 24 V to AM IN Can Damage the Driver

In industrial equipment, technicians often encounter 24 V PLC outputs, relay outputs, photoelectric sensors, solenoid control circuits, and other standard 24 VDC control systems. Because the RF driver has an interface labeled “AM IN,” it may be incorrectly assumed that this port can accept an industrial-level input signal.

That assumption can destroy the input circuit.

The AM IN port may internally connect to one or more of the following circuits:

  • TTL logic input buffer;
  • CMOS digital input;
  • comparator input;
  • transistor switching stage;
  • optocoupler input;
  • RF-enable control transistor;
  • PIN diode bias circuit;
  • RF gain-control circuit;
  • ESD protection diode network;
  • logic gate or pulse-shaping stage.

Many of these components are designed for low-voltage logic operation.

Typical limits may be approximately:

TTL input: normally 0 V to 5 V
CMOS input: normally 0 V to 3.3 V or 5 V
Comparator input: limited by supply rails
Small-signal transistor junctions: low reverse-voltage tolerance
ESD clamp diode: damaged if high current is forced through it

When 24 V is directly injected into AM IN, the failure path may be:

24 V applied to AM IN
↓
Input series resistor overheats or burns
↓
Protection diode becomes shorted or open
↓
Logic IC input pin is damaged
↓
Control transistor is punctured
↓
RF enable command becomes abnormal
↓
RF output stays permanently OFF, permanently ON, unstable, or intermittent

For this reason, repairing the visibly damaged resistor or diode may not be sufficient. The technician should also verify whether the following stages still work:

AM IN voltage recognition
↓
Logic-level conversion
↓
RF enable switching
↓
RF oscillator control
↓
RF power amplifier enable chain

A clean technical infographic illustrating the AM IN verification process for a 200 MHz RF driver. The diagram shows three main sections: 24V DC power input, AM IN control input (0–5V square wave), and RF output connected to a 50Ω dummy load. A simplified RF detector circuit feeds a multimeter or oscilloscope to measure modulation response. A warning clearly indicates that 24V must not be applied directly to the AM IN port. The layout uses structured blocks, arrows, and labeled signal paths to explain RF driver functional testing methodology.

4. Why the Internal RF Power Module Gets Hot

Inside the RF driver, there may be a wideband RF power amplifier module, such as an RFHIC module or another hybrid RF amplifier block. This component is not a normal digital IC or low-power transistor. It is a high-frequency RF power amplifier.

Such modules may operate with characteristics similar to:

Supply voltage: 24 VDC
Frequency range: tens of MHz to hundreds of MHz or higher
Output capability: several watts
Quiescent current: hundreds of milliamps

Even with no full RF output, the amplifier may consume significant current due to bias circuits and RF amplifier operating conditions.

For example:

24 V × 0.6 A = 14.4 W

Much of that energy becomes heat.

Therefore, it is normal for an RF power amplifier module to become warm or hot after power is applied. However, the technician must distinguish between normal heating and abnormal overheating.

Normal heating conditions

  • The module warms gradually after power-on.
  • The metal heat spreader becomes noticeably warm after one or several minutes.
  • DC current remains stable.
  • The RF load is correctly connected.
  • Temperature rise is controlled and repeatable.
  • AM IN switching causes only moderate changes in current or temperature.

Abnormal heating conditions

  • The module becomes extremely hot within a few seconds.
  • The power supply immediately enters current limit.
  • The current is much higher than expected.
  • The RF output is left open or badly mismatched.
  • The RF amplifier remains fully enabled even when AM IN is low.
  • The module heats strongly even with no valid RF activity.
  • There is visible discoloration, smoke, smell, or abnormal noise.

The RF power amplifier must be firmly attached to its aluminum heat sink or metal chassis. If the module is tested without proper thermal contact, thermal grease, thermal pad, or mechanical pressure, it may overheat rapidly and be damaged.


5. Why RF OUTPUT Must Be Connected to a Load

The RF output of this driver is not a normal DC output. It is a high-frequency RF source, typically designed around a 50 Ω transmission system.

Most RF cables, RF test instruments, spectrum analyzers, RF power meters, directional couplers, and RF amplifier outputs use 50 Ω as the standard impedance.

Therefore, the correct RF load should be:

50 Ω

The correct connection is:

SMA center pin
↓
50 Ω load resistor
↓
SMA outer shell / RF ground

The resistor must be connected across the RF center conductor and RF ground. It is not placed in series with the line.

A correct physical arrangement is:

SMA center pin ── 50 Ω resistor ── SMA outer shell

The SMA outer shell is the RF return path. It is normally connected to the RF ground, chassis ground, and usually the DC supply negative reference.

There is no need to connect the resistor separately to building earth or protective earth. The critical connection is from the RF center pin to the SMA metal shell.

If the RF output is open-circuit or badly mismatched, RF energy is reflected back toward the power amplifier:

RF output not properly terminated
↓
Reflected RF power returns to amplifier
↓
Voltage standing wave ratio increases
↓
Power transistor load condition becomes abnormal
↓
RF amplifier temperature rises
↓
Possible instability or amplifier damage

For this reason, the RF output should never be left open for extended testing.


6. Can a 75 Ω Resistor Be Used for Temporary Testing?

A true 50 Ω RF dummy load is preferred. However, during repair work, a technician may only have a 75 Ω / 5 W cement resistor or another non-standard resistor available.

A 75 Ω resistor can be used for short-duration functional verification, but it should not be treated as a permanent RF load.

For a 50 Ω RF source driving a 75 Ω load, the reflection coefficient is:

Γ = (ZL - Z0) / (ZL + Z0)

Where:

ZL = 75 Ω
Z0 = 50 Ω

Then:

Γ = (75 - 50) / (75 + 50)
Γ = 25 / 125
Γ = 0.2

This corresponds approximately to a voltage standing wave ratio of:

VSWR ≈ 1.5 : 1

A VSWR of approximately 1.5:1 creates some reflected power, but for a small RF driver producing only a few watts, it is usually acceptable for short functional testing if the amplifier temperature and current are carefully monitored.

The following conditions must be observed:

  1. The resistor must have sufficient power rating, preferably 5 W or higher.
  2. The resistor leads must be kept extremely short.
  3. One resistor lead must connect to the SMA center pin.
  4. The other resistor lead must connect directly to the SMA outer shell.
  5. Long wires must not be used.
  6. Testing should be brief.
  7. If current rises sharply or the RF amplifier becomes excessively hot, power must be removed immediately.

At 200 MHz, lead length is important. Long resistor leads add inductance. Long wires behave like antennas. A 75 Ω resistor connected by several centimeters of wire may no longer behave like a simple 75 Ω load at RF frequency.

For a temporary hand-built load:

Keep resistor leads as short as possible.
Ideally, each lead should be only a few millimeters long.

The preferred long-term solution is:

50 Ω SMA termination load
Power rating: at least 5 W

7. Why a Normal Oscilloscope Probe Should Not Be Connected Directly to RF OUTPUT

A standard oscilloscope probe usually has an input impedance such as:

1 MΩ in parallel with several pF

But the RF output is designed for:

50 Ω

Connecting a normal oscilloscope probe directly to the RF output creates severe mismatch.

Possible consequences include:

  • Strong RF reflection;
  • Distorted waveform;
  • Incorrect amplitude reading;
  • Probe ground lead acting as an antenna;
  • Unstable RF amplifier operation;
  • RF coupling into the oscilloscope;
  • Possible damage to the scope input or probe;
  • Misleading waveforms caused by radiated RF rather than real output measurement.

Even if the oscilloscope bandwidth is high enough, a proper RF measurement normally requires:

50 Ω terminated input
Coaxial cable connection
Suitable attenuator
Controlled RF power level

Without a spectrum analyzer, RF power meter, 50 Ω oscilloscope input, or calibrated RF attenuator, the safest practical method is to use a simple detector circuit.

The detector converts the 200 MHz RF signal into a DC or low-frequency envelope signal that can be measured safely by a normal multimeter or oscilloscope.


8. Principle of a Simple RF Detector

The purpose of a simple RF detector is not to accurately measure the exact RF output power. Its purpose is to determine whether RF output exists and whether the RF output follows the AM IN control signal.

The detector is used to answer the following questions:

Is RF output present?
Does RF output decrease when AM IN is low?
Does RF output increase when AM IN is high?
Does RF output follow square-wave modulation?

A practical detector usually includes:

Coupling capacitor
Schottky diode
Load resistor
Filter capacitor

A typical circuit is:

RF input
↓
100 pF to 1 nF coupling capacitor
↓
Schottky diode
↓
Detector output node
↓
10 kΩ resistor to ground
↓
10 nF to 100 nF capacitor to ground

Coupling capacitor

The coupling capacitor blocks DC and passes RF energy into the detector circuit.

A practical range is:

100 pF to 1 nF

This range is generally suitable for RF around 200 MHz.

Schottky diode

The diode is the main RF detection component.

Recommended types include:

1N5711
BAT54
HSMS-2850
HSMS-2820

Schottky diodes are preferred because they have lower forward voltage and faster switching behavior than ordinary rectifier diodes.

A standard diode such as 1N4007 is not suitable for this application.

A 1N4148 may sometimes detect RF under strong-signal conditions, but it is usually less suitable than a proper Schottky diode for low-power RF detection around 200 MHz.

Load resistor

A 10 kΩ resistor provides a discharge path and establishes the detector load condition.

Filter capacitor

A capacitor in the range of 10 nF to 100 nF removes much of the RF carrier and produces a smoother DC or low-frequency envelope output.


9. Practical Detector Wiring Method

The recommended method is to use an SMA T-adapter or RF tee.

The RF output connection should be:

RF OUTPUT
↓
SMA T-adapter
├── Branch 1: 50 Ω or temporary 75 Ω RF load
└── Branch 2: simple RF detector input

The important principle is:

The RF dummy load must remain connected.
The detector is only a parallel sampling branch.
The detector must not replace the RF load.

The detector wiring is:

RF center pin
↓
Coupling capacitor
↓
Schottky diode anode
↓
Schottky diode cathode
↓
Detector output node

At the detector output node, connect:

10 kΩ resistor to RF ground
10 nF to 100 nF capacitor to RF ground

Measurement instruments should connect as follows:

Multimeter red lead → detector output node
Multimeter black lead → RF ground

Oscilloscope probe tip → detector output node
Oscilloscope ground clip → RF ground

RF ground is generally:

SMA outer shell
RF driver metal chassis
24 V supply negative terminal
Function generator ground
Oscilloscope ground

All test equipment should share a common reference ground.


10. Correct Function Generator Settings for AM IN

One of the most common errors in this type of test is misunderstanding the function generator amplitude setting.

For example, many function generators display:

Amplitude: 5 V
Offset: 0 V

But this may actually mean:

5 Vpp
Meaning the waveform swings from -2.5 V to +2.5 V

That output is not suitable for AM IN if the input is designed for 0 V to +5 V logic.

The intended AM IN test waveform should be:

Low level: 0 V
High level: +5 V

If the generator is configured in Vpp mode, the correct setting is normally:

Amplitude: 5 Vpp
Offset: +2.5 V

This creates:

0 V to +5 V

Before connecting the function generator to AM IN, the generator output should first be checked directly with the oscilloscope.

Use:

DC coupling
Appropriate voltage scale
Confirm minimum voltage is near 0 V
Confirm maximum voltage is near +5 V
Confirm there is no negative voltage excursion

Only after confirming the waveform should the function generator be connected to AM IN.


11. Step-by-Step AM IN Functional Verification Procedure

Step 1: Verify DC supply polarity

Confirm the RF driver supply connection:

Vcc+ → +24 VDC
Vcc- → 0 V / GND

Do not apply 24 V to AM IN.

Because the internal RF power amplifier may have significant quiescent current, the current limit should not be set too low.

A practical initial setting is:

24 VDC
Current limit: approximately 0.8 A

Observe whether the driver immediately enters current limit.

Step 2: Connect the RF load

RF OUTPUT must be connected to:

Preferred: 50 Ω dummy load, rated at 5 W or higher
Temporary: 75 Ω resistor load, rated at 5 W or higher

The load must be connected:

RF center pin ↔ RF shell / RF ground

Step 3: AM IN low-level test

Connect AM IN center pin to 0 V.

Observe:

Detector output should be low.
Supply current should remain stable.
RF amplifier temperature should remain controlled.

Step 4: AM IN high-level test

Apply +5 V to the AM IN center pin.

Observe:

Detector output should rise significantly.
Supply current may change slightly.
RF amplifier temperature may increase moderately.

The exact detector voltage is not the critical measurement. The key is a clear, repeatable difference between AM IN low and AM IN high.

For example:

AM IN = 0 V
Detector output = 0.05 V

AM IN = +5 V
Detector output = 1.2 V

AM IN returned to 0 V
Detector output returns near 0.05 V

This indicates that:

The AM IN input stage is working.
The RF enable chain is responding.
The RF power path is being controlled.
RF output activity changes with the command signal.

Step 5: Square-wave modulation test

Set the function generator to:

Waveform: square wave
Frequency: 1 kHz
Amplitude: 5 Vpp
Offset: +2.5 V
Duty cycle: 50%

Connect the oscilloscope to the detector output node.

Under normal conditions, the detector output should change at the same frequency as the function generator.

The waveform may not look like a perfect square wave because the detector circuit includes an RC filter. Rounded edges and charge/discharge slopes are normal.

A good result is:

Input = 1 kHz
Detector output switches at approximately 1 kHz

Input = 10 kHz
Detector output still follows

Input = 100 kHz
Detector output still shows synchronized modulation

If the oscilloscope displays an unrelated value such as 13 Hz or 20 Hz while the function generator is set to another frequency, the result is not valid. This may indicate incorrect triggering, poor grounding, RF pickup, incorrect probe location, or a detector wiring problem.


12. Why Random Oscilloscope Waveforms Do Not Prove a Successful Repair

During RF testing, it is common to place an oscilloscope probe near the RF output or detector circuit and observe noisy, high-frequency, irregular waveforms.

Such waveforms may come from:

  • RF radiation from the output cable;
  • RF leakage from the amplifier module;
  • Ground-loop noise;
  • Probe ground lead acting as an antenna;
  • Reflections caused by a 75 Ω temporary load;
  • Improper detector wiring;
  • Incorrect scope trigger configuration;
  • Incorrect probe placement;
  • Function generator and RF driver not sharing common ground;
  • RF amplifier instability;
  • Switching power supply noise;
  • Oscilloscope AC coupling or unsuitable timebase settings.

Therefore, simply seeing “some waveform” does not prove that AM IN has been repaired.

A valid functional test requires the following relationship:

AM IN = 0 V → detector output low
AM IN = +5 V → detector output high
AM IN toggled high/low → detector output toggles correspondingly
Square-wave AM IN → detector output follows the same modulation frequency

This relationship is much more important than the exact waveform shape.


13. Common Wiring Errors and Their Consequences

Error 1: Applying 24 V directly to AM IN

Possible consequences:

Input protection resistor burns
Clamp diode fails
Logic IC input is damaged
RF enable function is lost
RF output remains permanently ON or OFF

Error 2: Leaving RF OUTPUT open-circuit

Possible consequences:

Reflected RF power increases
RF amplifier temperature rises
Output stage becomes unstable
RF amplifier damage risk increases

Error 3: Connecting a normal oscilloscope probe directly to RF OUTPUT

Possible consequences:

Severe impedance mismatch
Distorted measurement
Unstable RF operation
Possible probe or oscilloscope input damage

Error 4: Connecting the dummy load using long wires

Possible consequences:

Additional inductance
Impedance distortion
Antenna-like radiation
Unstable or misleading results

Error 5: Applying a waveform with negative voltage to AM IN

Possible consequences:

Input protection may be damaged again
Logic input may operate incorrectly
RF enable may become unstable

Error 6: Failing to establish common ground

Possible consequences:

AM IN reference level becomes undefined
Oscilloscope waveform becomes unstable
Control signal may not be recognized
RF noise and interference increase

14. Practical Final Acceptance Criteria

Without a spectrum analyzer or RF power meter, it is not possible to fully verify exact output frequency, absolute RF power, harmonic content, spurious emission, and calibrated modulation depth.

However, a technician can still perform a reliable functional acceptance test.

The following points should be confirmed:

1. The driver receives correct 24 VDC supply.
2. There is no reverse polarity or abnormal current limiting.
3. The RF power module temperature rise is controlled.
4. RF OUTPUT is connected to a proper 50 Ω load, or temporary 75 Ω load for short tests.
5. AM IN at 0 V produces low detector output.
6. AM IN at +5 V produces clearly higher detector output.
7. Repeated AM IN high/low switching produces repeatable detector response.
8. A 1 kHz square-wave AM IN signal produces a corresponding detector waveform.
9. Higher modulation frequencies such as 10 kHz and 100 kHz can still be followed.
10. The unit remains stable during several minutes of operation.
11. No abnormal current surge, overheating, oscillation, or random RF dropout occurs.

If these conditions are met, the technician can reasonably conclude:

The AM IN repair is functionally successful.
The input control stage is working.
The RF switching or enable path is responding.
The RF output path is active.
The driver can proceed to final verification with proper RF instruments.

However, final customer delivery should ideally include testing with:

A calibrated 50 Ω RF dummy load
An RF power meter
A spectrum analyzer
A directional coupler

A simple detector circuit proves that RF output exists and responds to AM IN control. It does not guarantee:

Exact output frequency is correct
Output power is exactly 2.5 W
Harmonics are within specification
Spurious output is within specification
RF matching performance is fully compliant

15. Conclusion

RF drivers used in AOM and optical systems may appear simple externally, with only a DC supply input, an AM IN control port, and an RF OUTPUT connector. Internally, however, they contain high-speed logic, RF switching, oscillator circuits, power amplifiers, impedance-matching networks, and thermal management structures.

When AM IN is incorrectly connected to 24 VDC, the damage may extend beyond a visible resistor or protection diode. A successful repair must confirm that the logic input, RF-enable chain, and RF output response all function correctly.

The correct verification method is not merely “the unit powers on” or “the oscilloscope shows some waveform.” The correct logic is:

Correct DC supply
→ Proper RF termination
→ Correct AM IN voltage level
→ Proper RF detector connection
→ Low-level and high-level comparison
→ Square-wave synchronization test

When AM IN at 0 V produces a low detector reading, AM IN at +5 V produces a substantially higher detector reading, and a square-wave input produces synchronized detector switching, the repair can be considered functionally successful.

For RF equipment, correct load matching, short wiring, common grounding, thermal control, and suitable measurement methods are as important as component-level repair. Avoiding future 24 V misconnection, avoiding open-circuit RF output, and avoiding direct probing of high-frequency RF output will significantly improve reliability and prevent repeat failure.

Posted on

Oxygen Analyzer “Slope Out of Range” Alarm During Calibration: Causes, Diagnostic Logic, and Field Troubleshooting Guide

Introduction

Online oxygen analyzers are widely used in pharmaceutical water systems, chemical processes, power plants, fermentation systems, inert gas protection, combustion control, metallurgical processes, environmental monitoring, and industrial gas production. In many of these applications, dissolved oxygen or gaseous oxygen concentration is a critical process variable. Incorrect oxygen measurement can lead to poor product quality, unsafe operating conditions, increased corrosion risk, excessive energy consumption, unstable combustion, or unreliable process control.

Electrochemical oxygen sensors remain common because they are relatively economical, sensitive, and suitable for continuous online measurement. However, these sensors require periodic calibration and maintenance. One of the most common calibration-related alarms is:

Slope Out of Range

On some Mettler Toledo M400 oxygen analyzer systems, the alarm may appear together with an abnormal slope value, such as:

O2 slope -2000 mV

This condition often occurs after an air calibration attempt. The analyzer may display an oxygen value close to zero, fail to complete calibration, or continue operating with an alarm active.

This article explains the technical meaning of the slope alarm, the electrochemical principle behind the measurement, the likely causes, the correct calibration conditions, and a practical field troubleshooting procedure.


Industrial technician performing air calibration on an online oxygen analyzer showing an O2 slope out of range alarm.

1. What Does “Slope Out of Range” Mean?

The slope value represents the sensitivity of the oxygen sensor.

During calibration, the analyzer compares the sensor signal at a known oxygen condition with the expected oxygen value. For example, during air calibration, the sensor is exposed to atmospheric air containing approximately 20.9% oxygen. The analyzer measures the sensor response and calculates whether the sensor sensitivity is still within the acceptable range.

If the calculated sensor sensitivity is too high, too low, unstable, negative, or otherwise outside the configured acceptable limits, the analyzer generates a:

Slope Out of Range Alarm

In practical terms, this means:

The analyzer cannot establish a valid relationship between the actual oxygen concentration and the electrical signal generated by the sensor.

The alarm is therefore not simply a display issue. It indicates that either the sensor, calibration condition, signal connection, or stored calibration data is abnormal.


2. The Technical Meaning of Sensor Slope

An oxygen analyzer does not directly detect ppm or percentage oxygen values. The sensor produces an electrical signal, usually a small current or voltage. The analyzer converts that electrical signal into an oxygen concentration using calibration parameters.

A simplified measurement relationship can be written as:

[
O_2 = k \times S + b
]

Where:

  • (O_2) = oxygen concentration
  • (S) = sensor electrical signal
  • (k) = slope or sensitivity factor
  • (b) = offset or zero-point compensation

The slope parameter determines how much the measured oxygen value changes when the sensor signal changes.

A healthy sensor should produce a stable and repeatable response under standard calibration conditions. If the sensor is aged, contaminated, damaged, dry, electrically unstable, or incorrectly calibrated, the slope value may become invalid.

An extreme slope value such as -2000 mV generally indicates that the analyzer has detected an abnormal sensor response or has failed to calculate a valid calibration factor.


3. Basic Operating Principle of Electrochemical Oxygen Sensors

Many industrial oxygen analyzers use electrochemical sensor technology. Depending on the design, the sensor may be a Clark-type polarographic sensor, galvanic oxygen sensor, or similar electrochemical system.

A typical electrochemical oxygen sensor contains:

  • Cathode
  • Anode
  • Electrolyte
  • Oxygen-permeable membrane
  • Electrical connection system
  • Temperature measurement element in some models

Oxygen molecules diffuse through the membrane and enter the electrolyte. A controlled electrochemical reaction occurs at the electrode surface. This reaction generates a signal proportional to the oxygen partial pressure or dissolved oxygen concentration.

A simplified oxygen reduction reaction is:

[
O_2 + 4e^- + 2H_2O \rightarrow 4OH^-
]

The generated current is measured by the analyzer. The analyzer then applies the calibration slope and offset values to calculate the oxygen concentration.

Because the membrane, electrolyte, electrodes, and internal chemistry all affect sensor response, the sensor is considered a consumable component. It cannot maintain perfect sensitivity indefinitely.


4. Why the Membrane Must Remain Installed During Calibration

A common misunderstanding is that the membrane should be removed during calibration. This is incorrect.

For electrochemical oxygen sensors, the membrane is part of the sensing system. It controls oxygen diffusion into the electrolyte and directly affects the sensor response. Removing the membrane changes the diffusion characteristics and exposes the internal electrode system to the environment.

Therefore:

  • The membrane must remain installed during normal calibration.
  • The membrane must be intact and properly fitted.
  • The membrane must not be torn, loose, dry, wrinkled, contaminated, or leaking.
  • The electrolyte condition must be suitable for normal sensor operation.

Calibration should always be performed with the complete sensor assembly in its normal measuring condition.

Removing the membrane during calibration can cause unstable readings, unrealistic sensitivity values, electrolyte contamination, and invalid calibration results.


Oxygen probe maintenance and slope alarm diagnosis, showing membrane inspection, electrolyte service, connector checks, and recalibration tools.

5. Main Causes of Slope Out of Range Alarms

The causes can generally be divided into four groups:

  1. Sensor-related faults
  2. Calibration condition problems
  3. Electrical connection or signal-chain problems
  4. Analyzer configuration or stored-data problems

Each group should be checked systematically.


6. Sensor-Related Causes

6.1 Sensor Aging

Sensor aging is the most common reason for slope alarms.

Over time, the electrochemical reaction becomes less efficient. The electrode surface may deteriorate, the electrolyte may lose performance, and the membrane permeability may change. The sensor output gradually becomes weaker or less stable.

Typical signs of sensor aging include:

  • Slow response time
  • Calibration takes much longer than normal
  • Repeated calibration failures
  • Slope value gradually decreasing over time
  • Unstable readings in air
  • Oxygen value remains near zero or fluctuates abnormally
  • The analyzer cannot accept a new calibration

When a sensor reaches the end of its useful life, calibration cannot restore normal performance. The sensor must be serviced or replaced.


6.2 Electrolyte Depletion or Contamination

The electrolyte is essential for the internal electrochemical reaction.

Possible electrolyte-related problems include:

  • Electrolyte evaporation
  • Electrolyte leakage
  • Long-term storage without proper maintenance
  • Contamination by process media
  • Incorrect electrolyte type
  • Air bubbles trapped inside the sensor
  • Incorrect refill procedure

If the electrolyte has deteriorated, the electrical response of the sensor may become weak, noisy, delayed, or non-linear. This can result in an unacceptable slope value during calibration.

For sensors with replaceable electrolyte, the electrolyte should be replaced according to the manufacturer’s maintenance procedure. For sealed sensors, the complete sensor may need replacement.


6.3 Damaged or Contaminated Membrane

The membrane controls how oxygen enters the sensor. Even minor membrane damage can cause major calibration problems.

Common membrane issues include:

  • Puncture or tear
  • Scratches
  • Wrinkles
  • Improper tension
  • Chemical attack
  • Oil contamination
  • Protein or biological fouling
  • Mineral deposits
  • Dry or brittle membrane
  • Membrane cap not tightened correctly

A damaged membrane may allow oxygen to diffuse too quickly, too slowly, or inconsistently. This creates unstable sensor output and can produce a slope alarm.

A contaminated membrane can also reduce oxygen diffusion. The analyzer may then interpret the weak response as sensor degradation.


6.4 Electrode Contamination or Chemical Poisoning

Certain process environments can poison or contaminate the electrode system. Sulfur-containing gases, aggressive chemicals, oil vapor, solvents, chlorine compounds, or biological contamination may affect sensor performance.

Possible symptoms include:

  • Sudden slope reduction
  • Very slow response
  • Failure after exposure to a specific process gas
  • Temporary recovery after cleaning, followed by repeated failure
  • Calibration success in clean air but unstable measurement in process conditions

In such cases, the process medium, sensor installation location, sample conditioning system, and maintenance interval should all be reviewed.


6.5 Sensor Dry-Out During Storage or Shutdown

Some oxygen sensors require proper storage conditions. If a sensor is stored dry or left out of service for a long period, the electrolyte system may become unstable.

Possible results include:

  • Delayed sensor polarization
  • Low sensitivity
  • High baseline drift
  • Failed calibration
  • Slope out of range alarm

A sensor that has been stored incorrectly may require reconditioning, electrolyte replacement, membrane replacement, or complete replacement depending on the sensor design.


7. Calibration Condition Problems

Not every slope alarm means the sensor is defective. Incorrect calibration conditions can also produce an invalid slope value.

7.1 Unstable Air Flow

Air calibration requires stable exposure to atmospheric oxygen.

Common field mistakes include:

  • Blowing air directly onto the sensor by mouth
  • Using an unstable compressed-air source
  • Holding the sensor in moving air
  • Using an air calibration hood with leaks
  • Rapidly moving the sensor during calibration
  • Using a temporary enclosure with fluctuating humidity

A fast or irregular air stream can create unstable oxygen diffusion across the membrane. The sensor signal may fluctuate and the analyzer may reject the calibration.

The best approach is to use a proper calibration cap, calibration chamber, or stable reference gas arrangement recommended by the sensor manufacturer.


7.2 Insufficient Stabilization Time

The sensor must reach a stable signal before calibration is accepted.

If calibration is confirmed too early, the analyzer may calculate the slope from an unstable signal. This can produce false calibration failure or an abnormal slope.

The stabilization time depends on:

  • Sensor type
  • Previous oxygen level
  • Temperature
  • Membrane condition
  • Process pressure
  • Sensor age
  • Electrolyte condition
  • Air flow condition

A sensor recently removed from a low-oxygen process may need several minutes or longer to stabilize in air.


7.3 Incorrect Temperature Conditions

Oxygen sensor response is temperature-dependent. Most analyzers include temperature compensation, but calibration should still be performed under stable temperature conditions.

Problems may occur when:

  • The sensor temperature is changing rapidly
  • The sensor is removed from a hot process and immediately calibrated in cool air
  • The temperature element is faulty
  • The sensor is exposed to direct sunlight or heater radiation
  • The calibration gas temperature differs significantly from the process condition

A stable ambient temperature is preferred. For general field calibration, a stable environment around 20–25°C is often suitable, but the correct procedure should follow the sensor manufacturer’s requirements.


7.4 Incorrect Pressure Compensation

Oxygen partial pressure depends on atmospheric pressure. For gas-phase oxygen measurement, pressure compensation may significantly influence calibration accuracy.

Potential issues include:

  • Incorrect barometric pressure setting
  • Calibration performed under vacuum or elevated pressure
  • Instrument pressure compensation disabled
  • Incorrect process pressure input
  • Blocked pressure sensor line in sample systems

If pressure data are wrong, the analyzer may calculate an incorrect expected oxygen value and reject the calibration.


7.5 Moisture and Humidity Effects

Air contains water vapor, and humidity can affect oxygen partial pressure. In some applications, calibration gas moisture must be controlled.

Potential problems include:

  • Condensation on the membrane
  • High humidity causing slow stabilization
  • Water droplets on the sensor
  • Wet calibration cap
  • Dry gas calibration used for a wet process without compensation

The membrane surface should be clean and free from liquid water droplets unless the calibration procedure specifically requires wet conditions.


8. Electrical Connection and Signal-Chain Problems

If the sensor itself appears physically normal, the next step is to inspect the electrical signal path.

8.1 Loose or Oxidized Connector

Sensor connectors may become oxidized, loose, contaminated, or damaged due to humidity, vibration, chemicals, or repeated plugging and unplugging.

Possible symptoms include:

  • Intermittent readings
  • Sudden jumps in oxygen value
  • Calibration starts but fails randomly
  • Slope value changes dramatically between attempts
  • Analyzer reports sensor communication or diagnostic warnings

The connector should be inspected for:

  • Corrosion
  • Moisture
  • Bent pins
  • Loose locking ring
  • Damaged sealing gasket
  • Oil or chemical contamination

Always power down or follow the manufacturer’s connection procedure before disconnecting the sensor.


8.2 Damaged Cable or Shielding

A damaged sensor cable may introduce noise or cause intermittent open-circuit conditions.

Potential cable problems include:

  • Broken conductor
  • Crushed cable
  • Rodent damage
  • Water ingress
  • Damaged shield
  • Improper grounding
  • Cable routed beside high-power inverter output cables
  • Poor terminal connection

In industrial environments, oxygen sensor signals are often very small. Electromagnetic interference from variable frequency drives, contactors, heaters, welding equipment, or unshielded power cables may disturb the measurement.

The sensor cable should be routed away from high-voltage and high-current wiring. Shielding and grounding should follow the manufacturer’s wiring recommendations.


8.3 Analyzer Input Circuit Problems

Although less common than sensor failure, the analyzer input stage can also be defective.

Possible causes include:

  • Internal analog input failure
  • Moisture ingress
  • Power supply instability
  • Damaged sensor interface board
  • Incorrect channel configuration
  • Firmware or hardware fault

A useful troubleshooting method is to connect a known-good sensor to the analyzer. If the known-good sensor calibrates normally, the original sensor is likely defective. If the known-good sensor also fails, the analyzer or wiring system should be investigated.


9. Analyzer Configuration and Calibration Data Problems

9.1 Incorrect Sensor Type Selection

The analyzer must be configured for the correct sensor type and measurement range.

Possible configuration errors include:

  • Wrong sensor technology selected
  • Incorrect oxygen range
  • Wrong calibration mode
  • Wrong units
  • Incorrect membrane or sensor parameter settings
  • Incorrect temperature compensation setting
  • Wrong process pressure configuration

If the analyzer configuration does not match the installed sensor, the slope calculation may be invalid.


9.2 Stored Calibration Data Corruption

In some cases, previous failed calibrations or incorrect parameter changes may leave invalid calibration data in memory.

Symptoms may include:

  • Alarm remains active after a seemingly successful calibration
  • Analyzer displays unrealistic slope values
  • Calibration acceptance behavior is inconsistent
  • Sensor value remains fixed after calibration

The corrective action may include:

  • Resetting calibration data
  • Restoring sensor calibration defaults
  • Clearing invalid calibration history
  • Reconfiguring the sensor channel
  • Performing a complete zero and span calibration

The exact menu path depends on the analyzer version and sensor configuration.


9.3 Slope Acceptance Limits Set Too Narrow

Some systems allow the acceptable slope range to be configured. If the limits are set too narrow, a sensor that is still usable may be rejected.

However, slope limits should not be widened simply to remove the alarm. Doing so may hide a genuine sensor degradation issue and create inaccurate oxygen measurement.

Any change to acceptance limits should be based on:

  • Manufacturer specifications
  • Process quality requirements
  • Sensor history
  • Validation procedures
  • Maintenance documentation

10. Practical Field Troubleshooting Procedure

The following sequence is suitable for a typical electrochemical oxygen analyzer showing a slope out of range alarm after air calibration.

Step 1: Confirm the Alarm Information

Record the following information before making changes:

  • Analyzer model
  • Sensor model
  • Current oxygen reading
  • Temperature reading
  • Slope value
  • Calibration date
  • Previous successful calibration date
  • Process conditions
  • Sensor installation location
  • Sensor age
  • Membrane or electrolyte replacement history

A slope value such as -2000 mV should be treated as a significant abnormal condition, not as a minor calibration drift.


Step 2: Inspect the Sensor Physically

Check the sensor for:

  • Membrane damage
  • Membrane contamination
  • Loose membrane cap
  • Electrolyte leakage
  • Dry sensor condition
  • Cracks in the sensor body
  • Moisture in electrical connector
  • Corrosion at connector pins
  • Damage caused by process chemicals

If the membrane is damaged or the electrolyte is contaminated, the sensor should be serviced before attempting another calibration.


Step 3: Confirm That the Membrane Is Installed

The membrane must remain installed during calibration.

Do not remove the membrane for air calibration.

The sensor should be calibrated in its normal operating configuration. If the membrane has been removed, replaced, or disturbed, the sensor may require reconditioning time before calibration.


Step 4: Allow the Sensor to Stabilize

Place the sensor in a stable calibration environment.

For air calibration:

  • Use clean ambient air or approved calibration gas.
  • Avoid blowing directly on the sensor.
  • Avoid unstable compressed-air flow.
  • Keep the sensor temperature stable.
  • Allow enough time for the reading to stabilize.
  • Do not confirm calibration until the analyzer indicates stability.

If the analyzer provides a stability indicator, wait until it meets the acceptance condition.


Step 5: Perform Calibration Again

Perform the correct calibration sequence according to the sensor type:

  • Air calibration only, if applicable
  • Zero calibration followed by air/span calibration
  • Calibration with certified gas, if required by the process
  • Calibration under controlled pressure and humidity conditions, if applicable

Do not repeatedly force calibration acceptance if the analyzer rejects the result. Repeated failed calibrations may overwrite useful diagnostic information.


Step 6: Check Electrical Connections

Inspect and test:

  • Sensor plug
  • Cable condition
  • Connector locking
  • Shielding
  • Grounding
  • Junction boxes
  • Terminal blocks
  • Cable routing near inverter or motor cables

Re-seat the connector and ensure it is fully locked. If possible, test the sensor with another compatible cable or analyzer input channel.


Step 7: Reset Invalid Calibration Data

If the sensor, membrane, electrolyte, calibration environment, and wiring all appear normal, reset the stored calibration data according to the analyzer service procedure.

Possible actions may include:

  • Clear calibration data
  • Restore calibration defaults
  • Reset sensor calibration
  • Delete failed calibration history
  • Reconfigure the measurement channel

After the reset, repeat the complete calibration procedure under stable conditions.


Step 8: Test with a Known-Good Sensor

This is one of the most effective fault-isolation methods.

Connect a known-good compatible sensor to the same analyzer and cable.

Results can be interpreted as follows:

Test ResultLikely Cause
Known-good sensor calibrates normallyOriginal sensor is defective or requires service
Known-good sensor also failsAnalyzer, cable, wiring, configuration, or calibration conditions are likely abnormal
Both sensors show unstable readingsPossible electrical noise, grounding, cable damage, or environmental instability
Original sensor works on another analyzerOriginal analyzer channel may be defective

11. Can the Alarm Be Cleared Manually?

In most systems, a slope alarm should not be treated as a simple message that can be manually erased.

The alarm is normally cleared only after the analyzer recognizes a valid sensor condition. This usually requires one of the following:

  • Successful calibration
  • Corrected sensor condition
  • Repaired cable or connector
  • Replacement of membrane or electrolyte
  • Replacement of the sensor
  • Reset and successful recalibration
  • Correct analyzer configuration

Simply acknowledging or muting the alarm may silence the message temporarily, but it will not restore measurement accuracy.

The correct objective is not only to clear the alarm. The objective is to restore a valid and traceable oxygen measurement.


12. When Should the Sensor Be Replaced?

Sensor replacement should be considered when one or more of the following conditions are present:

  • Calibration repeatedly fails under controlled conditions
  • Slope remains outside the acceptable range after membrane and electrolyte service
  • Signal remains unstable in clean air
  • Sensor response is extremely slow
  • Oxygen reading remains near zero in air
  • Membrane and electrolyte condition are normal but slope remains abnormal
  • Sensor has exceeded its expected service life
  • Known-good sensor works normally on the same analyzer and cable
  • The sensor has been exposed to damaging chemicals or extreme temperatures

In many practical cases, a persistent slope out of range alarm is the final indication that the electrochemical sensor has reached the end of its usable life.


13. Preventive Maintenance Recommendations

To reduce the occurrence of slope-related calibration failures, a preventive maintenance program should include the following items.

13.1 Routine Calibration

Perform calibration at a defined interval based on process criticality, sensor type, and regulatory requirements.

More frequent calibration may be needed in:

  • High-temperature applications
  • Dirty process media
  • Chemical vapor environments
  • Hygienic process systems
  • Continuous critical control loops
  • High humidity or condensate-prone locations

13.2 Membrane Inspection and Replacement

Inspect the membrane regularly for:

  • Deposits
  • Damage
  • Loss of tension
  • Cloudiness
  • Chemical attack
  • Leakage

Replace the membrane according to the maintenance schedule or whenever physical damage is found.


13.3 Electrolyte Maintenance

For refillable electrochemical sensors:

  • Use only approved electrolyte.
  • Avoid introducing air bubbles.
  • Keep the sensor clean during service.
  • Follow the specified filling volume.
  • Allow adequate stabilization time after electrolyte replacement.

13.4 Cable and Connector Maintenance

Keep connectors dry and clean. Use proper strain relief. Inspect cable routing and avoid running sensor cables in parallel with inverter output cables or high-power conductors.


13.5 Maintain Calibration Records

Calibration history is valuable for predictive maintenance.

Record:

  • Date and time
  • Slope value
  • Offset value
  • Sensor temperature
  • Calibration gas or air condition
  • Sensor maintenance performed
  • Membrane replacement date
  • Electrolyte replacement date
  • Process condition at the time of calibration

A gradual decline in slope can often predict sensor replacement before complete failure occurs.


14. Conclusion

A “Slope Out of Range” alarm on an electrochemical oxygen analyzer is a diagnostic warning that the analyzer cannot confirm valid sensor sensitivity during calibration.

The alarm may result from:

  • Sensor aging
  • Membrane damage
  • Electrolyte depletion or contamination
  • Electrode degradation
  • Incorrect calibration conditions
  • Insufficient stabilization time
  • Temperature or pressure compensation errors
  • Cable or connector problems
  • Electrical noise
  • Incorrect analyzer configuration
  • Corrupted calibration data

In practical field service, the most common cause is sensor deterioration, especially membrane and electrolyte-related degradation. However, calibration conditions and electrical connections must be checked before replacing the sensor.

The membrane should remain installed during calibration because it is an essential part of the oxygen sensing system. Calibration must be performed with the sensor in its normal operating configuration and under stable, controlled conditions.

When a severe slope value such as -2000 mV remains after proper inspection, stable air calibration, wiring checks, and calibration reset, the sensor should be considered defective or at the end of its service life.

Posted on

Systematic Analysis of SIMCO-ION CM20-P Electrostatic High-Voltage Generator Tripping and OVERLOAD Faults

1. Equipment Background and Fault Description

The SIMCO-ION Chargemaster CM20-P is an industrial electrostatic high-voltage generator. It is commonly used in electrostatic charging, electrostatic adhesion, film processing, printing and packaging, plastic sheet handling, lamination systems, and automated production lines. Its main function is to convert a standard AC input supply into a high-voltage DC output, which is then supplied to static bars, electrodes, charging heads, or electrostatic holding devices.

According to the nameplate, the main specifications of this unit are:

ItemSpecification
BrandSIMCO-ION
ModelChargemaster CM20-P
Input Power230VAC, 50/60Hz
Input Current0.3A
Output Voltage+20kV
Output Current0.5mA
Fuse630mA, 5×20mm, Time Lag

Although the input power of this type of equipment is not high, the output voltage reaches +20kV. It is a typical low-current, high-voltage device. Such equipment is very sensitive to grounding, insulation condition, humidity, contamination, high-voltage cable condition, static bar cleanliness, and electrode-to-metal distance.

Once leakage, discharge, short circuit, or insulation breakdown occurs at the high-voltage output side, the unit may show symptoms such as OVERLOAD alarm, blown fuse, leakage breaker tripping, no output, abnormal display, or unstable operation.

In this case, the fault development was very typical:

At the beginning, the OVERLOAD red indicator on the front panel was lit. This usually means that the high-voltage output was abnormal or the load was excessive. Later, inspection found that an internal fuse had blown. After replacing the fuse, the main display powered on, and the OVERLOAD red light was no longer lit. However, a new fault appeared: the breaker tripped when the unit was powered on.

The customer also reported that when the equipment was used inside the factory, the breaker tripped as soon as the earth wire was connected. The site power system was described as three-phase four-wire.

These pieces of information indicate that the fault is not simply a blown fuse or a grounding question. It involves several possible fault directions, including high-voltage output overload, internal power circuit short circuit, leakage to ground, and improper site grounding system. The troubleshooting must be carried out systematically from four aspects: input power, protective earth, high-voltage output, and internal components.


Technician troubleshooting a SIMCO-ION Chargemaster CM20 electrostatic high-voltage generator on a repair bench, using a digital multimeter to check the internal power board, fuse area, and input circuit after an overload fault.

2. Meaning of the OVERLOAD Indicator

The OVERLOAD indicator on an electrostatic high-voltage generator is usually not a general power alarm. It is closely related to the high-voltage output condition. It normally means that the unit cannot establish the required output voltage, or the output current has exceeded the permitted range.

Common causes include:

  1. Short circuit at the high-voltage output;
  2. Internal leakage in the static bar;
  3. Damaged or aged high-voltage cable insulation;
  4. Electrode installed too close to a metal frame;
  5. Dust, oil, moisture, or contamination causing surface creepage;
  6. Internal breakdown of the high-voltage module;
  7. Abnormal high-voltage feedback detection circuit;
  8. Load exceeding the design capacity of the generator.

The CM20-P output is +20kV and 0.5mA. Although the current is very small, in a high-voltage electric field, even slight moisture, dust, oil contamination, burrs, or carbonized tracks can form a leakage path. When the generator detects abnormal output current, it lights the OVERLOAD indicator to warn of output overload or insulation failure.

Therefore, the initial OVERLOAD alarm already indicated that the equipment or its external load had a real fault. The later blown fuse was only a result of the fault progressing further. Replacing the fuse does not mean the equipment has recovered. A blown fuse usually means that the power circuit experienced overcurrent, short circuit, or an abnormal surge.


Factory electrical diagnosis of a SIMCO-ION Chargemaster CM20-P high-voltage generator connected to L, N, and PE wiring, showing earth leakage troubleshooting, a tripped leakage breaker, and grounding inspection.

3. A Blown Fuse Is Usually a Result, Not the Root Cause

When field technicians see a blown fuse, the first reaction is often to replace it. However, in industrial electronic equipment, the fuse itself is rarely the root cause. Its function is protection. If it blows, it means the downstream circuit has drawn abnormal current.

The CM20-P nameplate specifies:

630mA, 5×20mm, Time Lag

This means:

T630mA / 250V / 5×20mm slow-blow fuse

There are two important points here.

First, the fuse rating must not be increased randomly.
If the original fuse is 630mA slow-blow, it must not be replaced with a 1A, 2A, or larger fuse simply to prevent it from blowing again. It is even more dangerous to use copper wire instead of a fuse. This may keep the circuit powered temporarily, but it can cause more serious damage to components, PCB traces, transformers, high-voltage modules, or even create a fire and electric shock hazard.

Second, fast-blow and slow-blow fuses must not be used interchangeably without analysis.
When the equipment starts, there may be short-duration inrush current from filter capacitor charging, transformer magnetizing current, or high-voltage circuit startup. A slow-blow fuse is designed to tolerate this short inrush. If a fast-blow fuse is installed incorrectly, it may blow even during normal startup.

However, if the correct slow-blow fuse is installed and the breaker still trips or the fuse blows again, the downstream circuit must be checked. Repeated power-on testing is not acceptable.

In this case, after the fuse was replaced, the display could light up, proving that part of the low-voltage supply had recovered. But the subsequent breaker tripping proves that the root fault remained. Replacing the fuse merely restored the current path. The real short circuit, leakage, or high-voltage insulation fault was still present.


4. Breaker Tripping: MCB Trip or RCD/RCBO Trip?

When a customer says “the breaker trips,” the first task is to identify what type of protection device is tripping. Different protection devices indicate different fault directions.

If an ordinary MCB trips, the main concern is overcurrent or short circuit. Typical causes include L-N short circuit, shorted rectifier bridge, shorted main electrolytic capacitor, shorted power transistor, or shorted transformer primary winding.

If an RCD or RCBO trips, the main concern is earth leakage. Typical causes include leakage in the input filter, abnormal Y capacitor, high-voltage circuit breakdown to chassis, moisture or carbonization at the output socket, damaged high-voltage cable, or incorrect N/PE connection on site.

In this case, the customer’s photo showed a CHINT NXBLE-63 C63 breaker. The NXBLE-63 is a leakage-protection circuit breaker, commonly known as an RCBO. It can trip because of earth leakage, but it can also trip because of overload or short circuit. Therefore, its tripping does not automatically prove that the fault is purely earth leakage. However, it does prove that the equipment caused an abnormal condition at power-up.

The fault must be further divided into the following situations.

4.1 The Breaker Trips Immediately When the Plug Is Inserted with the Power Switch OFF

If the front power switch of the unit is OFF, but the breaker trips immediately when the power plug is inserted, the fault is usually located before the main power switch.

The key areas to check are:

  • Power cord;
  • IEC power inlet;
  • Fuse holder;
  • Input EMI filter;
  • MOV surge suppressor;
  • NTC inrush limiter;
  • Insulation between L/N/PE;
  • Damaged input wiring touching the chassis.

In this state, the main high-voltage circuit may not have started yet.

4.2 The Plug Can Be Inserted Normally, But the Breaker Trips When the Unit Is Switched ON

If the plug is inserted without tripping, but the breaker trips when the front switch is turned ON, the fault is more likely in the downstream power supply or high-voltage generation circuit.

Key areas to check include:

  • Rectifier bridge;
  • Main filter capacitor;
  • Switching transistor;
  • Driver circuit;
  • Step-up transformer;
  • Voltage multiplier circuit;
  • High-voltage output socket;
  • High-voltage feedback circuit.

4.3 It Does Not Trip Without Ground, But Trips as Soon as PE Is Connected

If the equipment seems to power on when the earth wire is not connected, but trips immediately when protective earth is connected, there are usually two possibilities.

The first possibility is that the equipment itself has leakage to chassis or PE.
The second possibility is that the site grounding system is incorrect, with neutral and protective earth mixed, or the so-called “earth wire” is not a real PE conductor.

This kind of symptom is common in high-voltage electrostatic equipment because the high-voltage output, input EMI filter, and metal chassis have complex insulation relationships. Once an internal leakage path exists, connecting PE allows leakage current to return through the grounding system. The RCBO detects imbalance between line and neutral current and trips.


5. Grounding Risk in a Three-Phase Four-Wire Factory Supply

The customer mentioned that the site supply is “three-phase four-wire.” This is a critical detail.

In industrial sites, two common systems are three-phase four-wire and three-phase five-wire.

A three-phase four-wire system usually consists of:

L1, L2, L3, N

A three-phase five-wire system consists of:

L1, L2, L3, N, PE

The CM20-P is a 230VAC single-phase input device. Its correct wiring is:

L + N + PE

Here, PE is protective earth. It must not be replaced by N. In many three-phase four-wire sites, there may be no independent PE conductor. Some users may incorrectly use neutral as earth, or connect the equipment chassis to steel structures, water pipes, cable trays, or machine frames. These practices can cause RCBO tripping and also create electric shock hazards.

An RCBO works by comparing the current flowing through the line conductor and the current returning through the neutral conductor. Under normal conditions, the current going out through L should return through N. If part of the current returns through PE, chassis, steel structure, or another path, the RCBO detects an imbalance and trips.

Therefore, if a unit trips as soon as the earth wire is connected in a three-phase four-wire site, the following possibilities must be considered:

  1. There is no real PE at the site;
  2. Neutral is being used incorrectly as protective earth;
  3. N and PE are mixed on the load side of the leakage breaker;
  4. The equipment PE is connected to the wrong neutral bar;
  5. The factory steel structure has a different potential from the power supply earth;
  6. Other equipment on the same grounding network has leakage;
  7. The CM20-P itself has internal leakage to chassis, and grounding exposes the fault.

The correct solution is to have a qualified electrician verify the grounding system. It is not acceptable to randomly select a wire and call it “earth.” For a +20kV electrostatic generator, protective earth is not optional. It is a necessary safety condition.


6. Correct On-Site Verification Method

When a unit shows breaker tripping, earth-wire tripping, previous fuse blowing, and OVERLOAD history, it should not be tested directly with the external static bar connected. The verification must be performed in stages.

Stage 1: Verify Power Supply and Grounding

Use a multimeter to measure the supply point:

Measuring PointNormal Result
L-NApproximately 220V / 230V
L-PEApproximately 220V / 230V
N-PEClose to 0V, usually within a few volts

If L-N is normal but L-PE is abnormal, PE is unreliable.
If N-PE has a significant voltage, the site neutral-earth system may be faulty.
If the site has only three-phase four-wire without independent PE, N must not be used directly as protective earth.

Stage 2: Disconnect All High-Voltage Loads

Disconnect the external static bar, high-voltage cable, electrode, and charging head. Only the main generator should remain connected to the input power.

Then test:

  • Does it trip when the plug is inserted with the power switch OFF?
  • Does it trip only when the switch is turned ON?
  • Does it trip only when PE is connected?
  • Does it trip without external high-voltage cables?

If it no longer trips after the external load is disconnected, the fault is likely in the static bar, high-voltage cable, or installation environment.

If it still trips with no external load, the fault is inside the generator.

Stage 3: Separate Input-Side Faults from High-Voltage-Side Faults

If it trips with the switch OFF, check the input side.
If it trips only after switching ON, check the main power and high-voltage generation stage.
If it trips only when PE is connected, check insulation to PE, input filter leakage, and high-voltage module leakage to chassis.
If it trips only after connecting the static bar, check the external high-voltage cable and static bar.

This staged method is much more reliable than blind component replacement.


7. Key Internal Circuit Areas to Inspect

The internal structure of the CM20-P generally includes input protection, rectification and filtering, control circuit, power drive, step-up circuit, and high-voltage output stage. In this case, the following areas should be inspected carefully.

7.1 Input Fuse and Fuse Holder

Confirm that the installed fuse is:

T630mA / 250V / 5×20mm slow-blow

Check whether the fuse holder is burnt, loose, oxidized, or deformed. Poor contact in the fuse holder can cause local heating, arcing, or intermittent faults.

If the fuse blows again, stop replacing it and proceed with short-circuit testing.

7.2 Input MOV Surge Suppressor

The internal photos show a black disc-shaped component near the input area. This type of component is commonly used as an MOV or surge suppressor. It absorbs lightning surges, overvoltage spikes, and switching transients.

When an MOV fails, it may become low-resistance or fully shorted. This can cause the fuse to blow or the breaker to trip immediately at power-up.

For accurate testing, one leg should be lifted from the circuit or the component should be isolated before measuring. If the MOV measures low resistance, it is faulty.

7.3 Input EMI Filter and Y Capacitors

Industrial equipment with a metal chassis often uses an EMI filter. The filter normally includes X capacitors, Y capacitors, and common-mode inductors. Y capacitors are connected between L/N and PE. Under normal conditions, they produce a very small leakage current. If a Y capacitor ages, absorbs moisture, or breaks down, leakage to PE may increase and trip the RCBO.

When the symptom is “the breaker trips as soon as the earth wire is connected,” the EMI filter and Y capacitors must be checked carefully.

7.4 Rectifier Diodes or Rectifier Bridge

The internal board shows several diode positions such as D2, D6, and D7. If any rectifier diode breaks down short, the fuse may blow and the breaker may trip. Use the diode test mode of a multimeter to measure forward and reverse voltage drops. If both directions read nearly zero, the diode is shorted.

7.5 Main Electrolytic Capacitors

High-voltage generators usually include main filter capacitors in the power supply section. If an electrolytic capacitor is shorted, severely leaky, swollen, or leaking electrolyte, it can cause abnormal input current.

After power is disconnected and capacitors are safely discharged, measure the resistance across the capacitor terminals. It should not remain near zero ohms. If a low resistance is present, isolate the capacitor or downstream DC bus to confirm whether the capacitor or the circuit is shorted.

7.6 Power Switching Transistor

Electrostatic high-voltage generators often use a switching power supply topology to drive a high-voltage step-up transformer. If the power switching transistor fails short between D-S or C-E, it can short the DC bus and cause fuse blowing, breaker tripping, or failure to start.

The main terminals of the switching device must be checked for short circuit. The gate/base drive circuit, gate resistors, snubber components, and fast recovery diodes should also be inspected because they are often damaged together.

7.7 Step-Up Transformer and High-Voltage Module

The initial OVERLOAD alarm strongly suggests a high-voltage output-side abnormality. If the step-up transformer, voltage multiplier capacitors, high-voltage diodes, or encapsulated HV module breaks down, it may cause leakage to chassis, internal discharge, or output short circuit.

A normal multimeter may not always detect high-voltage insulation failure. Megger testing, sectional isolation, unloaded power testing, and visual inspection for discharge marks may be required.

7.8 High-Voltage Output Socket and HV Cable

The output sockets and high-voltage terminals must be inspected carefully. At +20kV, even light dust, moisture, oil contamination, or carbonized marks can form a creepage path. If the high-voltage cable insulation is damaged or routed too close to the metal chassis or frame, leakage and OVERLOAD alarms can occur.

A typical feature of this type of fault is that low-voltage resistance checks may appear normal, but the unit alarms or trips once high voltage is generated.


8. Influence of External Static Bars and Installation Environment

In an electrostatic system, the generator is only the high-voltage source. The real fault is often located in the external load. Static bars, electrodes, and high-voltage cables work under strong electric fields for long periods. They are easily affected by dust, oil, moisture, aging, mechanical stress, and improper installation.

Common external problems include:

  1. Damaged high-voltage cable jacket;
  2. Reduced insulation inside the static bar;
  3. Contaminated electrode needles;
  4. Static bar installed too close to a metal roller, frame, or guard;
  5. High ambient humidity;
  6. Oil mist or dust causing surface creepage;
  7. Carbonization inside the high-voltage plug;
  8. Breakdown at cable bending points.

Therefore, to determine whether the CM20-P generator itself is faulty, an unloaded test is mandatory. If the generator no longer trips or alarms after all external loads are disconnected, the generator may not have a serious internal short circuit. The troubleshooting focus should then move to the high-voltage cable, static bar, and installation environment.

If the generator still trips with no external load, an internal fault is confirmed.


9. Why the Unit Must Not Be Tested Without Protective Earth

The customer once tested the equipment in another room without an earth wire. This is unsafe and unsuitable for diagnosing high-voltage electrostatic equipment.

The warning label on the CM20-P clearly requires that the earthing wire be connected before operation. The reasons include:

  1. The metal chassis must be protectively earthed to prevent electric shock if internal leakage occurs;
  2. The high-voltage output system requires a stable reference potential;
  3. The EMI filter requires a PE path;
  4. High-voltage discharge energy must be safely released;
  5. Without earth, the chassis may float to an unsafe potential.

When the unit is not grounded, some leakage faults may not immediately show because the leakage current has no clear return path. This does not mean the equipment is normal. Once PE is connected, the leakage path becomes complete, and the RCBO may trip immediately. In that case, grounding has not caused the fault; it has exposed the fault.

For high-voltage electrostatic equipment, the correct interpretation is:

After the equipment is grounded, the leakage fault inside the unit or the site wiring system is detected by the protection device.


10. Recommended Troubleshooting Procedure

For this case, the following procedure is recommended.

Step 1: Confirm Fuse Specification

Confirm that the replacement fuse is:

T630mA / 250V / 5×20mm slow-blow

Do not increase the rating. Do not replace the fuse with copper wire.

Step 2: Disconnect All High-Voltage Outputs

Remove the static bar, high-voltage cable, and external electrode. Test only the main generator.

Step 3: Confirm Power Supply

Use single-phase 230VAC with:

L, N, PE

PE must be a real protective earth. It must not be replaced by neutral.

Step 4: Test in Different Power States

Insert the plug with the power switch OFF and observe whether the breaker trips.
Then turn the power switch ON and observe whether it trips.
Record exactly when the trip occurs.

Step 5: Measure Input-Side Insulation and Short Circuit

After disconnecting power and discharging capacitors, measure:

  • Resistance between L and N;
  • Resistance between L and PE;
  • Resistance between N and PE;
  • Fuse downstream side to N;
  • DC bus resistance;
  • PCB insulation to chassis.

If L-PE or N-PE reads low resistance, there is leakage or short circuit to chassis.

Step 6: Check Input Protection Components

Inspect:

  • MOV surge suppressor;
  • EMI filter;
  • X/Y capacitors;
  • NTC inrush limiter;
  • Fuse holder;
  • Power switch;
  • Input wiring.

Step 7: Check Rectifier and Power Stage

Inspect:

  • Rectifier diodes;
  • Rectifier bridge;
  • Main electrolytic capacitors;
  • Power switching transistor;
  • Snubber circuit;
  • Driver circuit;
  • Primary winding of the step-up transformer.

Step 8: Check High-Voltage Output and Insulation

Inspect:

  • High-voltage module;
  • Voltage multiplier capacitors;
  • High-voltage diodes;
  • Output sockets;
  • High-voltage cable;
  • Static bar;
  • Insulation between output and chassis.

Step 9: Clean and Dry the HV Area

If dust, oil, moisture, or discharge marks are present around the high-voltage output, clean and dry the area before retesting. Severely carbonized insulation parts must be replaced. Wiping the surface is not enough.

Step 10: Power-On Verification

After repair, test the generator without load first. Then connect the high-voltage load. Before connecting the load, confirm that the static bar and high-voltage cable have no short circuit, leakage, or insulation damage.


11. Probable Fault Conclusion

Based on all the symptoms in this case, the following conclusion is reasonable:

First, the initial OVERLOAD red light indicates a high-voltage output overload, leakage, or internal high-voltage fault.
Second, the internal fuse blowing indicates that the abnormal condition developed into an overcurrent condition on the power side.
Third, after the fuse was replaced, the display recovered, but the breaker still tripped, proving that the root fault had not been removed.
Fourth, the report that the unit trips as soon as the earth wire is connected indicates possible internal leakage to earth, while the three-phase four-wire factory supply may also have an improper PE/N grounding arrangement.
Fifth, the correct next step is to verify whether the site has a real PE conductor, disconnect all external high-voltage loads, and perform an unloaded test to determine whether the fault is inside the generator or in the external static bar system.

In order of probability, the most likely fault areas are:

  1. Leakage in the high-voltage output socket, static bar, or high-voltage cable;
  2. Insulation breakdown in the high-voltage module or step-up section;
  3. Earth leakage from the input EMI filter or Y capacitors;
  4. Damaged MOV, rectifier diode, or rectifier bridge;
  5. Shorted power transistor or main electrolytic capacitor;
  6. Improper factory grounding system, especially neutral-earth confusion in a three-phase four-wire supply.

12. Repair and Operation Precautions

Electrostatic high-voltage generators must not be repaired in the same way as ordinary low-voltage power supplies. Their input power may be small, but the output voltage is very high. Incorrect operation can cause electric shock, arcing, equipment damage, or fire.

The following precautions are essential:

  1. Do not repeatedly power the unit on after it trips.
    Repeated tripping can enlarge the damage to power components and high-voltage modules.
  2. Do not increase the fuse rating.
    A blown fuse means that the downstream circuit has an abnormal condition.
  3. Do not operate the unit without protective earth.
    Grounding is a safety requirement, not an optional connection.
  4. Do not use neutral as earth.
    Three-phase four-wire does not automatically mean that PE is available. The CM20-P requires a real protective earth.
  5. Do not test the unit directly with the static bar connected.
    First disconnect external loads and confirm the condition of the generator itself.
  6. Do not ignore high-voltage output cleanliness.
    Dust, moisture, oil, and carbonized tracks are common causes of HV leakage.
  7. Do not replace the high-voltage cable with ordinary low-voltage wire.
    A +20kV output requires a suitable HV-rated cable and connector.
  8. Do not judge the equipment only by whether the display lights up.
    A working display only proves that part of the low-voltage supply is operating. It does not prove that the high-voltage section is healthy.

13. Summary

The SIMCO-ION Chargemaster CM20-P fault involving OVERLOAD indication, blown internal fuse, breaker tripping after fuse replacement, and tripping when the earth wire is connected is a typical combined fault scenario in electrostatic high-voltage equipment. The root cause may be external high-voltage cable or static bar leakage, internal high-voltage module breakdown, input filter leakage, rectifier or power-stage short circuit, or an improper factory grounding system.

The correct approach is not to repeatedly replace the fuse, repeatedly power on the unit, or remove the earth wire. Instead, the troubleshooting should follow a clear sequence: confirm the correct fuse rating, verify the L/N/PE supply, disconnect all high-voltage loads, distinguish whether the trip occurs with switch OFF, switch ON, PE connected, or external load connected, and then inspect the input protection circuit, rectifier stage, power switching stage, high-voltage module, output socket, and site grounding system.

For a +20kV electrostatic generator, grounding, insulation, and cleanliness are the foundation of safe operation. Once OVERLOAD, fuse blowing, or RCBO tripping occurs, the equipment should be taken out of service and tested systematically. Only by separating the input power, protective earth, internal power circuit, high-voltage output stage, and external static bar system can the fault be accurately located and repaired safely.

Posted on

Diagnostic Analysis of ZEISS Sigma 300 SEM Chamber Vacuum Failure and “Waiting Penning” Status

1. Overview of the Fault Phenomenon

In daily operation of a field-emission scanning electron microscope, the vacuum system is one of the most critical subsystems. It directly determines whether the microscope can image normally, whether the high voltage can be enabled safely, and whether the electron gun can be protected from contamination. For a field-emission SEM such as the ZEISS Sigma 300, the sample chamber, column chamber, electron gun chamber, backing pump, turbo molecular pump, vacuum gauges, pneumatic valves, and vacuum control electronics are all connected through a strict interlock logic. If any one of these conditions is not satisfied, the system will prevent EHT from being switched on and will keep the column chamber valve closed to protect the electron gun and electron optical column.

In this case, the ZEISS Sigma 300 was originally operating normally. The operator performed a standard venting procedure, opened the chamber, then closed the chamber and attempted to pump down again. After this operation, the chamber vacuum could not be restored normally. The software vacuum panel showed the status “Waiting Penning”, the EHT vacuum condition was not ready, the column chamber valve remained closed, and the microscope could not return to normal operating condition.

The field feedback also indicated that after power-on, the system automatically entered the pumping sequence. The chamber door could be pulled tight by negative pressure, and no obvious air leakage sound was heard. However, the chamber vacuum could not continue into the normal high-vacuum state. In some observations, the vacuum gauge reading was missing, invalid, or remained abnormal.

From a service diagnostic point of view, this type of fault should not be simplified as “the pump is bad” or “the vacuum gauge is bad.” The SEM vacuum system works in stages and has different vacuum zones. The fact that the chamber door can be sucked tight only proves that a rough vacuum is being formed. The software status Waiting Penning means that the system is waiting for valid confirmation from the Penning high-vacuum gauge or its related measurement circuit. If the system also shows Gun Vacuum = 1000 mbar, EHT Vac Ready = No, and Column Chamber Valve = Closed, it is necessary to distinguish whether the actual vacuum has not reached the required condition, or whether the vacuum measurement circuit, valve actuation, or control logic has failed to confirm the vacuum state.

ZEISS Sigma 300 SEM workstation showing the vacuum control interface with “Waiting Penning” status, rough vacuum reading around 8 Pa, closed column valve, and EM Server log during vacuum fault diagnosis.

2. Basic Structure of the ZEISS Sigma 300 Vacuum System

To understand this fault, it is necessary to understand the general structure of the SEM vacuum system. Different configurations of the ZEISS Sigma 300 may vary in detail, but the main vacuum architecture usually includes the following sections.

2.1 Sample Chamber Vacuum Area

The sample chamber is the vacuum area most frequently operated by users. During normal sample exchange, the system vents the chamber to atmospheric pressure through the vent valve. After the chamber door is closed, the system pumps the chamber down again through the pump sequence. The chamber door seal, door locking mechanism, sample stage height, sample holder, detector ports, EDS/EBSD/BSE accessory interfaces, and chamber flanges can all affect whether the sample chamber can establish vacuum normally.

Typical sample chamber faults include slow pump-down, failure to pump down, pressure remaining at a high level, chamber door not being sucked tight, or repeated vacuum timeout. Conductive adhesive, sample powder, metal particles, fiber, glove fragments, or contamination on the O-ring and sealing surface can prevent the chamber from reaching the required vacuum level. A damaged, displaced, hardened, or locally deformed O-ring can also cause the same problem.

2.2 Backing Pump and Rough Pumping Path

A ZEISS Sigma 300 may use an Edwards nXDS dry scroll pump as the backing pump. This pump is responsible for rough pumping the sample chamber and providing backing support for the turbo molecular pump. However, a running backing pump does not automatically mean that the entire vacuum system is healthy. It is only the first stage of the vacuum chain.

If the backing pump is completely non-operational, the chamber usually cannot form noticeable negative pressure. The chamber door will not be pulled tight, and the system vacuum will remain close to atmospheric pressure. If the backing pump runs but has poor pumping speed, the pressure may decrease slowly and fail to reach the condition required for high-vacuum transition. If the backing pump itself is normal but the pumping valve does not open, the vent valve does not close, or the pipeline has a leak, the chamber will still fail to enter the next vacuum stage.

Technician inspecting the open ZEISS Sigma 300 SEM sample chamber, chamber door seal, O-ring, and sample stage during vacuum leakage and pump-down troubleshooting.

2.3 Turbo Molecular Pump and High-Vacuum Stage

After rough pumping reaches a certain pressure, the system relies on the turbo molecular pump to continue pumping the chamber into the high-vacuum range. The turbo molecular pump must start, accelerate, reach operational speed, and enter a Ready or Normal state. The high-vacuum valve and related valves must also actuate correctly before the system can proceed to high-vacuum confirmation.

If the turbo pump does not start, if the controller reports an alarm, if the rotational speed is not reached, if the backing pressure is not acceptable, or if the high-vacuum valve does not open, the chamber may stay at several Pa or tens of Pa and the software may continue to display Waiting Penning, Vacuum not ready, or a similar interlock status.

2.4 Pirani Gauge and Penning Gauge

Different types of vacuum gauges are used to cover different pressure ranges. The rough vacuum range is commonly monitored by a Pirani gauge, while the high-vacuum range is commonly monitored by a Penning gauge or cold cathode gauge.

The Pirani gauge is used in the higher pressure range and is typically responsible for determining whether the sample chamber has moved from atmosphere into rough vacuum. The Penning cold cathode gauge is used in the high-vacuum range and usually works reliably only when the pressure is low enough. If the system displays Waiting Penning, it means the vacuum control sequence is waiting for the Penning gauge to provide a valid high-vacuum condition, or waiting for it to start, ignite, stabilize, and satisfy the interlock threshold.

A Penning gauge fault does not always generate an obvious error message. In some cases, the software only remains at Waiting Penning, while the server or message log does not show a red alarm. This can happen because the control system is simply waiting for a valid confirmation signal rather than classifying the condition as a hard error.

2.5 Vacuum Valves and Pneumatic System

Many SEM vacuum valves are pneumatically driven, including vent valves, pumping valves, high-vacuum valves, and column isolation valves. Insufficient compressed air pressure, detached air tubing, a defective solenoid valve, a stuck valve body, or missing valve feedback can all cause the vacuum sequence to stop at a certain stage.

For instruments that require the chiller and compressed air system to stabilize before power-on, the cooling water, water pressure, compressed air pressure, dry air supply, and external interlock conditions must all be confirmed. Otherwise, even if the pumps themselves are functional, the valves may not actuate correctly.

Engineer checking the Edwards nXDS dry scroll backing pump, vacuum hoses, fittings, and rough pumping system connected to a ZEISS Sigma 300 scanning electron microscope.

3. Initial Judgment Based on the Failure Sequence

The most important detail in this case is that the instrument was working before the chamber was vented and opened. The failure appeared when the chamber was closed again and the operator attempted to pump down. This background strongly suggests that the problem may be related to the open-chamber and re-pump sequence.

When a vacuum fault appears immediately after opening and closing the chamber, the first suspects are usually chamber door sealing, sample stage position, sample holder interference, O-ring contamination, vent valve return, or rough pumping path problems. These are the components most likely to change after user operation.

However, later observations showed that the sample chamber door was sucked tight immediately after pumping started, and there was no obvious air leakage sound. The software showed System Vacuum = approximately 8.4e-02 mbar to 8.6e-02 mbar, equivalent to about 8.4–8.6 Pa. This means the chamber was not at atmospheric pressure and rough pumping was not completely ineffective. The backing pump and rough pumping path were at least partly functional. A major leak at the chamber door became less likely.

At this point, the diagnostic focus should shift from “whether the chamber can form negative pressure” to “why the system cannot complete high-vacuum confirmation after rough pumping.” The software status Waiting Penning indicates that the system has reached the stage where it expects confirmation from the Penning high-vacuum gauge, but the Penning gauge or its related vacuum measurement circuit is not providing a valid state.

Therefore, the fault range should be narrowed to the following possibilities:

  1. Penning / cold cathode high-vacuum gauge failure;
  2. Penning gauge cable, connector, supply, or high-voltage excitation failure;
  3. Gauge interface board or vacuum control board unable to read the Penning signal;
  4. Turbo molecular pump not started, not accelerated, or not Ready;
  5. High-vacuum valve not open or valve feedback not confirmed;
  6. Pneumatic pressure insufficient, causing valve actuation failure;
  7. Vacuum measurement power supply, communication, or common measurement circuit fault;
  8. Abnormal Gun Vacuum reading suggesting a wider measurement-channel issue.
Close-up inspection of the Penning cold cathode vacuum gauge cable and connector on a ZEISS Sigma 300 SEM during “Waiting Penning” high-vacuum measurement fault diagnosis.

4. Meaning of System Vacuum Around 8 Pa

A System Vacuum reading of around 8 Pa is an important diagnostic dividing point. Atmospheric pressure is about 101325 Pa, so 8 Pa is already far below atmosphere. This value can exclude some simple failures, but it does not prove that the high-vacuum system is normal.

4.1 Complete Rough Pumping Failure Becomes Less Likely

If the backing pump were completely inactive, or if the chamber door were not sealing at all, the System Vacuum would usually not decrease to around 8 Pa. The chamber door would also not be sucked tight quickly. Therefore, with the chamber already around 8 Pa, it is not correct to simply describe the problem as “the pump is not pumping” or “the chamber is still at atmosphere.”

4.2 Minor Leakage Still Cannot Be Fully Excluded

Although the door is sucked tight, a minor leak cannot be completely excluded. A small leak may still allow the chamber to reach several Pa, but prevent the system from reaching the lower pressure range required for high vacuum. Common leak sources include a contaminated O-ring, detector flange, chamber accessory port, vent valve leakage, or contaminated valve seal. However, if the software clearly remains at Waiting Penning and the high-vacuum gauge has no valid reading, the measurement and high-vacuum confirmation chain becomes the higher-priority suspect.

4.3 The System Is Likely Stuck at Rough-to-High-Vacuum Transition

A pressure of around 8 Pa is still within the rough-vacuum region. At this stage, the system may be preparing to start or confirm the turbo pump, high-vacuum valve, and Penning gauge. If the pressure cannot decrease further, it is necessary to determine whether the turbo pump has really accelerated, whether the high-vacuum valve has opened, and whether the Penning gauge has entered a valid operating condition.

5. Technical Meaning of “Waiting Penning”

Waiting Penning is not the same as a direct conclusion that “the Penning gauge is bad.” It is a process status. It indicates that the system is waiting for the Penning high-vacuum gauge or cold cathode gauge to satisfy a required condition. This condition may include gauge enable, high-voltage excitation, ignition, valid pressure range, stable reading, control-board signal recognition, and software interlock confirmation.

5.1 Penning Gauge Body Failure

After long operation, a Penning gauge may suffer from contamination, internal deposition, ignition difficulty, unstable discharge, reading drift, or no reading at all. Common contamination sources in SEM chambers include conductive adhesive, volatile organic samples, powder, oil vapor, water vapor, and solvent residue. These contaminants can reduce the reliability of the gauge and prevent stable discharge, so no valid high-vacuum reading is produced.

5.2 Gauge Cable or Connector Failure

A loose gauge cable, oxidized connector, damaged shielding, pulled cable, or poor contact can cause the software to lose the Penning signal. Such faults may not always produce a clear alarm. They may only appear as Waiting Penning or no gauge reading.

5.3 High-Voltage Excitation or Gauge Supply Failure

A Penning cold cathode gauge requires high-voltage excitation to operate. If the high-voltage excitation module, gauge supply, or interface output is abnormal, the gauge body may be good but still unable to produce a valid measurement signal.

5.4 Vacuum Control Board or Measurement Channel Failure

If the vacuum control board input channel is damaged, or the gauge interface module is faulty, the software may not receive the actual reading. If multiple vacuum readings are abnormal at the same time, for example if Gun Vacuum = 1000 mbar, the diagnosis should expand to the common vacuum measurement power supply, communication chain, control board, or data acquisition channel, rather than focusing only on one gauge.

6. Risk Significance of Gun Vacuum Showing 1000 mbar

In one observation, Gun Vacuum = 1000.00 mbar was displayed. This value is close to atmospheric pressure and is highly abnormal for a field-emission gun. A field-emission electron gun must be maintained at extremely high vacuum, usually far lower than the sample chamber pressure. If the gun chamber were truly at atmospheric pressure, it would be a serious fault. The EHT must not be switched on, and emission or imaging must not be attempted.

However, because an earlier observation had shown a normal high-vacuum gun value, such as 1.33e-07 Pa, the later value of 1000 mbar may also be a software default value, an unloaded reading during startup, a communication failure, a lost gun vacuum gauge signal, or an abnormal vacuum measurement system display. Regardless of the cause, as long as Gun Vacuum remains at 1000 mbar, all high-voltage operation must be prohibited.

This symptom also indicates that diagnosis should not focus only on the chamber Penning gauge. The entire vacuum measurement system needs attention. If the chamber Penning gauge has no valid reading and the gun vacuum reading is also abnormal, there may be a fault in common power supply, vacuum control electronics, communication, or multiple gauge signal channels.

7. Diagnostic Procedure and On-Site Inspection Method

7.1 Do Not Enable EHT or Force the Column Chamber Valve

When EHT Vac Ready = No, Column Chamber Valve = Closed, and the vacuum status is abnormal, the EHT must not be switched on. The column chamber valve must not be forced open through service mode. The closed column valve protects the electron gun and high-vacuum column. Forcing it open may contaminate the electron optical system.

7.2 Observe the Complete Vacuum Page

The complete software Vacuum page should be observed, not only a cropped screenshot. The following parameters should be recorded:

  • System Vacuum;
  • Gun Vacuum;
  • Vac Status;
  • Column Chamber Valve;
  • EHT Vac Ready;
  • Column Pumping;
  • Pump / Vent button status;
  • Bottom status indicators such as Vac, Gun, and EHT;
  • Any warning or message.

It is especially important to distinguish whether the System Vacuum is completely blank, fixed at atmosphere, decreasing to a certain value and stopping, or still slowly decreasing. These patterns correspond to different fault directions.

7.3 Record the Full Pump-Down Sequence

After clicking Pump or after automatic pumping at startup, a continuous video of at least 10–20 minutes should be recorded. The change of System Vacuum should be observed. If the pressure drops quickly from atmosphere to around 8 Pa and then remains there, the rough pumping is effective but the high-vacuum stage is not continuing. If the pressure does not change at all, the chamber seal, vent valve, pumping valve, and rough vacuum gauge should be checked again.

7.4 Check the Chamber Door and O-Ring

Although a major chamber leak is now less likely, the fault occurred after chamber opening, so the door seal should still be checked. The inspection should include:

  • Whether the O-ring is displaced;
  • Whether the O-ring has dents, cracks, hardening, or deformation;
  • Whether the sealing surface has conductive adhesive, dust, metal particles, or fibers;
  • Whether the sample stage is too high;
  • Whether the sample holder interferes with the door;
  • Whether a sample has dropped inside the chamber;
  • Whether detector ports or accessory flanges are loose.

An empty-chamber pump-down test is recommended to rule out sample or holder interference.

7.5 Check the Edwards Backing Pump

The backing pump should be checked for operating sound, indicator lamps, alarm status, pumping-load change, pipe connection, and exhaust condition. A running pump does not necessarily mean it has sufficient pumping speed or that the valve path is open. If the pump sounds unloaded all the time, the chamber may not be connected to the pump path. If the pump sounds heavily loaded but the pressure does not fall, there may be a large leak or a vent valve not fully closed.

7.6 Check the Turbo Pump and Controller

When System Vacuum has reached around 8 Pa, the turbo pump status becomes especially important. The following should be checked:

  • Whether the turbo pump starts;
  • Whether acceleration sound can be heard;
  • Whether the controller displays Ready, Normal, Acceleration, or Alarm;
  • Whether Fail, Error, or Overtemperature is present;
  • Whether backing pressure satisfies the turbo start condition;
  • Whether turbo pump cables and control lines are normal;
  • Whether the software shows any Turbo / TMP status.

If the turbo pump is not accelerating, even a good Penning gauge may not enter a valid high-vacuum measurement range.

7.7 Check the Penning / Cold Cathode Gauge

The Penning gauge body should be located, and its model, installation position, cable, and connector condition should be recorded. The key inspection points are:

  • Whether the connector is loose;
  • Whether the cable has been pulled or damaged;
  • Whether the connector is oxidized;
  • Whether the gauge is contaminated;
  • Whether the gauge is connected to the correct vacuum region;
  • Whether a replacement gauge is available for cross-testing;
  • Whether gauge supply or high-voltage excitation is normal.

If conditions allow, replacing the gauge with the same model or cross-checking the channel can help determine whether the fault is in the gauge body, the cable, or the control electronics. This must be done carefully by personnel familiar with the system, because incorrect handling of gauge wiring or high-voltage connectors can cause additional damage.

7.8 Check Compressed Air and Valve Group

Many SEM vacuum valves are pneumatic, so compressed air must be checked. The inspection should include:

  • Air compressor output pressure;
  • Instrument air pressure gauge;
  • Whether the air supply is dry;
  • Whether any air tube is loose;
  • Whether valve manifold indicators are normal;
  • Whether valve actuation sound is heard during Pump / Vent;
  • Whether the vent valve fully closes;
  • Whether the high-vacuum valve actuates;
  • Whether valve feedback is received by the control system.

If the high-vacuum valve does not open, the chamber may remain in the rough-vacuum stage and the software may continue waiting for Penning confirmation.

7.9 Check Logs and Status Records

Even if the server shows no obvious error, the Message Log, Event Log, and Vacuum Log should be reviewed. The following keywords are especially important:

  • Penning;
  • Cold Cathode;
  • Gauge;
  • Pirani;
  • TMP;
  • Turbo;
  • Valve;
  • Vacuum timeout;
  • Gun vacuum;
  • EHT;
  • Interlock.

No error message does not mean no fault. Many interlock conditions are shown only as a waiting state and may not be classified as an error.

8. Fault Priority Analysis

Based on the observed symptoms, the likely fault priority can be ranked as follows.

8.1 Penning Gauge or Its Measurement Circuit

This is the most direct suspect. The software explicitly displays Waiting Penning, and the high-vacuum gauge remains without valid reading. If the turbo pump and high-vacuum valve are confirmed normal, then the Penning gauge body, cable, supply, interface board, or vacuum control board channel becomes the primary target.

8.2 Turbo Pump Not Ready

If the turbo pump has not reached operating condition, the chamber cannot enter the high-vacuum range, and the Penning gauge may not produce a valid reading. This must be confirmed by controller status and software status, not just by listening for pump noise.

8.3 High-Vacuum Valve or Pneumatic Valve Not Actuated

If the valve does not open or the feedback signal is missing, the system may wait for Penning in the control sequence while the actual high-vacuum path is not established. Insufficient compressed air, defective solenoid valves, stuck valve bodies, and failed valve feedback can all cause this condition.

8.4 Vacuum Measurement Control Module Fault

The abnormal Gun Vacuum = 1000 mbar is a signal that the fault may be wider than a single chamber gauge. If multiple readings are abnormal, the vacuum measurement module, control board, communication line, power supply, and interface electronics must be inspected. Replacing only the Penning gauge may not solve the problem.

8.5 Minor Leak or Contamination Preventing High Vacuum

Although the chamber can rough-pump to around 8 Pa, a small leak may still prevent high vacuum. If the turbo pump and Penning gauge are functional but the pressure cannot decrease further, the O-ring, flanges, detector interfaces, vent valve, and chamber leak paths should be inspected.

9. Repair Recommendations

9.1 Do Not Replace the Gauge Blindly

Although the Penning gauge is a highly suspicious component, it should not be replaced blindly before confirming the turbo pump, valve group, compressed air, and measurement circuit. Blind replacement may increase service cost and may not address the actual fault.

9.2 Perform On-Site Diagnosis First

A reasonable service process should begin with on-site diagnosis. The following items should be confirmed:

  • Sample chamber sealing;
  • Backing pump performance;
  • Rough vacuum reading;
  • Turbo pump status;
  • Compressed air pressure;
  • Valve actuation;
  • Penning gauge and cable;
  • Gun Vacuum reading;
  • Vacuum control board and log status.

If the fault is only a loose connector, light gauge contamination, valve state problem, sealing-surface contamination, or software state issue, cleaning, reconnecting, resetting, or state recovery may restore the system. If the gauge is damaged, the control board channel is defective, the turbo pump fails, or the valve group is damaged, a separate repair quotation and parts plan will be required.

9.3 Protect the Electron Gun During Service

The field-emission gun is highly sensitive to vacuum contamination. During diagnosis and repair, the following rules must be followed:

  • Do not switch on EHT;
  • Do not force the Column Chamber Valve open;
  • Do not repeatedly Pump and Vent unnecessarily;
  • Do not disassemble electron gun high-vacuum components;
  • Do not attempt emission while Gun Vacuum is abnormal;
  • Do not modify vacuum interlock parameters randomly in service mode;
  • Do not force the vacuum sequence when the chiller, water, or compressed air conditions are abnormal.

The software keeping the valve closed and EHT disabled is normally a protection mechanism. These protections should not be bypassed.

10. Typical Diagnostic Conclusion

For a ZEISS Sigma 300 with chamber vacuum abnormality, if the sample chamber door is sucked tight, the System Vacuum can fall to around 8 Pa, the software remains at Waiting Penning, the server shows no obvious error, and the high-vacuum gauge has no valid reading, the following stage conclusion can be made:

  1. A major chamber door leak is less likely;
  2. The backing rough-pumping system is not completely failed;
  3. The fault is mainly concentrated in the high-vacuum confirmation chain;
  4. The Penning / cold cathode gauge and its measurement circuit are the first suspects;
  5. Turbo pump Ready status, high-vacuum valve actuation, and compressed air pressure must be checked at the same time;
  6. If Gun Vacuum remains at 1000 mbar, the diagnosis must expand to the vacuum measurement control module, communication, or supply circuit;
  7. Before EHT Vac Ready becomes valid, EHT must not be enabled and the column valve must not be forced open.

11. Conclusion

Vacuum faults in a scanning electron microscope cannot be diagnosed from one pressure value alone. They also should not be solved by replacing one component simply because a process status mentions a gauge. The ZEISS Sigma 300 vacuum system is built from the backing pump, turbo pump, Pirani gauge, Penning gauge, valve group, compressed air system, control electronics, and software interlocks. The chamber door being sucked tight means rough vacuum exists, but it does not mean high vacuum has been achieved. Waiting Penning points to the high-vacuum confirmation chain, but it does not prove that the Penning gauge body itself is definitely defective. An abnormal Gun Vacuum value further suggests a possible deeper issue in the vacuum measurement system.

The correct diagnostic method is to follow the vacuum establishment sequence step by step. First confirm chamber sealing and rough pumping capability. Then confirm the turbo pump and valve actuation. Next inspect the Penning gauge, cable, supply, interface board, and vacuum control board. Finally, use the logs and interlock status to determine whether a common measurement-circuit problem exists.

Only by distinguishing between “the actual vacuum has not reached the required condition” and “the vacuum may be present but the system cannot read or confirm it” can misdiagnosis and unnecessary replacement of expensive components be avoided.

For this type of fault, the key service focus should be on the Penning high-vacuum gauge and its measurement circuit, turbo pump Ready status, high-vacuum valve actuation, and the vacuum control module. Until the fault is clearly identified, EHT should remain off, the column chamber valve should remain closed, and any operation that may contaminate the electron gun or expand the fault should be avoided.

Posted on

Analysis of Image Quality Degradation After Filament Replacement in the JEOL JEM-1400 Transmission Electron Microscope: Systematic Troubleshooting from Filament Emission and Vacuum Conditions to Electron Gun Alignment

1. Background: A TEM Filament Is Not an Ordinary “Light Bulb”

In the JEOL JEM-1400 transmission electron microscope (TEM), the so-called “bulb” is actually the electron gun filament, which serves as the electron emission source. In tungsten-filament TEM systems, the filament does not provide illumination in the traditional optical sense. Instead, under high vacuum and high-voltage conditions, it emits electrons through thermionic emission. The emitted electron beam passes through the Wehnelt electrode, anode, condenser lens system, objective lens system, specimen region, and imaging system before finally forming an image on the fluorescent screen or digital camera.

Because of this, filament replacement is not merely a simple consumable replacement procedure. It directly involves the electron gun structure, vacuum system, high-voltage stability, beam current stability, gun alignment, and imaging calibration. A filament that can emit electrons does not necessarily mean the microscope has returned to optimal imaging performance. Many JEM-1400 systems exhibit the condition commonly described as “the microscope still works, but the image quality is poor” after filament replacement.

Typical symptoms include:

  • Reduced image brightness
  • Gray or low-contrast images
  • Difficulty focusing
  • Off-center beam spot
  • Uneven illumination
  • Unstable beam current
  • Poor high-magnification resolution
  • Increased camera noise
  • Beam drift or fluctuation

These issues cannot simply be attributed to “a bad filament” or “the wrong filament model.” Proper diagnosis requires systematic analysis of:

  • Filament compatibility
  • Installation orientation
  • Electron gun contamination
  • Vacuum condition
  • HT (high tension) voltage stability
  • Beam current stability
  • Filament saturation
  • Gun alignment after replacement
  • Beam alignment
  • Specimen condition
  • Camera and imaging settings

JEOL JEM-1400 transmission electron microscope control software interface showing HT voltage at 100 kV, filament ON status, beam current settings, vacuum monitor diagram, stage controller, and alignment control panel.

2. Basic Equipment and Filament Verification

For the JEOL JEM-1400, the instrument label typically identifies the system as JEM-1400 Electron Microscope along with its serial information. Systems equipped with HC (High Contrast) pole pieces are particularly sensitive to beam alignment, specimen height, beam stability, and sample thickness.

Replacement tungsten filaments are commonly labeled as:

FILAMENT / K-TYPE MA113008

Physically, these filaments generally consist of:

  • A circular metal mounting base
  • Ceramic insulation
  • Two electrical pins
  • A central tungsten emission wire

Installation is not simply a matter of inserting the filament assembly. The following factors significantly affect beam quality:

  • Filament center height
  • Pin contact quality
  • Tungsten wire position
  • Mounting orientation
  • Concentricity with the Wehnelt aperture

Even if the old filament was discarded and no reference photos exist, reliable diagnosis is still possible. Comparing the old and new filaments is only a secondary aid. The more important checks are:

  1. Whether the filament model matches the electron gun configuration
  2. Whether the replacement filament packaging corresponds to the proper JEM-1400 filament type
  3. Whether the new filament is physically intact
  4. Whether the tungsten wire is centered
  5. Whether the pins are straight and undamaged
  6. Whether stable beam current can be achieved after installation
  7. Whether a controllable beam spot appears on the fluorescent screen

If these conditions are verified step by step, troubleshooting can continue even without the original filament.


Close-up external view of the JEOL JEM-1400 electron gun filament housing and electron source assembly mounted on the TEM column in a laboratory environment.

3. Safety Conditions Before and After Filament Replacement

TEM filament replacement must follow strict high-voltage and vacuum safety procedures. The electron gun area of the JEM-1400 involves:

  • High voltage
  • High vacuum
  • Precision alignment structures
  • Clean internal surfaces

Improper handling may result in:

  • High-voltage discharge
  • Electron gun contamination
  • Reduced filament lifetime
  • Vacuum instability
  • Damage to the HT system

Before replacement, ensure:

  • HT is OFF
  • Filament power is OFF
  • The electron gun is fully cooled
  • The gun chamber has been vented properly
  • Only the filament assembly is accessed
  • No unrelated high-voltage covers are removed
  • Clean gloves and proper tools are used

Never touch:

  • Tungsten wire
  • Ceramic surfaces
  • Wehnelt aperture
  • Contact surfaces

Each disassembly step should be documented with photos, especially:

  • Mounting orientation
  • Insertion depth
  • Locking screw positions

After replacement, HT should not be enabled immediately. The gun chamber and associated vacuum regions must first recover to proper vacuum levels. Gun, Column, Specimen Chamber, and Detector Chamber should all reach READY status before HT and Filament are turned on.

Enabling HT under poor vacuum conditions may cause:

  • Gun discharge
  • Wehnelt contamination
  • Anode contamination
  • Instability of emission

Transmission electron microscope sample image displayed on a monitor, showing high-magnification grayscale cellular ultrastructure captured by a JEOL JEM-1400 TEM system.

4. Vacuum Status Is the First Requirement Before Judging Filament Performance

The JEM-1400 vacuum interface typically displays statuses for:

  • Gun
  • Column
  • Specimen Chamber
  • Detector Chamber
  • RT1
  • Penning Gauge

Before evaluating filament performance, vacuum conditions must first be confirmed.

Typical normal status indicators include:

  • Gun: Evac Ready
  • Column: Evac Ready
  • Specimen Chamber: Evac Ready
  • Detector Chamber: Evac Ready
  • RT1: Evac Ready
  • Penning Gauge: Vac Ready

If any section shows NOT READY, especially the Specimen Chamber, image quality evaluation becomes unreliable.

Common causes include:

  • Specimen holder not fully inserted
  • Chamber leakage
  • Vacuum valve issues
  • Incomplete evacuation
  • Damaged seals
  • Improper loading procedures

Under these conditions, HT may fail to activate properly, or image quality may degrade regardless of filament condition.

A common mistake is assuming:
“The image quality became poor after filament replacement, therefore the filament is defective.”

However, if the vacuum condition itself is unstable, filament evaluation becomes meaningless.


JEOL transmission electron microscope control panel with illuminated power, vacuum, filament, detector air, and column air status indicators during system operation.

5. Relationship Between HT, Filament, and Beam Current

The JEM-1400 requires HT voltage to generate the electron beam. Typical operating voltages include:

  • 80 kV
  • 100 kV
  • 120 kV

Typical software status indications include:

  • HT ON
  • Current HT: 100.00 kV
  • Filament ON
  • Beam ON
  • Beam Current: tens of microamps

If HT remains OFF or Current HT remains at 0 kV, proper electron imaging cannot occur even if the filament is heated.

If the system displays:

  • HT ON
  • Current HT: 100.00 kV
  • Filament ON
  • Beam Current around 57–58 μA
  • Visible fluorescent beam spot

then the filament is clearly emitting electrons.

This does not automatically mean imaging performance is optimal. Beam current alone only confirms electron emission. Additional evaluation is required for:

  • Beam stability
  • Beam centering
  • Brightness
  • Beam symmetry
  • Saturation condition
  • Gun alignment

If Beam Current is approximately 57 μA and the fluorescent spot responds smoothly to Brightness adjustment, the filament should not immediately be considered defective.

In such cases, poor beam alignment after replacement is a far more likely cause.


Engineer wearing protective gloves installing a tungsten filament assembly into the electron gun of a JEOL JEM-1400 transmission electron microscope during maintenance and alignment procedure.

6. How to Evaluate Beam Condition Without a Specimen

Although final imaging quality must ultimately be judged using a specimen, important preliminary evaluation can still be performed without any sample loaded.

After filament replacement, fluorescent screen observation is often more important than camera imaging.

The following checks can be performed without a specimen:

Low-Magnification Beam Spot Observation

Set magnification to:

  • X400
  • X800

Set Spot Size to:

  • 1
  • 2

Adjust Brightness and observe whether a green fluorescent beam spot appears.

Brightness Adjustment Test

Slowly adjust Brightness.

The beam spot should:

  • Expand smoothly
  • Contract smoothly
  • Change brightness continuously
  • Remain stable
  • Not flicker
  • Not disappear abruptly

Beam Centering

If the beam spot is significantly off-center, Beam Shift, Gun Alignment, or Beam Alignment is required.

This is extremely common after filament replacement.

Beam Shape and Uniformity

A proper beam should appear:

  • Circular
  • Uniform
  • Symmetrical
  • Adjustable

Uneven illumination or distorted shape may indicate:

  • Gun misalignment
  • Off-center filament installation
  • Wehnelt contamination
  • Condenser misalignment
  • Aperture issues

Beam Current Stability

After HT and Filament are enabled, Beam Current should remain relatively stable.

Large fluctuations or gradual decay may indicate:

  • Filament aging
  • Poor electrical contact
  • Gun contamination
  • High-voltage instability

Without a specimen, one cannot judge ultimate resolution performance, but it is entirely possible to evaluate:

  • Electron emission
  • Beam stability
  • Beam centering
  • Basic electron optical alignment

7. Importance of Filament Saturation

Tungsten filaments require proper filament saturation adjustment after replacement.

Simply enabling Filament power is insufficient.

Without proper saturation:

  • Brightness may be inadequate
  • Beam current may fluctuate
  • Filament lifetime may shorten significantly

As filament current increases:

  • Beam current should increase
  • Fluorescent brightness should increase

Eventually, the increase slows and reaches a relatively stable plateau. This plateau represents the appropriate saturation region.

If filament current approaches maximum while Beam Current remains low and brightness remains weak, possible causes include:

  • Filament aging
  • Poor-quality filament
  • Off-center installation
  • Contact issues
  • Gun contamination

If Beam Current fluctuates heavily during adjustment, possible causes include:

  • Poor contact
  • Wehnelt contamination
  • Imminent high-voltage discharge

If Beam Current is stable and brightness is adequate, immediate replacement is generally unnecessary.

Overheating tungsten filaments greatly reduces service life. Many “rapid failures” are actually caused by:

  • Improper saturation
  • Excessive operating temperature
  • Poor vacuum conditions
  • Gun contamination

8. Electron Gun Alignment Must Be Repeated After Filament Replacement

One of the most commonly overlooked procedures after filament replacement is electron gun realignment.

Even with the correct filament model, the following factors will differ slightly from the original filament:

  • Wire position
  • Pin depth
  • Ceramic height
  • Mechanical seating

Therefore, the electron optical axis changes after replacement.

The following adjustments are typically required:

  • Gun Alignment
  • Beam Alignment
  • Beam Shift
  • Condenser Alignment
  • Beam Tilt
  • Spot Size alignment
  • Brightness-related condenser adjustments
  • Astigmatism correction if necessary

Without realignment, typical symptoms include:

  • Off-center beam
  • Uneven illumination
  • Poor high-magnification imaging
  • Low contrast
  • Difficulty focusing
  • Increased camera noise

These problems are often mistaken for defective filaments when the actual cause is incomplete alignment.

Replacing a filament without re-aligning the gun is comparable to replacing a laser source without recalibrating the optical path.

The system may still function, but image quality will not be optimal.


9. Effects of Off-Center Installation and Wehnelt Contamination

If proper beam quality cannot be achieved even after adjustment, mechanical installation and contamination should be investigated.

Off-Center Filament Installation

If the filament assembly is:

  • Not fully seated
  • Incorrectly oriented
  • Unevenly tightened
  • Improperly positioned

the emission point may shift away from the electron optical axis.

This causes:

  • Off-center beam
  • Uneven illumination
  • Excessive alignment correction requirements

Tungsten Wire Deformation

If the filament wire is bent during handling or installation, beam quality may degrade significantly.

Wehnelt Aperture Contamination

Contamination around the Wehnelt aperture may cause:

  • Beam instability
  • Beam deflection
  • Gray images
  • Reduced brightness
  • High-voltage discharge

Fingerprint Contamination

Direct contact with ceramic or filament surfaces introduces oils that become severe contamination sources under vacuum and HT conditions.


10. When Should Another Filament Actually Be Replaced?

A common field situation occurs when one filament from a new box has already been installed, image quality is unsatisfactory, and several unused filaments remain available. The operator may immediately want to replace another filament.

This is not always the best decision.

Each electron gun disassembly increases the risk of:

  • Contamination
  • Misalignment
  • Vacuum leakage
  • Recovery downtime

Replacement should only be considered if several of the following are observed:

  • Beam Current cannot reach normal levels
  • Brightness remains weak even near maximum filament setting
  • Beam Current fluctuates heavily
  • Beam intermittently disappears
  • Saturation plateau cannot be reached
  • Alignment cannot restore centered stable illumination
  • Filament appears physically damaged

If the system already shows:

  • HT ON
  • 100 kV
  • Beam Current around 57–58 μA
  • Bright fluorescent beam spot

then the filament should not immediately be judged defective.

Beam alignment should be completed first.


11. Poor Images Are Not Always Caused by the Filament

TEM image quality depends on many factors beyond the filament itself.

Even with proper beam emission, poor specimen quality may cause unsatisfactory images.

Possible non-filament causes include:

  • Thick specimens
  • Damaged sections
  • Poor staining
  • Specimen drift
  • Objective aperture contamination
  • Incorrect aperture positioning
  • Poor focus
  • Astigmatism
  • Camera exposure settings
  • Camera aging
  • Mechanical vibration

Therefore, a single specimen image cannot definitively determine filament condition.


12. Recommended Troubleshooting Procedure

For JEM-1400 systems with degraded image quality after filament replacement, the recommended diagnostic sequence is:

Step 1: Verify Vacuum

Confirm all major vacuum sections are READY.

Step 2: Verify HT

Confirm HT ON and correct operating voltage.

Step 3: Verify Electron Emission

Enable Filament and Beam. Confirm stable Beam Current.

Step 4: Observe Fluorescent Beam Spot

Check beam visibility, centering, symmetry, and response to Brightness adjustment.

Step 5: Perform Filament Saturation

Confirm stable saturation plateau.

Step 6: Perform Gun Alignment and Beam Alignment

Center and optimize the beam.

Step 7: Evaluate Specimen Images

Use standard or disposable test specimens.

Step 8: Inspect Gun Components if Necessary

Inspect filament, Wehnelt, and contacts only if previous steps fail.

Step 9: Replace Another Filament Only if Necessary

Avoid unnecessary repeated gun disassembly.


13. Conclusion

Image quality degradation after filament replacement in the JEOL JEM-1400 is a comprehensive electron optical system issue rather than a simple “bad filament” problem.

If the microscope can achieve:

  • 100 kV HT
  • Stable Beam Current around 57 μA
  • Bright fluorescent beam spot
  • Smooth Brightness response

then the filament is at least functioning as a valid electron emitter.

Under these conditions, priority should be given to:

  • Beam centering
  • Filament saturation
  • Gun alignment
  • Beam alignment
  • Condenser alignment

before deciding to replace another filament.

A filament should only be replaced when there is clear evidence of failure such as:

  • Insufficient emission
  • Severe instability
  • Saturation failure
  • Physical filament damage
  • Persistent abnormal beam behavior after proper alignment

For TEM service engineers and technical support personnel, the correct troubleshooting sequence is:

Verify vacuum → verify HT → verify emission → optimize beam alignment → evaluate imaging → replace filament only if necessary.

Following this sequence minimizes unnecessary disassembly, reduces contamination risk, and restores stable imaging performance efficiently.

Posted on

Particle Metrix ZetaView NTA Analyzer Startup Self-Test Failure and Stepper Drive Timeout Fault Diagnosis

1. Overview of the Fault Phenomenon

The Particle Metrix ZetaView is a nanoparticle tracking analysis (NTA) instrument widely used for the characterization of exosomes, viruses, liposomes, nanomaterials, protein aggregates, colloidal suspensions, and other nanoscale particles. Although it appears externally as a compact benchtop laboratory analyzer, internally it integrates a laser illumination system, microscopic imaging system, sample cell positioning mechanism, temperature and fluid control system, camera acquisition module, motion control system, and dedicated analysis software.

One common field failure encountered on this type of instrument is startup initialization failure. After powering on the instrument and launching the ZetaVIEW software, the system cannot complete the self-check procedure. During initialization or Cell Check, the software displays an error message similar to:

A timeout occurred while ZetaVIEW was waiting for the stepper drives to stop.
ZetaVIEW will be stopped without saving the configuration file.
Please contact the ZetaVIEW Video Microscope Administrator.

This error does not simply indicate a software crash or Windows problem. It means that during startup initialization, the software issued a motion command to the internal stepper motor system, but the instrument failed to return the expected “motion completed” or “drive stopped” status within the allowed time window.

For service engineers, this is a critical distinction. Reinstalling the software or replacing the PC may not resolve the issue. In most cases, the fault is associated with one or more of the following subsystems:

  • Sample cell installation or positioning problems
  • Mechanical blockage inside the motion platform
  • Stepper motor or stepper driver failure
  • Home sensor or limit switch malfunction
  • Motion controller communication errors
  • Internal power supply instability
  • Liquid contamination, salt crystallization, or corrosion inside the instrument

Therefore, when a ZetaView analyzer reports a “stepper drives timeout” error during startup, troubleshooting should focus primarily on the internal motion control system rather than the software alone.


Particle Metrix ZetaView NTA analyzer showing a ZetaVIEW software self-test failure with a stepper drive timeout error on the connected computer screen.

2. Basic Internal Structure of the ZetaView NTA Analyzer

Understanding the internal architecture of the analyzer is essential for correct fault diagnosis.

The ZetaView is not merely an optical microscope. Its operation is based on nanoparticle tracking analysis. Nanoparticles suspended in liquid undergo Brownian motion. A laser illuminates the particles inside the sample cell, and the microscopic imaging system captures the scattered light from each particle. The software then calculates particle size distribution by analyzing particle motion trajectories.

To achieve this, the instrument includes several interconnected systems.


2.1 Laser Illumination System

The analyzer requires a stable laser source to illuminate nanoparticles inside the measurement cell. Scattered light from the particles is captured by the camera system.

Laser-related failures usually produce symptoms such as:

  • Dark image
  • No visible particles
  • Weak scattering intensity
  • High optical noise
  • Unstable illumination

However, laser faults generally do not directly trigger “stepper drive timeout” errors unless multiple initialization procedures fail simultaneously.


2.2 Microscopic Imaging System

The instrument includes:

  • Microscope optics
  • Imaging camera
  • Focus adjustment mechanism
  • Optical positioning assembly

The software functions “Auto Alignment” and “Optimize Focus” indicate that the system must move and adjust optical components during initialization.

If the imaging system fails, typical symptoms include:

  • Black image
  • Blurred particles
  • Unstable focus
  • Excessive background noise
  • Missing particle trajectories

Again, these faults alone normally do not generate the specific “waiting for the stepper drives to stop” error unless the motion system involved in focusing is malfunctioning.


2.3 Sample Cell and Fluidic System

The sample cell is where nanoparticle measurements occur. Tubing connections allow sample injection, flushing, and fluid exchange.

The software screen often displays messages such as:

  • Remove Cell Assembly
  • Cell Connected
  • Cell Quality Check

If the sample cell is improperly installed, contaminated, misaligned, or mechanically interfering with the positioning mechanism, the motion platform may fail during initialization.

Common issues include:

  • Misaligned sample cell
  • Salt residue inside the holder
  • Damaged sealing ring
  • Deformed mounting mechanism
  • Mechanical obstruction
  • Improper insertion depth

2.4 Motion Control System

The motion system is the most important subsystem related to this fault.

Inside the analyzer, several precision movements may be controlled by stepper motors:

  • Sample cell positioning
  • Focus adjustment
  • Optical path alignment
  • Stage positioning
  • Internal calibration movement

During startup, the software typically performs:

  • Homing operations
  • Position calibration
  • Focus initialization
  • Alignment verification
  • Motion completion checks

If any axis fails to stop correctly, or if the controller does not receive the expected completion signal, the software eventually reports a timeout error.


Engineer diagnosing and repairing a Particle Metrix ZetaView NTA nanoparticle analyzer with the instrument panel open, using a multimeter and laptop during troubleshooting.

3. Technical Meaning of the Error Message

The key phrase is:

waiting for the stepper drives to stop

This is extremely important.

It means the software successfully communicated with the instrument and attempted to control the internal motion system. The failure occurred after motion commands were already issued.

This implies several important conclusions:

  1. The instrument is at least partially communicating with the PC.
  2. The motion initialization process has started.
  3. The software is waiting for confirmation that the stepper-driven mechanism has stopped or reached its target position.
  4. That confirmation never arrived within the allowed time.

Therefore, the root problem lies somewhere within the motion control chain:

  • Mechanical movement
  • Stepper motors
  • Driver electronics
  • Home sensors
  • Limit switches
  • Motion feedback logic
  • Controller communication

This is not primarily a Windows or GUI software problem.


4. Common Causes of the Fault

4.1 Sample Cell Assembly Problems

The appearance of “Remove Cell Assembly” suggests that the software is checking sample cell status during startup.

If the sample cell is:

  • Improperly seated
  • Mechanically obstructing movement
  • Contaminated
  • Deformed
  • Incorrectly installed

the initialization sequence may fail.

This is particularly common when:

  • Operators force the cell into position
  • Salt crystals accumulate
  • Sample liquid leaks into the holder
  • The positioning mechanism becomes misaligned

A practical first step is always:

  1. Power off the instrument
  2. Remove the sample cell
  3. Clean the mounting area
  4. Restart the analyzer
  5. Retry initialization

If the instrument passes startup without the cell installed, the fault is strongly related to the sample cell assembly or associated positioning mechanism.


4.2 Mechanical Blockage

Mechanical resistance is one of the most common causes of stepper timeout errors.

Typical sources include:

  • Dried sample residue
  • Salt crystallization
  • Corrosion
  • Contaminated guide rails
  • Damaged bearings
  • Misaligned sliders
  • Bent lead screws
  • Foreign debris inside the motion path

Typical symptoms:

  • Humming motor without movement
  • Clicking or knocking sounds
  • Intermittent startup success
  • Axis stalling during homing
  • Excessive resistance during manual movement

NTA analyzers often operate with biological buffers and saline solutions. Even small liquid leaks can eventually contaminate precision mechanical assemblies.


4.3 Stepper Motor Failure

Stepper motors themselves can fail, although this is less common than mechanical blockage or driver board faults.

Possible motor-related issues include:

  • Open motor winding
  • Shorted winding
  • Connector failure
  • Bearing seizure
  • Motor overheating
  • Insufficient holding torque
  • Damaged cables

Diagnostic methods include:

  • Measuring winding resistance
  • Checking motor holding torque
  • Observing motor vibration
  • Listening for abnormal noise

A motor that vibrates but does not rotate often indicates either:

  • Mechanical blockage
  • Incorrect drive signals
  • Coil phase problems
  • Driver current failure

4.4 Stepper Driver Board Failure

The stepper driver board converts motion commands into motor current.

Failures may involve:

  • Burned driver ICs
  • Overcurrent protection triggering
  • Damaged MOSFETs
  • Corroded PCB traces
  • Loose connectors
  • Missing enable signals
  • Driver overheating
  • Power supply collapse

Typical symptoms:

  • Motor has no holding torque
  • Motor briefly moves then stops
  • Driver IC overheating
  • Repeated startup failures
  • Axis movement instability

Because many ZetaView instruments use proprietary motion control boards, board-level diagnosis may require oscilloscope testing and electronic repair skills.


4.5 Home Sensor or Limit Switch Failure

During startup, the instrument typically performs homing operations.

The motion axis moves toward a reference position until:

  • A home sensor activates
  • A limit switch changes state
  • A position feedback signal is detected

If this feedback never occurs, the software waits indefinitely until timeout.

Common causes include:

  • Dust blocking optical sensors
  • Broken limit switches
  • Misaligned sensor flags
  • Loose sensor connectors
  • Broken wires
  • Failed Hall sensors
  • Corroded optical interrupters

This is one of the most common root causes of startup timeout faults.


4.6 Internal Power Supply Problems

Motion systems require stable power.

Typical internal voltages include:

  • 24V motor supply
  • 12V auxiliary supply
  • 5V logic supply

Power-related faults may produce:

  • Random startup failures
  • Weak motor movement
  • Driver resets
  • Unstable communication
  • Excessive ripple noise
  • Voltage drop during motion

Important diagnostic points include:

  • Voltage stability under load
  • Ripple measurement
  • Capacitor aging
  • Connector oxidation
  • Power supply overheating

A static voltage reading alone is insufficient. Dynamic measurements during motor movement are far more useful.


4.7 Communication or Software Configuration Issues

Although the primary fault is usually hardware-related, communication problems should still be considered.

Potential issues include:

  • USB communication instability
  • Driver mismatch
  • Incorrect software version
  • Permission conflicts
  • Corrupted configuration files
  • PC power management problems

However, if the software already reaches the Cell Check interface and displays “Cell Connected,” communication is likely at least partially functional.

Therefore, communication issues are usually secondary rather than primary causes.


5. Recommended Troubleshooting Procedure

Step 1 – Record the Complete Failure Behavior

Before disassembly, record:

  • Software version
  • Exact error message
  • Startup timing
  • Motor sounds
  • Recent maintenance history
  • Sample leakage history
  • Transport history
  • Environmental conditions

This information greatly improves diagnostic efficiency.


Step 2 – Perform Minimal Startup Configuration

Reduce the system to the simplest possible state:

  1. Remove the sample cell
  2. Disconnect unnecessary peripherals
  3. Restart the analyzer
  4. Observe initialization behavior

If startup succeeds without the sample cell installed, focus on the cell assembly mechanism.


Step 3 – Listen to Internal Motion Behavior

Motor sounds provide valuable clues.

No sound at all

Possible causes:

  • No power
  • Dead driver board
  • Controller not issuing commands

Humming without movement

Possible causes:

  • Mechanical blockage
  • Insufficient drive current
  • Jammed axis

Repetitive clicking

Possible causes:

  • Failed homing
  • Sensor malfunction
  • Axis hitting mechanical stop

Brief movement then timeout

Possible causes:

  • Feedback failure
  • Motion interruption
  • Controller communication issue

Step 4 – Inspect Mechanical Assemblies

Check for:

  • Corrosion
  • Salt deposits
  • Contamination
  • Misalignment
  • Loose couplings
  • Damaged rails
  • Broken belts
  • Liquid intrusion

Mechanical inspection should always be performed carefully to avoid disturbing optical alignment.


Step 5 – Check Home Sensors and Limit Switches

Measure:

  • Sensor supply voltage
  • Output signal switching
  • Connector integrity
  • Wiring continuity

A failed home sensor can completely prevent successful initialization even if the motor itself is functioning normally.


Step 6 – Test Motors and Driver Boards

Key checks include:

  • Winding resistance
  • Driver board supply voltage
  • Enable signals
  • STEP/DIR signal activity
  • Motor holding torque
  • Driver temperature

Oscilloscope testing may be required for advanced diagnosis.


Step 7 – Verify Power Supplies

Measure:

  • 24V rail
  • 12V rail
  • 5V rail
  • Ripple voltage
  • Voltage sag during motion

Aging capacitors frequently cause intermittent startup problems in older laboratory instruments.


6. Repair Approaches

Depending on the root cause, repairs may involve:

  • Cleaning contamination
  • Realigning sample cell assemblies
  • Replacing sensors
  • Repairing motion rails
  • Replacing driver ICs
  • Rebuilding power supplies
  • Repairing corroded PCBs
  • Replacing damaged stepper motors
  • Reconfiguring software settings

After repair, the instrument must pass:

  • Startup initialization
  • Cell Quality Check
  • Auto Alignment
  • Optimize Focus
  • Standard particle testing

Only then can the repair be considered complete.


7. Important Diagnostic Distinctions

Software startup failure is not the same as self-test failure

If the software does not launch at all, the issue may be PC-related.

If the software launches but reports stepper timeout during initialization, the fault is inside the instrument.


“Cell Connected” does not mean the analyzer is healthy

This only confirms partial communication. Motion systems, optics, and sensors may still be malfunctioning.


Motor noise does not guarantee proper movement

A powered stepper motor may hum even when stalled.


Smooth mechanics do not guarantee healthy sensors

The axis may move correctly while the controller still fails to detect home position feedback.


Static voltage readings can be misleading

Power supplies may appear normal without load but collapse during motor operation.


8. Preventive Maintenance Recommendations

To reduce future failures:

  • Clean the sample cell after every use
  • Prevent liquid leakage
  • Avoid salt crystallization
  • Periodically exercise the instrument
  • Avoid forcing mechanical assemblies
  • Inspect tubing regularly
  • Monitor unusual startup sounds
  • Keep internal motion systems clean

Proper preventive maintenance significantly reduces the risk of motion system failures.


9. Conclusion

The “waiting for the stepper drives to stop” timeout error on a Particle Metrix ZetaView NTA analyzer is fundamentally a motion control initialization failure rather than a simple software problem.

The root cause usually lies in one or more of the following areas:

  • Mechanical blockage
  • Stepper motor failure
  • Driver board malfunction
  • Home sensor failure
  • Motion controller faults
  • Internal power instability
  • Sample cell positioning issues

Effective troubleshooting requires a structured approach:

  1. Observe startup behavior
  2. Listen to motor activity
  3. Inspect mechanics
  4. Verify sensors
  5. Test power supplies
  6. Diagnose driver electronics
  7. Validate software configuration

For precision laboratory instruments such as the ZetaView, successful repair means more than simply reopening the software. The analyzer must complete initialization, pass Cell Check procedures, perform stable Auto Alignment, and generate reliable nanoparticle measurements before the repair can be considered complete.

In practical field service, the “stepper drives timeout” message is actually highly valuable because it clearly narrows the problem to the motion control system. Once the troubleshooting process is focused on motors, sensors, mechanics, power supplies, and motion feedback signals, the fault can usually be isolated efficiently and repaired systematically.