
In industrial flue gas monitoring systems, ammonia slip measurement is often treated as a “parameter problem.” If the displayed value is too high, people first suspect calibration. If an alarm appears, they check wiring. If the reading does not fall to zero after a fiber disconnection, they immediately suspect the main board or analog output. However, for a Siemens LDS 6 laser gas analyzer based on tunable diode laser absorption principles, this line of thinking can easily send troubleshooting in the wrong direction. The core reason is simple: this type of analyzer is not a conventional extractive instrument. It is a highly integrated in-situ optical measurement system whose stability depends simultaneously on the optical path, reference channel, laser driver, detector chain, internal signal processing, and system status logic. Once the optical path is contaminated, connector coupling degrades, or lens surfaces become dirty, the instrument may display symptoms that look exactly like board failure, even though the root cause is not in the electronics at all.
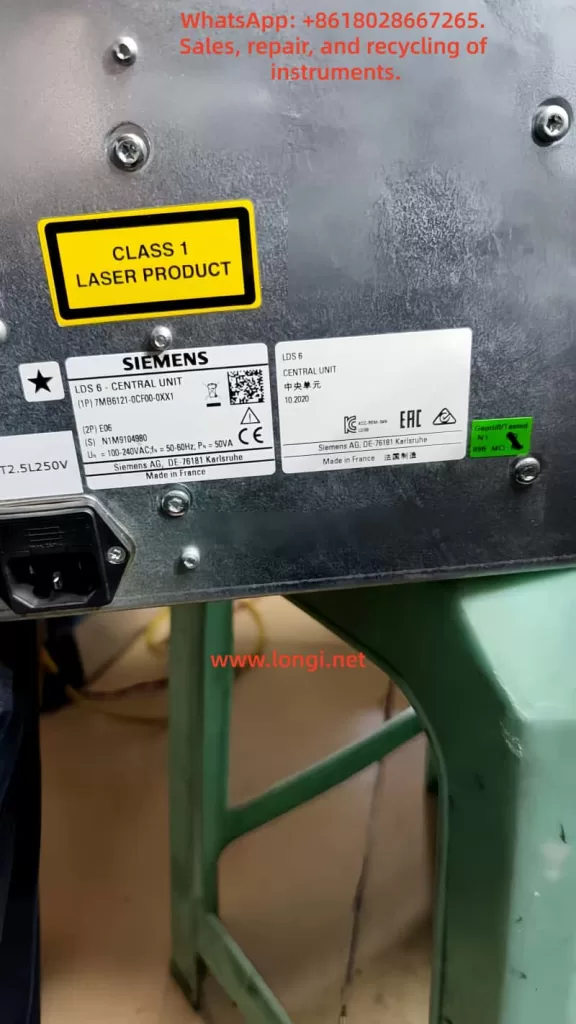
This article is based on an actual troubleshooting process involving a Siemens LDS 6 ammonia slip analyzer central unit. It focuses on several typical symptoms: excessively high readings, readings that remain after optical disconnection, abnormal transmission values, status bar fault switching, distorted diagnostic values, and apparent logic inconsistency. The investigation ultimately led to a clear conclusion: the root cause was not main board failure, not an acquisition or computation board defect, and not a permanently forced analog output. The real fault was optical contamination at fiber connectors, lenses, or related optical interfaces. After cleaning, the analyzer returned to normal operation.
This kind of case is highly valuable for maintenance engineers, instrument technicians, and process analysis specialists because it reveals a crucial truth: for an LDS 6, optical path integrity must be placed very high in the diagnostic priority list. If not, a technician can waste a great deal of time replacing boards, questioning software versions, or chasing output logic issues while ignoring the actual cause.
1. Why LDS 6 ammonia slip analyzer faults are so easily misdiagnosed
When field personnel encounter abnormal readings on an LDS 6, they usually think of two categories first.
The first is software or parameter problems. These include measurement range mismatch, compensation parameter errors, output hold states, unresolved function control, and other menu-related issues.
The second is electronic board failure. Typical suspicions include acquisition and computation board faults, frozen display values, forced analog output, unstable main controller operation, EEPROM issues, or FPGA problems.
These suspicions are not entirely unreasonable. However, they both rely on the same hidden assumption: that the optical chain is still basically healthy. Once that assumption is false, many symptoms that appear “electronic” are only secondary reflections of an optical fault.
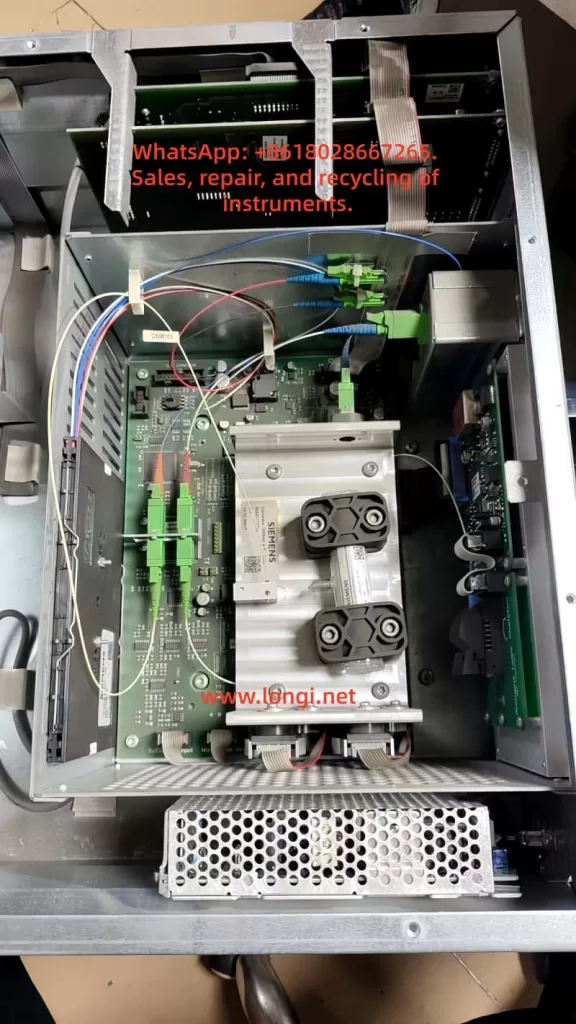
The LDS 6 does not simply calculate concentration from a single analog input board. Its measurement result depends on the coordinated operation of the laser source, reference path, monitor path, field optical path, receiver channel, signal processing chain, and status logic. If any part of the optical coupling degrades, the analyzer may show several confusing behaviors:
- The measured concentration may become too high, too low, or fail to return to zero.
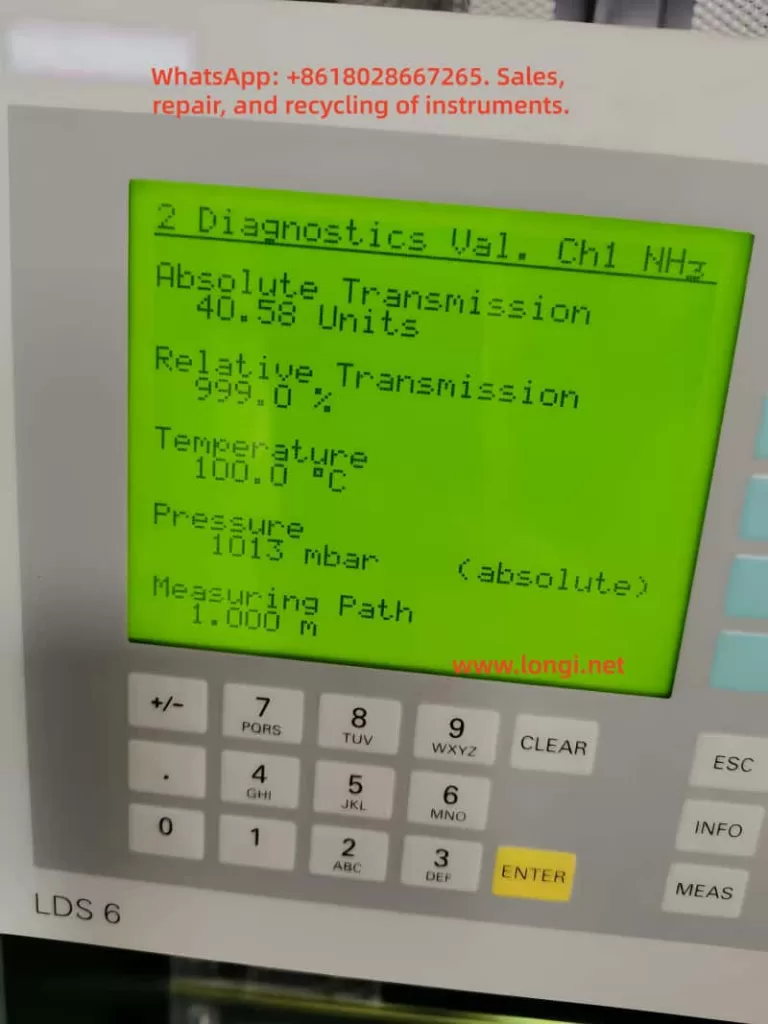
- The Diagnostics page may show severely distorted Absolute Transmission and Relative Transmission values.
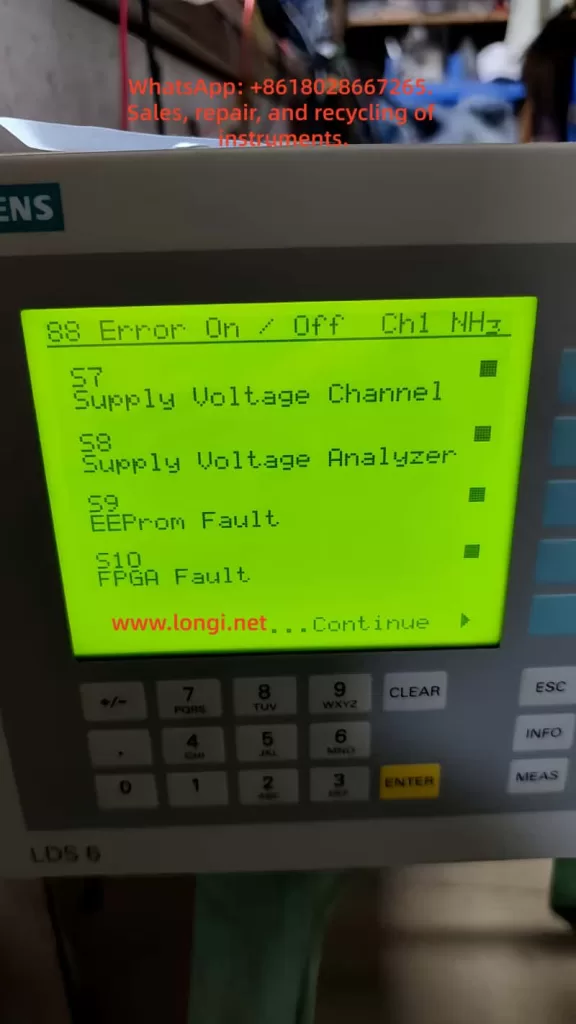
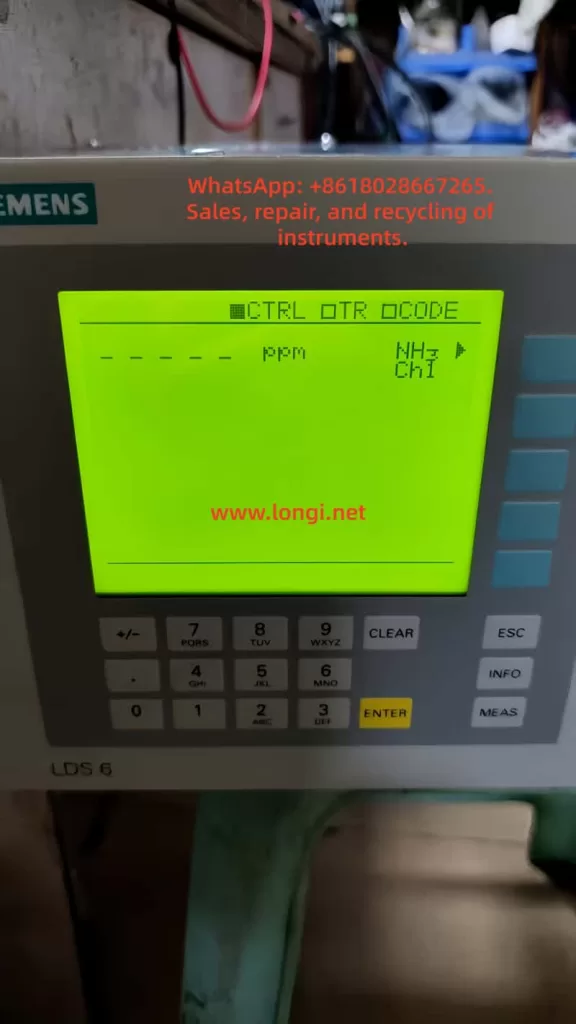
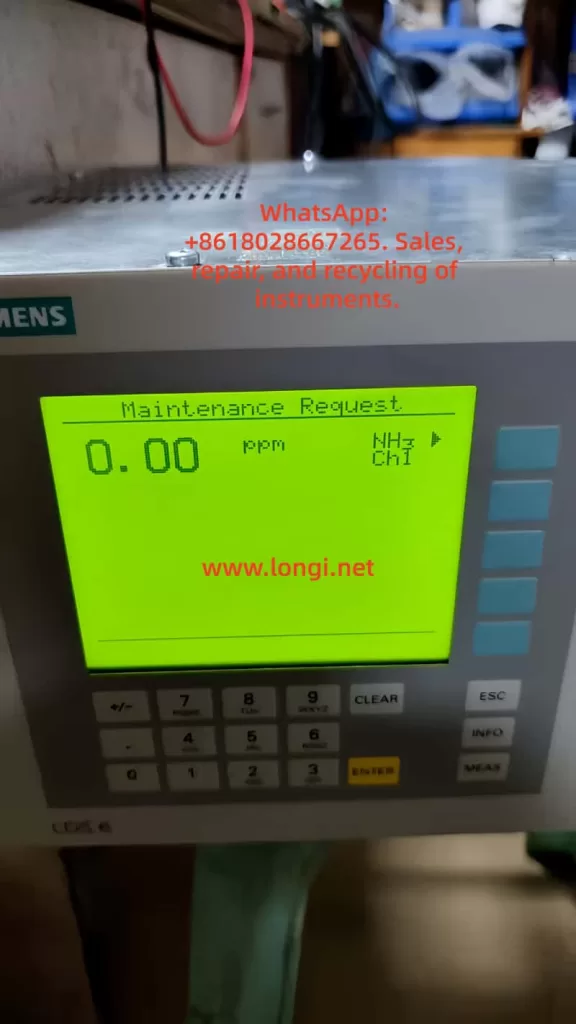
- The status line may switch repeatedly among FAULT, Maintenance Request, CTRL, TR, and related states.
- The main screen may sometimes show 0.00 ppm, sometimes dashes, and sometimes a value that appears to remain active.
- The logbook may contain Transmission Limit alarms, Optomodule Fault messages, and temperature-compensation-related maintenance requests.
Once these symptoms overlap, it becomes very tempting to blame the main board, interface board, laser driver board, EEPROM, FPGA, or other complex hardware. In reality, contaminated optical components are among the most common ways to create exactly this kind of “it looks like the boards are bad” situation.
2. Why the fault initially looked like a board problem but actually pointed to the optical path
The initial field description claimed that under “normal absolute and relative transmission conditions,” the analyzer displayed a value that was too high. According to the manufacturer’s troubleshooting logic, once the fiber or optical path is disconnected, the analyzer should show no signal, a signal abnormality alarm, an overrange state, or zero. But in the field, the operator reported that the reading remained even after fiber disconnection. Based on that behavior, the instrument itself was suspected, followed by suspicion of the signal acquisition and computation board, or alternatively that the display value was locked and the analog output was being forced.
If one reads only that description, it is easy to move directly toward electronic boards or output logic. “The reading remains after disconnection,” “the value does not drop,” and “the concentration is too high” all sound like frozen acquisition data, display cache retention, or forced output.
However, once the investigation progressed, inconsistencies began to appear.
On one hand, after the unit arrived for repair and was powered without the complete field optical setup, the Diagnostics page showed extremely low Absolute Transmission and Relative Transmission, indicating almost no effective optical signal.
On the other hand, the customer later provided a historical field photo showing a very different condition: Absolute Transmission was high, and Relative Transmission had climbed all the way to 999.0%. This meant the analyzer had not always been in a simple “no light” state. At some earlier point, it had displayed a different kind of fault: one in which the transmission diagnostics had clearly run away or saturated.
These two conditions appear contradictory at first glance, but in fact they point to the same fundamental issue: the optical path condition was unstable, and optical coupling had already been severely disturbed by contamination or abnormal reflection.
When contamination is still moderate, the analyzer may continue to receive part of the signal, but the proportional relationship between reference and measurement channels becomes distorted. As a result, Relative Transmission may surge, saturate, or become physically unreasonable.
When contamination worsens further, optical coupling deteriorates rapidly, and the system approaches signal collapse. Then both Absolute and Relative Transmission may fall toward zero.
This explains why the same analyzer can show two apparently opposite failure modes over time: one that looks like a runaway diagnostic condition, and another that looks like complete optical loss.
3. Why “the reading remains after the fiber is disconnected” does not automatically mean board failure
This was one of the most misleading aspects of the case.
Many maintenance technicians are accustomed to treating “the input is gone but the reading remains” as direct evidence that an acquisition board is bad, a cache is not cleared, or software has frozen. On ordinary analog instruments, that reasoning can sometimes be valid. On an LDS 6, however, the word “reading” must first be broken into categories:
- The concentration value on the main display.
- The diagnostic values such as Absolute Transmission and Relative Transmission.
- The analog output signal transmitted to PLC or DCS.
- A retained or filtered engineering value shown in the upper control system.
When field personnel say “the reading remains,” they are often not referring to the LCD main value at all. They may be referring to a DCS value that did not immediately drop, or a trend value that remained on the upper-level system. In a complex analyzer, this can be related to output hold strategy, fault delay behavior, function control logic, or simply the fact that the disconnected element was not the decisive optical path segment.
The most important point is that the unit received for repair was not a complete field system. It was primarily the central unit. Once the central unit is separated from the field sensor, hybrid cable, and actual measurement path, many assumptions that are valid in the field are no longer valid on the repair bench. In other words, what the customer observed in the complete field configuration and what the technician observed from a stand-alone central unit are not the same test condition.
Therefore, such statements are useful clues, but they cannot be treated as direct proof of board failure.
4. Why Diagnostics must be checked before assuming a hardware board defect
For a laser gas analyzer like the LDS 6, the most valuable page is usually not the main menu but the Diagnostics Values page. The concentration displayed on the home screen is already the final result of an algorithm. Diagnostics is much closer to the underlying physical state.
In this case, the parameters that actually clarified the direction were:
- Absolute Transmission
- Relative Transmission
- Temperature
- Pressure
- Measuring Path
The two transmission values were the most important. The reason is straightforward: if the laser chain, reference chain, receiver chain, and field optical path are healthy, transmission should not collapse toward zero, nor should Relative Transmission rush to 999.0% and remain there. Once these values become either extremely low or obviously saturated, troubleshooting should return immediately to the optical path rather than diving straight into main boards and menu parameters.
In this case, later comparison with a donor unit under no external optical connection also showed low transmission on both units. This reinforced an important point: when no external optical path is connected, low transmission can be physically reasonable and cannot by itself be used as a fault verdict.
What actually has diagnostic value is not a single number, but the broader behavior:
- Under identical no-light conditions, which unit is more stable?
- Does the unit repeatedly switch among FAULT, Maintenance Request, CTRL, and TR states?
- Does Diagnostics behave in a significantly more abnormal way under identical conditions?
- After cleaning the optical path, do the transmission values return to a more realistic condition?
This is why the breakthrough ultimately did not come from board replacement, but from cleaning the optical interfaces.
5. Why optical contamination can create such complex fault behavior
Many people underestimate how destructive contamination can be in a laser gas analyzer.
In ordinary electronic equipment, dirt may simply affect cooling or appearance. In an in-situ laser analyzer, even light contamination can alter spot quality, incident angle, reflection characteristics, and optical coupling efficiency.
Typical contamination points include:
- Fiber connector end faces.
- External optical windows.
- Lens surfaces on transmitter or receiver optics.
- Internal optical coupling or collimation interfaces.
- Long-term deposits such as dust films, process residue, oily contamination, or condensate.
Once contamination occurs at these locations, several kinds of changes can follow.
5.1 Optical power attenuation
The most direct result is a reduction in received signal strength, causing Absolute Transmission to fall.
5.2 Spot distortion and increased scattering
Contamination does not always simply “block light.” It can distort the beam shape and alter the optical path, causing the ratio between reference and measurement channels to become unreliable. Relative Transmission may therefore surge abnormally or saturate.
5.3 Unstable coupling efficiency
Connector contamination is often not a fixed attenuation but an unstable coupling problem. The signal may improve and worsen unpredictably. This causes the analyzer to switch among normal, maintenance request, and fault states, making the problem look like software instability.
5.4 Triggering of upper-level diagnostic logic
The analyzer only knows that the underlying optical conditions are not acceptable. It may not immediately distinguish whether the cause is a dirty lens, contaminated connector, degraded coupling, or board damage. Therefore, it may switch among Transmission Limit, Optomodule Fault, Maintenance Request, and related states.
This fully explains why the same instrument in this case could show one phase with transmission collapse, another phase with runaway transmission values, and a repeating sequence of status changes. All of these can originate from the same class of optical contamination problem.
6. Why the donor unit comparison helped, but did not replace root cause analysis
A donor central unit was also introduced during troubleshooting. At first, the idea was to determine which analyzer was “good” and which was “bad” by comparing their displayed values. However, the analysis gradually revealed something more important:
- A donor unit cannot be judged healthy solely because its transmission value is low under no external optical path; low transmission can be normal in that condition.
- The donor unit becomes useful mainly as a comparative reference under identical no-light conditions.
- If the donor unit remains stable while the customer unit repeatedly enters FAULT or Maintenance Request states, then the customer unit clearly has additional instability.
- But even if the donor unit appears more stable, this does not eliminate the need to inspect the customer unit’s optical path for contamination.
In the end, the donor unit served mainly as a comparative tool. It helped establish a critical boundary condition: low transmission under no external optical path must not automatically be interpreted as a fault. That insight was essential in preventing a wrong conclusion.
7. The turning point: from “prepare to replace boards” to “cleaning restores normal operation”
The decisive turning point in this case was not complicated, but it was highly representative. After extensive menu analysis, board identification, donor comparison, and video-based state analysis, attention returned to the most fundamental part of the system: the optical path.
The actual findings were straightforward:
- Fiber connectors were contaminated.
- Lenses or related optical surfaces were dirty.
- After cleaning, the analyzer returned to normal.
This means that all of the earlier symptoms that looked so much like board problems were simply the system-level consequences of an optical chain disturbance.
This conclusion is extremely valuable for maintenance practice because it suggests a revised troubleshooting priority:
When an LDS 6 shows abnormal readings, state switching, or distorted transmission values, optical cleaning and interface inspection should be placed ahead of blind board substitution.
8. A practical standard troubleshooting sequence for this type of fault
Based on this case, a more reliable troubleshooting order for an LDS 6 can be summarized.
Step 1: Define the test condition clearly
First determine:
- Is this a complete field system fault, or only a central unit on the bench?
- Is the external sensor connected?
- Is the actual field optical path complete?
- Does the customer’s “reading” refer to the local display, Diagnostics, or PLC/DCS engineering value?
If this is not clarified first, all later interpretation becomes mixed and unreliable.
Step 2: Check Diagnostics before assuming board failure
Focus on:
- Absolute Transmission
- Relative Transmission
- Whether they are near zero
- Whether they are abnormally high or saturated
- Whether the values are physically consistent with the actual setup
Low transmission is not automatically a fault. Relative Transmission at 999.0% is certainly not normal.
Step 3: Observe state behavior
State stability often matters more than one isolated numeric value. If the analyzer repeatedly jumps among FAULT, Maintenance Request, CTRL, TR, and related states under unchanged conditions, an underlying instability exists.
Step 4: Inspect and clean the optical path first
This should include:
- Fiber connector end-face cleaning
- Lens and window cleaning
- Optical coupling surface inspection
- Checking for dust, residue, oily films, or process deposits
- Rechecking Diagnostics after cleaning
Step 5: Consider board comparison and donor substitution only after optical cleaning
Only after optical path cleanliness has been confirmed should board substitution become a meaningful next step. Otherwise, a healthy donor board may be inserted into a contaminated optical system, leading to further misinterpretation.
9. How to explain the result to the customer professionally
Customer communication in this kind of case also matters. Many customers become convinced very early that “the main board is bad” or “the program is corrupted.” If the final explanation is too casual, such as “it was just dirty,” they may underestimate the difficulty of the work.
A proper explanation should be framed like this:
- The fault belongs to the optical chain category, not merely a parameter issue.
- Contamination of the fiber connector, lens, or related optical interface caused abnormal optical coupling, distorted transmission diagnostics, status alarms, and measurement abnormalities.
- This type of fault can easily imitate board-related symptoms and requires combined analysis of Diagnostics, state behavior, and optical inspection.
- After cleaning, the system returned to normal, which shows that the main board was not fundamentally damaged.
This wording remains technically accurate while properly reflecting the value of the diagnostic work.
10. Conclusion: for a laser analyzer, always return first to the light itself
The most important lesson from this case is not the exact name of a board, nor whether a donor unit should have been purchased. The most important lesson is a basic maintenance principle:
When troubleshooting a laser analyzer, think about the optical path before thinking about the board.
When an instrument shows:
- excessively high readings,
- abnormal behavior after disconnection,
- distorted diagnostic values,
- repeated fault switching,
- transmission values that sometimes collapse and sometimes run away,
none of these symptoms automatically prove failure of the main board, acquisition board, or output board.
In many cases, the real cause is simply contamination at fiber connector end faces, dirty lenses, contaminated windows, or degraded optical coupling.
Once a technician forgets that the device is fundamentally a laser optical analyzer and starts treating it like an ordinary electronic instrument, the diagnostic path quickly moves away from the real cause.
In this case, the investigation began with suspicion of board failure. It then progressed through menu analysis, state comparison, donor-unit testing, and behavior comparison before finally returning to the optical path itself. Cleaning restored normal operation. That sequence proves something highly important:
The most complex fault symptoms may originate from the simplest optical contamination.
For third-party maintenance specialists, the true value of this case is not merely that “cleaning fixed it.” The true value lies in establishing a more reliable diagnostic logic:
define the test condition first,
check Diagnostics next,
evaluate state stability,
prioritize optical path inspection and cleaning,
and only then proceed to board substitution.
That is the diagnostic discipline required to troubleshoot an LDS 6 effectively, minimize wrong turns, and produce repair conclusions that withstand technical scrutiny.