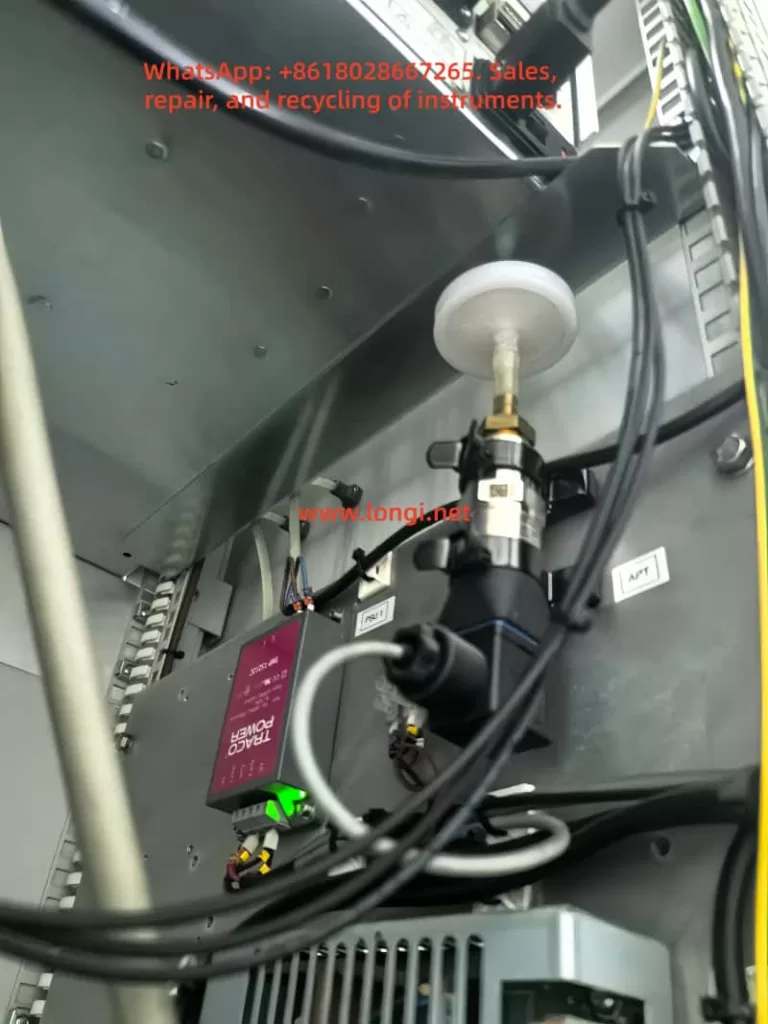
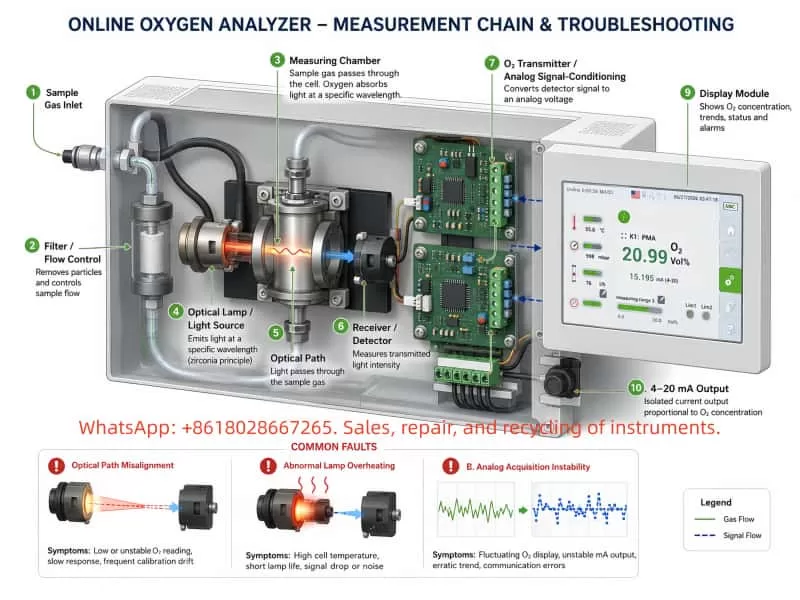
Online oxygen analyzers are widely used in flue gas monitoring, industrial furnaces, inert-gas protection systems, chemical processes, combustion control, gas blending, environmental monitoring, and laboratory applications. Compared with portable oxygen meters, an online analyzer is usually a multi-module system consisting of a sample gas path, flow-control section, measuring chamber, optical source or sensing element, signal-conditioning circuit, analog acquisition module, display controller, alarm circuit, and 4–20 mA output stage.
When an analyzer begins to show incorrect oxygen concentration, users often suspect sensor aging, chamber contamination, or calibration drift. In many cases, operators attempt to correct the issue by adjusting zero, span, or internal parameters. However, for analyzers incorporating an optical source, measuring chamber, optical receiver, analog conditioning circuitry, and signal-acquisition electronics, calibration alone may only temporarily correct the displayed value. It may not resolve deeper problems such as optical reference drift, excessive optical-source heating, optical-path misalignment, or unstable analog acquisition.
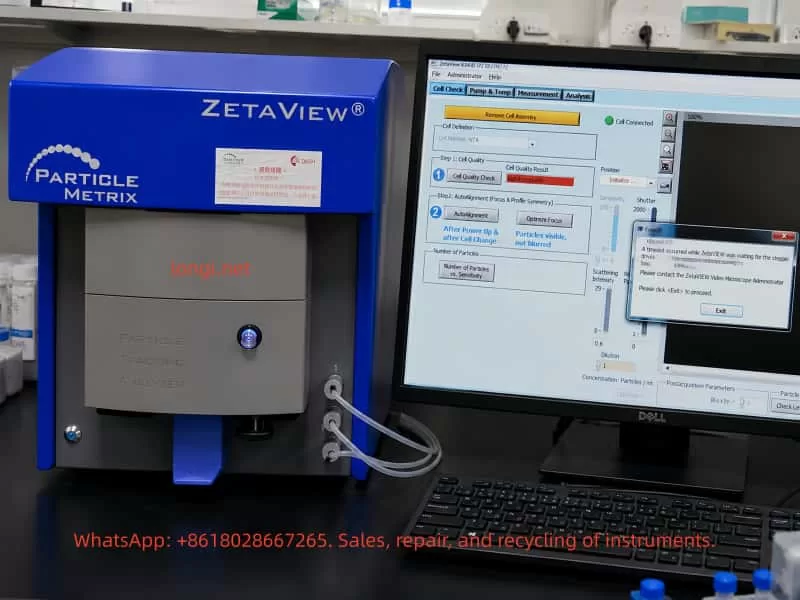
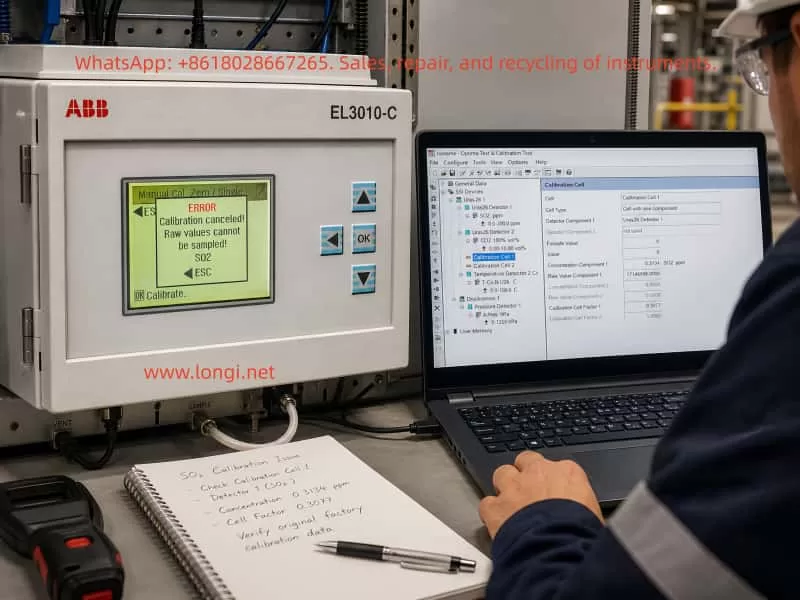
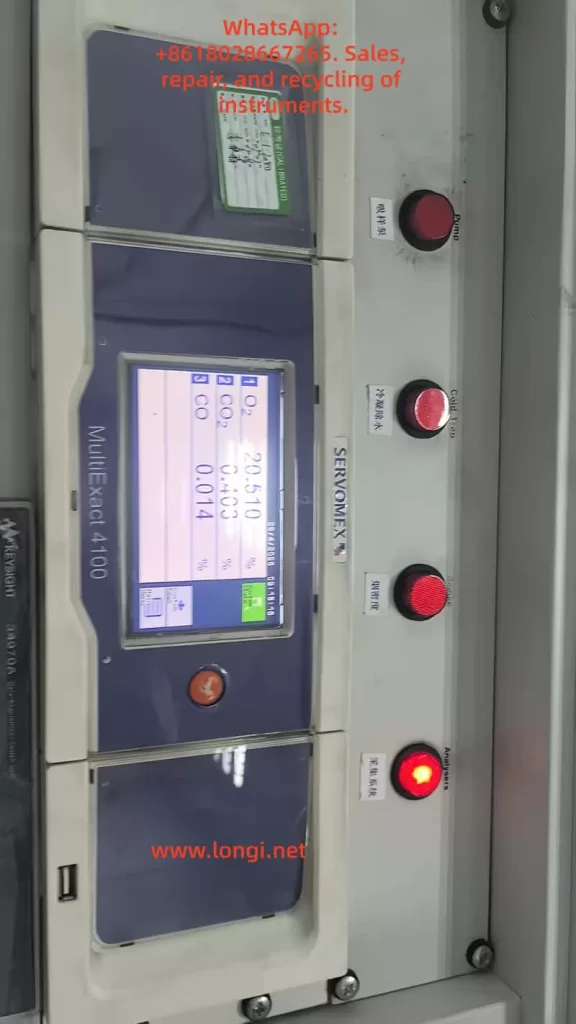
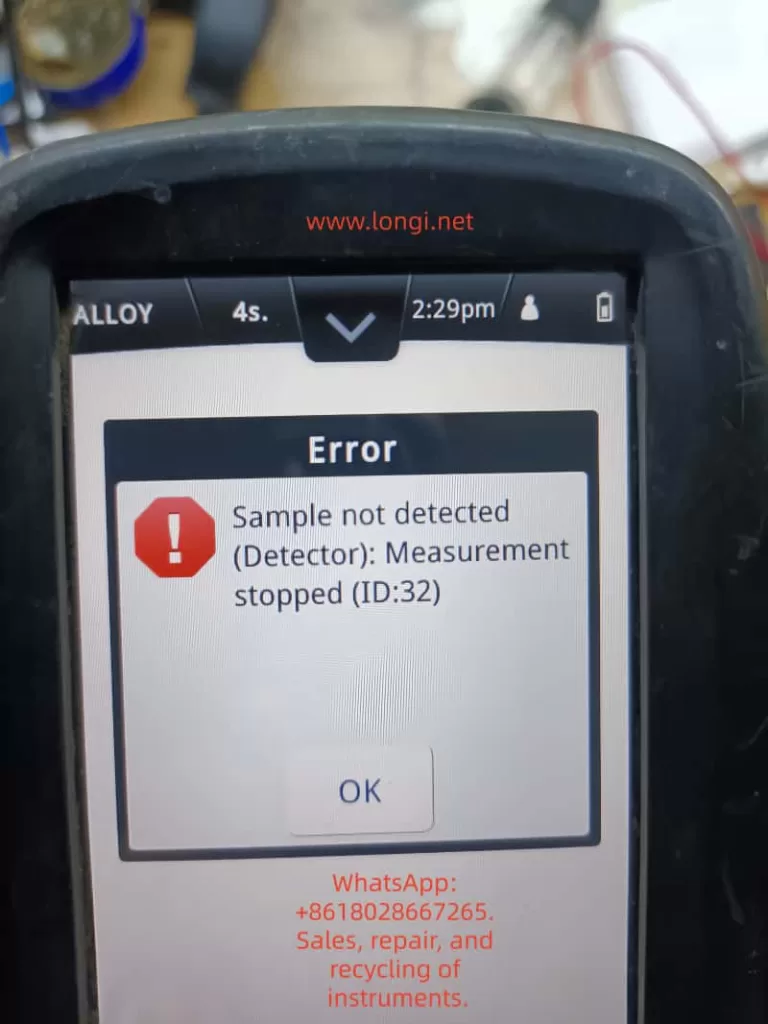
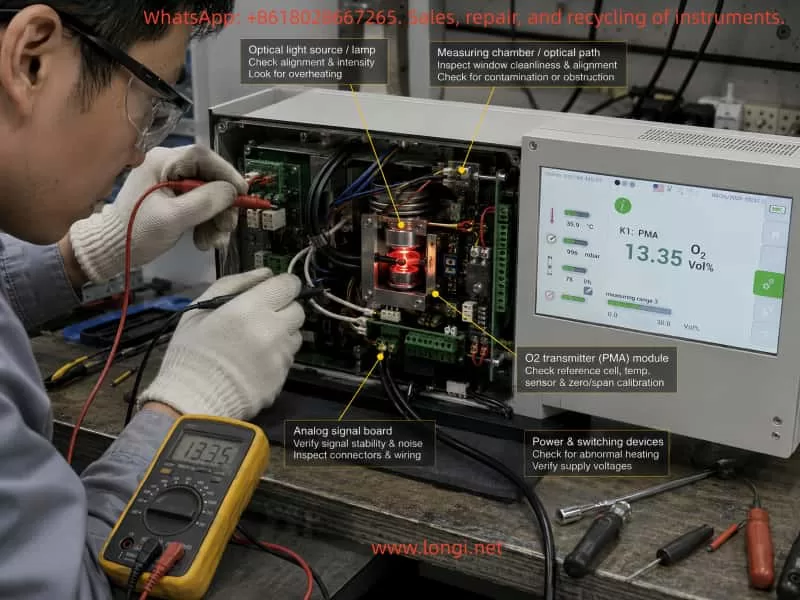
This article examines a representative troubleshooting case involving an online oxygen analyzer with abnormal oxygen readings, an overheating optical lamp assembly, intermittent analog signal loss, and a condition in which the displayed oxygen value could be adjusted close to 20.99% O₂ by changing the lamp position. The purpose is to provide a systematic diagnostic framework for third-party maintenance engineers and technical personnel.
1. A Displayed Oxygen Value Does Not Prove That the Measurement System Is Healthy
One of the most common misunderstandings in analyzer troubleshooting is assuming that the instrument is functioning normally simply because it powers on, displays an oxygen value, and has a normal sample flow.
In reality, the displayed oxygen concentration is the final result of a multi-stage measurement chain. If any part of that chain drifts, weakens, becomes contaminated, or loses electrical stability, the analyzer may still display a seemingly reasonable value even though the actual oxygen measurement is incorrect.
A typical measurement chain can be summarized as follows:
Sample Gas
↓
Sampling Line and Filter System
↓
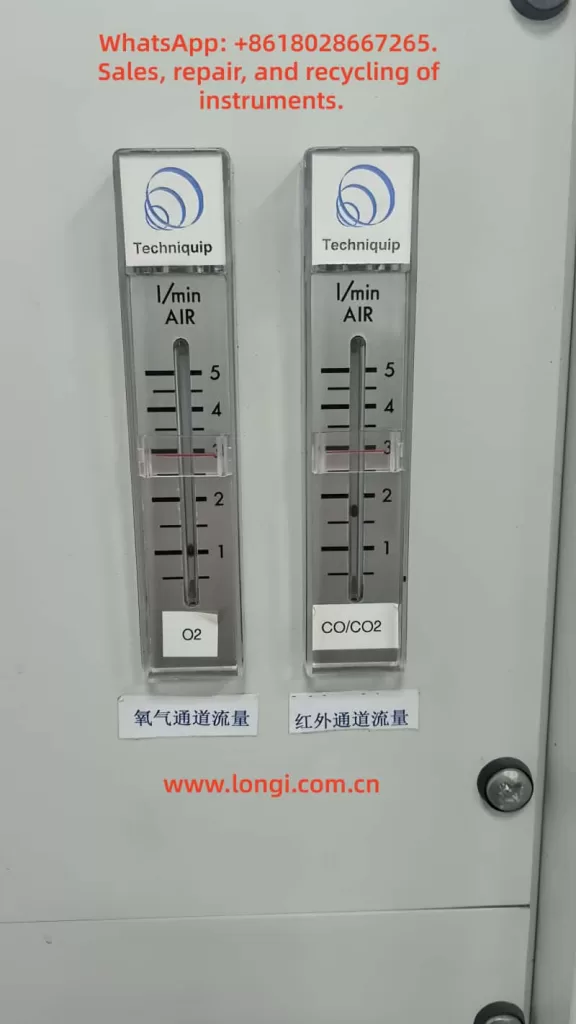
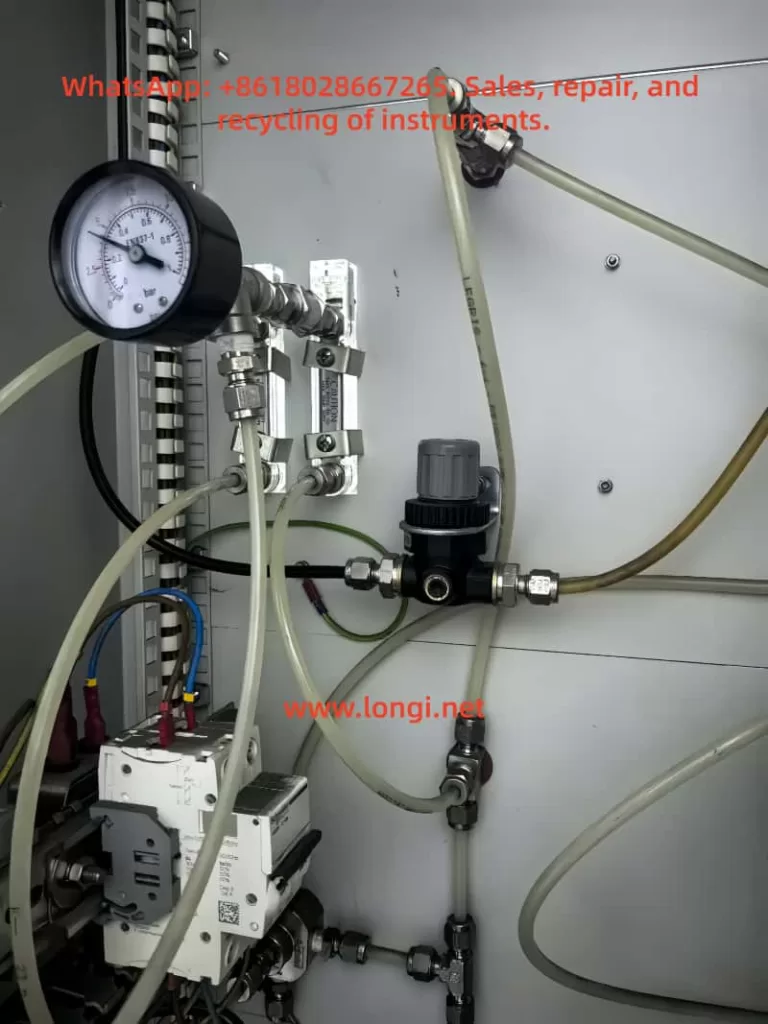
Flow Control and Pressure Stabilization
↓
Measuring Chamber
↓
Optical Source / Sensing Element / Receiver
↓
Analog Signal Conditioning
↓
A/D Conversion and Controller Processing
↓
Display, Alarm, and 4–20 mA Output
Any fault within this chain can create measurement errors. Typical examples include:
- Air leakage into the sample gas line;
- Plugged filters reducing actual sample flow;
- Moisture or condensate entering the chamber;
- Oil mist or dust contamination on optical windows;
- Optical lamp aging or reduced brightness;
- Optical source position shift;
- Receiver sensitivity reduction;
- Analog amplifier offset drift;
- Reference-voltage instability;
- A/D conversion errors;
- Connector oxidation or intermittent contact;
- Analog-output failure;
- Incorrect parameter compensation masking hardware faults.
Therefore, an engineer should never evaluate an oxygen analyzer only by looking at the final number on the display. The correct question is:
How is that number being generated, and are all physical and electrical stages producing valid information?
2. Persistent Low or High Oxygen Readings Should Not Immediately Be Attributed to Chamber Contamination
Measuring-chamber contamination is indeed one of the most common causes of online analyzer errors. In flue gas, chemical off-gas, oil mist, dusty gas streams, humid gas, or corrosive process environments, the internal gas path can become contaminated by:
- Fine dust deposits;
- Condensed moisture;
- Oil film;
- Hydrocarbon residue;
- Acidic compounds;
- Salt crystals;
- Optical-window contamination;
- Internal flow-path deposits;
- Restricted flow channels;
- Filter blockage.
These conditions can cause slow response, zero drift, span deviation, poor repeatability, nonlinear response, or unstable oxygen readings.
However, chamber contamination should not become the default explanation for every oxygen-measurement problem.
If the analyzer also shows any of the following conditions, the problem is likely more complex than simple chamber contamination:
- The optical lamp or glass source becomes abnormally hot;
- Lamp brightness appears unusually strong or unstable;
- A power transistor or switching device overheats severely;
- Analog output cannot be read intermittently;
- Internal analog acquisition becomes unavailable;
- Disconnecting a cable causes the display to fall to zero;
- Reconnecting a cable restores the reading but with offset;
- Moving the lamp position significantly changes the oxygen reading;
- Mechanical adjustment of lamp distance can force the display close to 20.99% O₂.
These symptoms indicate that the fault may involve the optical measurement system, lamp-driving circuit, analog conditioning stage, or A/D acquisition path.
3. The Optical Source Is a Measurement Reference, Not Merely a Lamp
In analyzers using an optical source, optical chamber, receiver, and signal-processing circuit, the lamp is not simply an illumination device. It is part of the measurement reference system.
Depending on the analyzer design, the source may be a miniature lamp, infrared emitter, heated optical element, or special light-emitting component. Regardless of design, its function is to provide stable optical energy to the measurement chamber. The receiver then evaluates light intensity, absorption changes, spectral behavior, or optical-path variation to determine the gas concentration.
For correct operation, the optical source must satisfy several conditions:
- Stable light output;
- Stable operating position;
- Correct optical direction;
- Accurate alignment with the receiving area;
- Proper electrical drive current;
- Controlled operating temperature;
- Fixed geometric relationship to the chamber and receiver;
- No movement due to vibration, thermal expansion, loose mounting, or previous maintenance work.
Even a small mechanical shift in lamp distance, angle, height, or centering can alter the received optical signal.
For example:
- Increasing lamp-to-receiver distance may reduce received light intensity;
- Moving the lamp off-axis may reduce effective light transmission;
- Changing lamp height may shift the light spot away from the receiver window;
- Changing lamp angle may alter reflection and refraction characteristics;
- A loose mounting bracket may create unstable readings during vibration.
Therefore, if moving the optical lamp causes a major oxygen-reading change, the lamp position and optical alignment are directly influencing the measurement.
This is an important diagnostic finding, but it does not automatically mean the analyzer is fully repaired.
4. Why Adjusting the Reading to 20.99% O₂ Does Not Automatically Mean the Analyzer Is Fully Repaired
The oxygen concentration in clean ambient air is approximately 20.9%. Therefore, when an analyzer displays around 20.99% O₂ while sampling air, it may appear to have returned to normal operation.
However, from an engineering and measurement perspective, this only proves that:
At the current lamp position, current temperature, current gas flow, and current environmental condition, one measurement point is close to the expected value.
It does not prove that the entire analyzer has been restored to specification.
The following conditions may still be incorrect:
- Zero-point accuracy;
- Span-point accuracy;
- Mid-range linearity;
- Lamp alignment relative to design center;
- Lamp current and electrical drive condition;
- Lamp thermal stability;
- Receiver sensitivity;
- Analog signal stability;
- 4–20 mA output accuracy;
- Long-term drift behavior;
- Temperature influence;
- Flow-rate influence;
- Pressure influence;
- Repeatability after restart.
For example, an analyzer may display 20.99% O₂ in air but still display 1.5% O₂ when exposed to nitrogen or 90% O₂ when exposed to a high-oxygen calibration gas. In such a situation, the air point appears correct while the zero point, span point, or linearity remains defective.
Therefore:
Adjusting the air point to approximately 20.99% O₂ is a positive indication that the optical path can still generate usable signal, but it is not a replacement for complete calibration and stability verification.
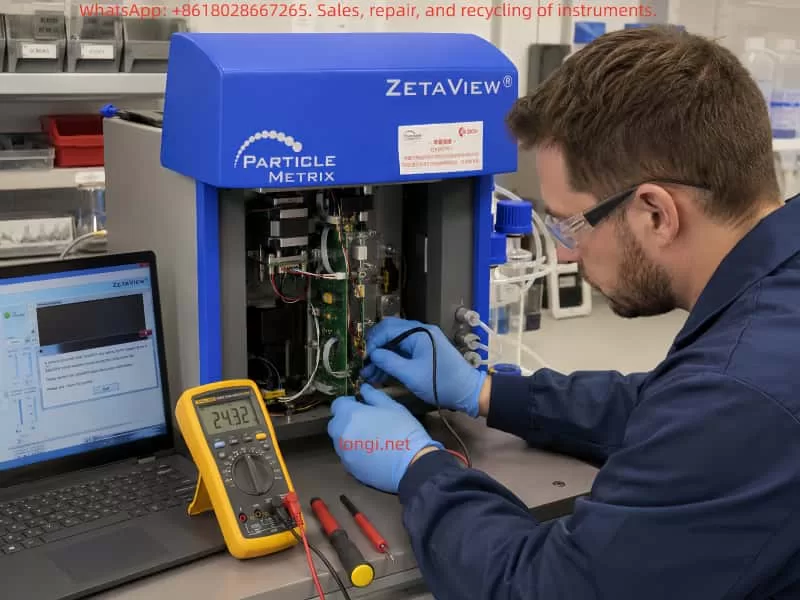
5. Diagnostic Significance of Optical Source Heating and Power Transistor Overheating
If the glass lamp, optical source, nearby metal fixture, or lamp-driving transistor becomes noticeably hot, the condition must be evaluated carefully.
Some lamp temperature rise may be normal. However, there is a major difference between normal operating temperature and abnormal overheating.
Normal operating behavior may include:
- Gradual warm-up after power-on;
- Stable light intensity after warm-up;
- Controlled temperature rise;
- No continuous brightness increase;
- Manageable temperature on the driving device;
- No smell of overheating;
- No discoloration of wiring or plastic;
- Stable oxygen reading;
- Stable analog output.
Abnormal overheating may include:
- Lamp brightness gradually increasing without stabilization;
- Temperature continuing to rise;
- Power transistor becoming too hot to touch quickly;
- Strong heat around the glass lamp;
- Oxygen reading drifting with temperature;
- Analog output becoming unstable;
- Reading changing significantly when the lamp is moved;
- Measurement returning to zero or becoming implausible;
- Burnt smell or thermal discoloration;
- Output instability after several minutes of operation.
When a power transistor overheats, it may be operating under one or more abnormal conditions:
- Excessive lamp current;
- Continuous full-duty operation;
- Incorrect PWM duty cycle;
- Incomplete transistor switching;
- Linear-region operation with high power dissipation;
- Optical lamp load abnormality;
- Current-limiting circuit failure;
- Current-sense resistor drift;
- Lamp resistance change due to aging;
- Drive voltage too high;
- Faulty solder joints;
- Degraded capacitors or gate-drive components;
- Inadequate heatsinking.
For this reason, any analyzer with a visibly overheating lamp and hot switching transistor should not be left powered for long periods during troubleshooting. Continued operation may damage the lamp, power transistor, PCB traces, connectors, wiring insulation, or surrounding plastic components.
6. Avoid Misidentifying the Optical Lamp as a Temperature Sensor
Inside industrial analyzers, many components are black, glass-sealed, mounted under metal clamps, or connected with two wires. Such parts can easily be mistaken for thermistors, temperature probes, thermal cutoffs, optical sensors, or heating elements.
In optical analyzers, however, a glass-bodied component may simply be the optical lamp.
A lamp and a temperature sensor can appear physically similar, but their behavior is different.
| Feature | Optical Lamp / Light Source | NTC/PTC Temperature Sensor |
|---|---|---|
| Emits visible light when powered | Often yes | Normally no |
| Generates significant heat | Often yes | Usually minimal |
| Driven by power transistor | Common | Usually not directly |
| Affects optical signal directly | Yes | Normally indirect |
| Reading changes when position is moved | Yes | Usually no |
| Requires optical alignment | Yes | No |
| May contain visible filament or glowing area | Often | Normally not |
If moving the component changes oxygen readings significantly, it is much more likely to be part of the optical source or optical path than a simple temperature-measurement device.
This distinction is important because an incorrect assumption may send troubleshooting in the wrong direction. A glowing lamp should not be treated as a failed thermistor merely because it becomes hot.
7. Why Analog Signal Acquisition Faults Can Make an Analyzer Look Normal While Remaining Unreliable
Many online oxygen analyzers do not display raw sensor output directly. Instead, the signal passes through several analog and digital stages before appearing on the screen.
A simplified signal path may look like this:
Optical Receiver Signal
   ↓
Pre-Amplifier
   ↓
Filtering and Offset Conditioning
   ↓
Reference Comparison
   ↓
A/D Conversion
   ↓
Microcontroller Calculation
   ↓
Display Value
   ↓
4–20 mA Output
If any stage in this signal chain becomes unstable, the analyzer may display an incorrect value even while the optical system remains functional.
Typical analog-chain problems include:
- Operational-amplifier offset drift;
- Precision-resistor value change;
- Reference-voltage instability;
- Connector oxidation;
- Broken solder joints;
- Weak analog ground;
- A/D input-channel fault;
- Leaky filter capacitors;
- Reduced photodetector output;
- Gain change in amplifier stages;
- Faulty analog isolator;
- Internal 4–20 mA output failure;
- Electrical interference entering weak signal lines.
When the analyzer has previously shown symptoms such as “analog signal unreadable,” “output temporarily missing,” “display returns to zero after a connector is removed,” or “reading restores after reconnection,” the following areas should be inspected carefully:
- Sensor-to-transmitter connectors;
- Signal-conditioning board supply rails;
- Analog ground and reference ground;
- Optical receiver output;
- Amplifier input and output stages;
- A/D converter input;
- 4–20 mA output module;
- Connector pins and solder joints;
- Cable strain-relief points;
- Isolation circuits and internal relays.
Such faults are dangerous because the analyzer may appear normal under one condition but drift again when temperature changes, vibration occurs, power fluctuates, or a connector moves slightly.
8. Optical Path Errors and Analog Acquisition Errors Are Often Coupled
In many analyzers, optical faults and analog signal faults are not independent.
For example, if the lamp moves away from its intended optical position, the receiver receives less light. The analog amplifier may then amplify a weaker signal more aggressively. The display may still show a reasonable oxygen value, but the signal-to-noise ratio becomes poor.
Under these conditions, the analyzer may become sensitive to:
- Vibration;
- Temperature variation;
- Lamp movement;
- Power-supply ripple;
- Flow-rate changes;
- Connector contact resistance;
- Electromagnetic interference;
- Warm-up time;
- Internal mechanical stress.
Typical field behavior may include:
- Calibration appears successful but does not remain stable;
- Reading changes after warm-up;
- Oxygen display fluctuates after vibration;
- 4–20 mA output differs from displayed value;
- Small lamp movement causes large oxygen changes;
- A stable reading is only achieved at a very specific lamp position;
- Restarting the analyzer temporarily changes performance;
- Analog signal becomes weak or unavailable intermittently.
Therefore, adjusting the lamp position alone may produce a correct reading at one point but does not address the underlying electrical stability of the analog measurement chain.
Likewise, repairing only the analog board without restoring correct lamp alignment may leave the optical measurement reference unstable.
A reliable repair requires both the optical and electronic measurement chains to be restored.
9. Recommended Diagnostic Sequence: Confirm the Physical Measurement Chain Before Adjusting Parameters
For an online oxygen analyzer showing inaccurate readings, the following diagnostic sequence is recommended.
Step 1: Verify Basic Operating Conditions
Check:
- Supply voltage stability;
- Grounding quality;
- Sample flow rate;
- Sample pressure;
- Gas dryness;
- Filter condition;
- Condensate presence;
- Sampling-line leakage;
- Air ingress;
- Measuring-chamber contamination.
This step eliminates external gas-path problems.
Step 2: Verify Optical Source Operation
Check:
- Whether the lamp turns on correctly;
- Whether brightness stabilizes after warm-up;
- Whether heating is excessive;
- Whether the lamp mount is loose;
- Whether lamp position is centered;
- Whether lamp distance has changed;
- Whether the lamp is tilted;
- Whether the glass body is darkened or aged;
- Whether lamp leads are oxidized;
- Whether the socket or clamp is loose;
- Whether supply voltage and lamp current are reasonable.
If moving the lamp slightly causes a large oxygen-reading change, inspect the lamp holder, mounting bracket, alignment guide, retaining clip, positioning slot, and mechanical reference surfaces.
Step 3: Inspect the Optical Path and Measuring Chamber
Check:
- Optical-window contamination;
- Oil film;
- Dust accumulation;
- Condensate;
- Oxidation on reflective surfaces;
- Receiver-window contamination;
- Obstruction in the optical path;
- Lamp-to-receiver alignment;
- Loose internal fasteners;
- Incorrect position after previous maintenance.
The purpose of this step is to restore optical transmission efficiency and mechanical alignment.
Step 4: Inspect the Power Driver and Heating Circuit
Check:
- Lamp supply voltage;
- Lamp operating current;
- Switching-transistor temperature;
- Heatsink condition;
- Transistor leakage or short circuit;
- PWM drive waveform if available;
- Current-sense resistor value;
- Current-limiting components;
- Electrolytic capacitor condition;
- Gate-drive components;
- PCB solder joints;
- Supply voltage level.
If the switching transistor becomes extremely hot, do not run the analyzer for long periods until the drive stage has been checked. Continued overheating may damage the lamp and PCB.
Step 5: Inspect Analog Acquisition and Signal Conditioning
Check:
- Signal-conditioning board supply rails;
- Sensor signal presence;
- Amplifier output stability;
- Reference voltage;
- Analog ground;
- Connector integrity;
- A/D sampling input;
- 4–20 mA output consistency;
- Signal behavior when lamp position changes;
- Signal behavior when connectors are moved.
The objective is to confirm that the physical optical signal is being converted and delivered correctly to the controller.
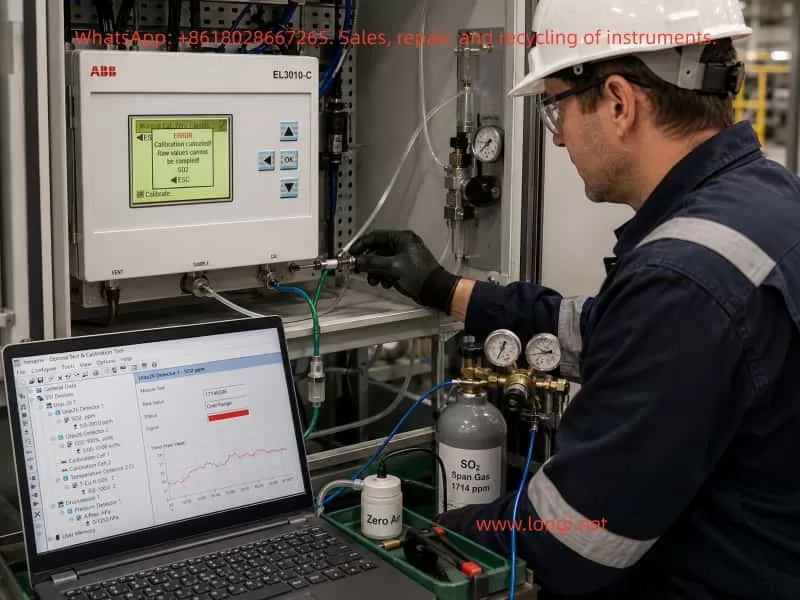
Step 6: Perform Calibration Only After Hardware Stability Is Confirmed
Once the optical source, optical path, power driver, measuring chamber, and analog acquisition chain are stable, perform zero and span calibration.
Recommended verification points include:
- Zero gas point;
- Ambient air point;
- Span-gas point;
- Intermediate concentration point;
- Long-term stability;
- 4–20 mA output accuracy;
- Alarm threshold behavior;
- Flow-rate sensitivity;
- Temperature sensitivity.
Adjusting parameters before restoring the hardware baseline may hide the real fault and make subsequent diagnosis more difficult.
10. Post-Repair Verification Must Include Stability, Not Only Instantaneous Accuracy
After repairing an online oxygen analyzer, the instrument should not be considered acceptable based only on one displayed value.
At minimum, the following verification steps are recommended.
1. Ambient Air Verification
With clean air applied, the analyzer should indicate approximately 20.9% O₂.
However, this is only one verification point.
2. Zero Verification
Apply suitable zero gas and confirm that the low-oxygen reading approaches the expected zero range without excessive residual value.
3. Span Verification
Apply a known oxygen calibration gas to verify span accuracy.
4. Linearity Verification
Use at least two different oxygen concentrations to check whether the analyzer responds proportionally across its intended range.
5. Long-Term Run Test
Operate the analyzer for at least 30 minutes, one hour, or longer while observing:
- Lamp temperature;
- Power-transistor temperature;
- Oxygen drift;
- Analog-output stability;
- Flow stability;
- Alarm behavior;
- Signal dropouts;
- Restart repeatability.
6. Analog Output Verification
Confirm that displayed oxygen value and 4–20 mA output correspond correctly. Verify the output at:
- Zero oxygen point;
- Ambient-air point;
- Full-scale point;
- Intermediate concentration point.
Only after all of these conditions are satisfied can the analyzer be considered stable for long-term operation.
11. Conclusion: Oxygen Measurement Errors Are Often System-Level Faults Rather Than Single-Component Problems
For online oxygen analyzers containing an optical source, measuring chamber, receiver, and analog signal-acquisition circuitry, inaccurate oxygen readings should not automatically be blamed on chamber contamination or calibration drift.
When the analyzer shows a combination of symptoms such as:
- Incorrect oxygen concentration;
- Abnormal lamp or glass-source heating;
- Severe heating of the power transistor;
- Oxygen reading affected by lamp position;
- Display returning close to 20.99% after optical adjustment;
- Intermittent analog signal loss;
- Display changes caused by connector status;
- Temporary recovery after parameter calibration;
- Risk of drift after warm-up,
the problem should be treated as a combined fault involving the optical measurement chain, lamp-driving system, and analog acquisition electronics.
The correct maintenance philosophy is not merely to adjust parameters or clean the measuring chamber. The analyzer should be examined sequentially through:
Gas path → optical source → optical path → power driver → analog acquisition → output circuit → calibration → stability verification.
Only when the optical source is mechanically stable, lamp heating is controlled, the receiver signal is sufficient, analog acquisition is stable, 4–20 mA output matches the display, zero and span are correct, and long-term drift remains within acceptable limits can the analyzer be considered fully restored for reliable industrial operation.