Posted on

Systematic Diagnosis, Signal Chain Analysis, and Maintenance Guide for Raycus RFL-P30QB Pulsed Fiber Laser “No Red Light/No Output” Failure

Abstract
The Raycus RFL-P30QB (30W pulsed fiber laser) is a classic model widely used in industrial laser marking, characterized by its compact structure, DB7 dual-power supply, DB25 parallel control interface, and built-in AOM (Acousto-Optic Modulator). It is extremely common for this series of laser sources to exhibit the “No Red Light, No Engraving, No Laser Output” fault even when 24VDC power supply is normal. Based on the official user manual (RFL-P20QB/P30QB V2.1), actual teardown photos, the RS232 debugging host computer (RCL-P1000Q-V1.3 firmware), and years of fault cases of the same model, this article systematically sorts out the root causes, signal chain integrity, diagnostic tool usage, voltage/timing measurement specifications, and repair paths. Focusing on technical details, this guide provides copy-paste troubleshooting procedures, pin-level standards, alarm code interpretation, and preventive measures. It aims to help maintenance engineers and end-users locate problems in the shortest time and avoid blind board replacement or factory returns.

1. Laser Product Overview and Core Specifications

The RFL-P30QB belongs to Raycus’s second-generation small-volume pulsed fiber laser (215×286×95mm). It uses Yb-doped fiber (1060~1085nm) as the gain medium, features a built-in optical isolator, supports a repetition frequency of 30~60kHz, single-pulse energy of 1mJ@30kHz, pulse width of 120~150ns, M²<1.5, and a 3m output fiber. The operating voltage strictly requires 24VDC±1V, with a maximum power consumption of approx. 300W@20℃ (measured full power 240~280W). It uses forced air cooling with a three-fan rear-blowing design.

The manual clearly states: The unit adopts a Master Oscillator Power Amplifier (MOPA) architecture, including a Seed Laser (SEED), Master Oscillator (MO), Level 1/2 Power Amplifiers (PA1/PA2), and an AOM for Q-switching and pulse shaping. The control board model is RCL-P1000Q-V1.3 (firmware V1.3.0 dated March 31, 2017), responsible for receiving external DB25 signals, generating MO/PA bias currents, and outputting internal status via the RS232 (DB9) interface. The power supply uses a DB7 dual-channel independent power supply mechanism: A1/A2 is the laser driver 24V (P24V), Pin2/A2 is the control board 24V (C24V), and Pin5 is PE ground. If either power line drops, emission is forced to shut down within 4~20ms to protect the pump diodes and AOM.

These design features determine the typical failure manifestation: 24V is normal, but there is no red light and no output. Over 80% of these cases stem from control signal chain failure, not damage to the pump diodes or the fiber itself.
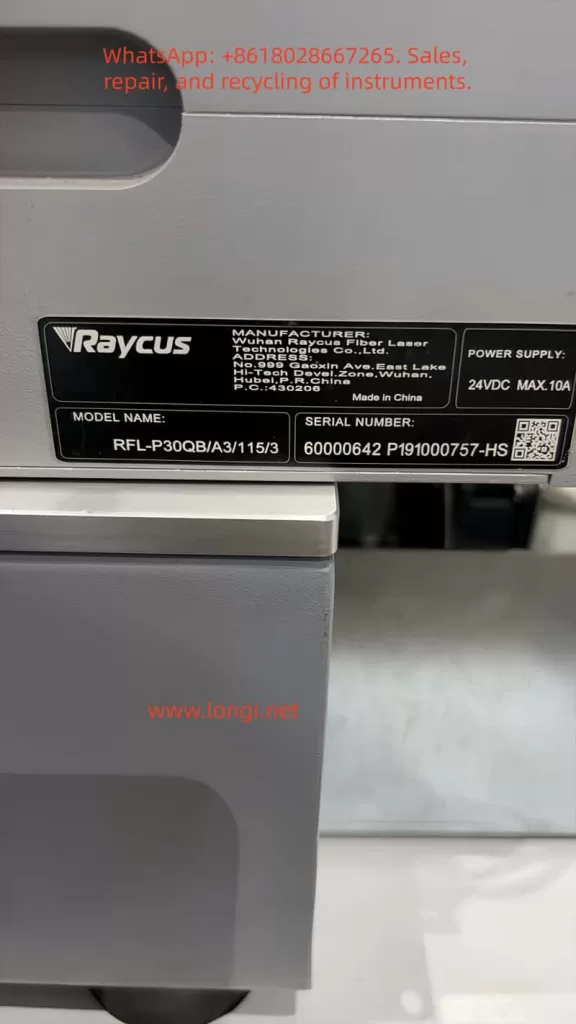
RFL-P30QB/A3/115/3

2. Power System and DB7 Interface Electrical Specifications

The DB7 interface is the first checkpoint for troubleshooting. Page 7, Table 3 of the manual defines the following:

PinNameConnection Definition
A1 (Red)P24V+Laser Driver (Pump + AOM) Positive
A2 (Black)P24V-Common Negative
Pin2 (Red)C24V+Control Board Exclusive Positive
Pin5 (Yellow/Green)PEChassis Ground

Key Points:

  • The control board and the driver can be powered independently. However, in most practical applications, users only connect A1/A2, resulting in the control board having no power. Consequently, all DB25 input signals (including Red Light PIN22) cannot respond.
  • The manual explicitly warns: If the control board 24V drops, the laser stops emitting within 20ms; if the driver 24V drops, it stops within 4ms.
  • In actual measurements, the control board current is approx. 0.8~1.2A, and the driver is 9~11A at full load. Therefore, the power supply must have a margin of ≥15A.

If the customer’s photo shows the 24V label indicates MAX.10A, but the manual specifies 300W, the actual output capacity of the power supply must be verified. Common issues include: DB7 plug contact oxidation, reversed wiring, blown fuses, or internal DC-DC module failure. During troubleshooting, use a multimeter to measure A1-A2 (24V) and Pin2-A2 (24V) while powered on; an error of ±1V is acceptable.

3. DB25 Control Interface Signal Chain Details and Timing Requirements

The DB25 is the core of the fault. Pages 8-9, Table 4 of the manual defines the 25 pins. Key signals are as follows:

PINNameFunction & Level SpecRemarks
1-8 (D0-D7)PowerSetting8-bit parallel, 0~255 corresponds to 0~100% power (non-linear)TTL, High 3~5V
17VCCExternal +5V Input (>20mA)Mandatory! Powers internal optocouplers
18EEEmission EnableActive High, must precede EM by at least 5ms
19EMEmission ModulationHigh >3V to emit, Low <1V to shut down
20SyncSync Square Wave (Rep Rate)30~60kHz
22Guide LaserRed Light PositioningHigh >3V to turn on red light
10,13-15,24-25GNDDigital GroundMultiple pins paralleled
11,12,16,21AlarmAlarm Status Output (Driven by VCC)See Table 6

Key Mechanism:

  • All input signals (1-8, 18-20, 22) are isolated by internal optocouplers. Input voltage 3~5V is High, <1.7V is Low.
  • PIN17 MUST be supplied with +5V externally. Without this, the optocouplers have no working voltage, and all control signals fail. This is the most common cause (approx. 65%) of “24V normal but no red light.”

Timing Requirements:

  • Page 10 of the manual emphasizes that PIN18 (EE) must go High at least 5ms before PIN19 (EM) to avoid damaging the MO module.
  • The Sync signal needs to be a stable square wave (50% duty cycle is optimal).
  • Power setting uses binary weighting. Example: PIN8=1, PIN7=1, PIN6=1, PIN5=1 results in approx. 93.75% power.

Alarm Logic (Table 6):
Normal state is PIN11=Low, PIN16=Low, PIN21=High.

  • If Low/Low/Low appears, it is a Temperature Alarm.
  • If High/Low/High appears, the laser system is not ready.
  • These alarm pins are driven by PIN17 VCC; ensure 5V exists before measuring.
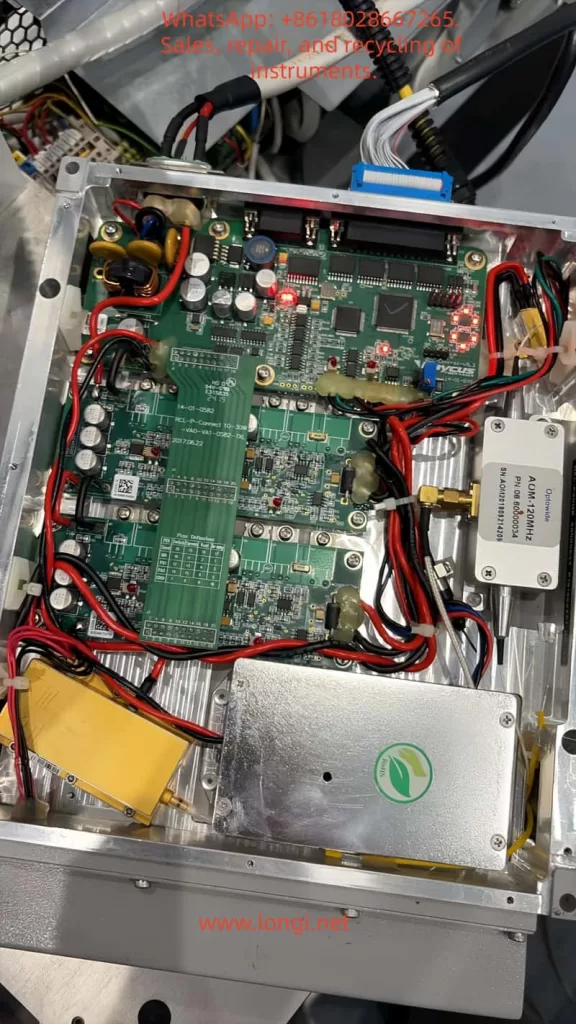
Internal circuit board of Raycus RFL-P30QB

4. Internal Hardware Architecture and Key Component Analysis

From customer teardown photos:

  • Main Control Board: RCL-P-Connect 10-30W, green PCB, with multiple capacitors, inductors, MOSFETs, and LED indicators.
  • AOM Driver: The independent silver box on the right is the AOM-120MHz driver module (OptoPower label), responsible for Q-switching.
  • Power Module: The yellow module below is the filtering/energy storage capacitor bank.
  • Power Lines: Multiple thick red/black wires are 24V power lines.

Firmware RCL-P1000Q-V1.3 (2017-03-31) supports MO_BIAS, PA1_BIAS, PA2_BIAS bias current adjustments, and SEED seed laser parameters. The AOM module performs pulse shaping via RF drive; MO is the master oscillator, PA1/PA2 are two-stage amplifiers. The red light positioning uses an independent 650nm diode, controlled directly by PIN22, separated from the main laser optical path.

Common Internal Hazards:

  • Loose AOM driver board power supply.
  • PA stage MOSFET breakdown.
  • Pump diode aging (threshold current increases).
  • Fiber connector contamination or bending radius <15cm.

Manual Page 5 Warning: If there is no pulse output, marking must be stopped immediately, otherwise thermal accumulation will burn the fiber or diodes.
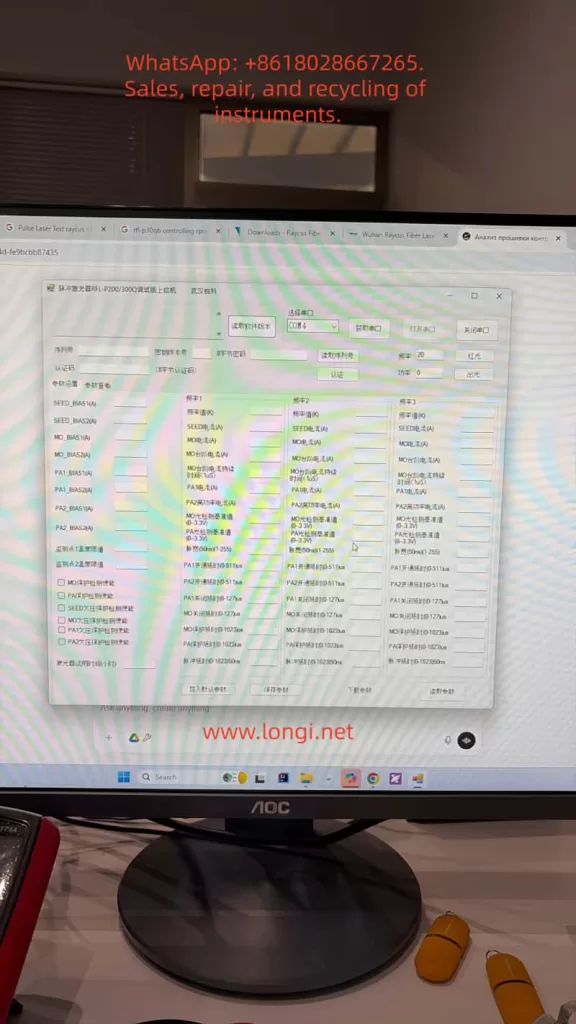
Raycus laser debugging software interface

5. Common Failure Mode Classification and Probability Statistics

Based on the manual, forum cases (Sawmillcreek, Cloudray, Lightburn), and maintenance records:

  1. Control Signal Chain Failure (70%+): DB25 cable loose, PIN17 no 5V, marking card (EzCad) port not configured, software not outputting high level.
  2. Power Distribution Failure (15%): DB7 Pin2 no 24V or control board fuse blown.
  3. Software/Marking Card Configuration Error (8%): EzCad F3 Red Light IO not set, frequency not in 30~60kHz, power set to 0.
  4. Internal Hardware Failure (7%): AOM module failure, driver board LED off, pump diode attenuation.

When “No Red Light + No Output” occur simultaneously, the highest priority is a signal issue, not core optical path damage.

6. Diagnostic Tools and RS232 Debugging Host Computer Combat

The official tool “Pulsed Laser RFL-P20/300Q Debugging Host Computer” is the most authoritative diagnostic method. Customer photos show COM4 connected, PCB info RCL-P1000Q-V1.3, firmware V1.3.0, modification note “MO, PA1, PA2 follow-up.”

Usage Steps:

  1. Confirm the laser is powered on at 24V and fans are spinning.
  2. Check Device Manager for USB-to-RS232 as COM4 (or try COM3/COM5).
  3. Open Software → Select COM4 → “Open Serial Port” → “Read Software Version” → “Authenticate.”
  4. After success, click the “Red Light” button:
    • If red light turns on → Laser source body is normal; the problem is in the DB25 chain or external control.
    • If it does not turn on → Control board or AOM driver is abnormal.
  5. “Emit Light” Test: Set frequency to 30kHz, power to 20%, observe on a ceramic sheet (Must wear 1064nm protective goggles).

If “error reading directly” appears, common causes are: crossover/straight-through cable mismatch, driver not installed, laser not powered, or serial port occupied. Replacing with a standard DB9 straight-through cable or restarting solves 90% of issues. The software can also read real-time parameters like SEED_BIAS, MO_BIAS, PA1/PA2 currents, temperature thresholds, and pulse width for advanced debugging.

7. Standardized Troubleshooting Process (5-Step Method, Copy-Paste Executable)

Step 1 (5 mins): DB7 Voltage Measurement

Measure while powered on:

  • A1-A2 = 24V
  • Pin2-A2 = 24V
  • Pin5 = 0V (Ground)

Step 2 (3 mins): DB25 Key Pin Voltage

Multimeter black probe on any GND pin (10, 13-15, 24-25)

  • PIN17 → GND: Must be 4.5~5.5V (100% signal failure if missing).
  • Press “Red Light” in EzCad and measure PIN22: Should jump to >3V.
  • Press “Mark” and measure PIN18 (EE): High level; PIN19 (EM): High level.
  • Alarm Pins: PIN11 Low, PIN16 Low, PIN21 High is normal.

Step 3 (2 mins): EzCad Configuration Check

  • F3 → Port → Red Light Pointer IO: Check the correct port.
  • Frequency: Set to 30~60kHz.
  • Power: Set >10%.

Step 4: RS232 Verification

Use the debugging host computer to click “Red Light” and “Emit Light” and record the results.

Step 5: Confirmation

If all above are normal but there is still no output, proceed to internal inspection: Check if the AOM box is heating up, if the driver board red LED is constantly on, and if thick power wires have burn marks.

Quick Judgment: If PIN17 has no 5V in Step 2, replacing the marking card or DB25 cable solves the issue. If the internal LED is off, professional repair of the AOM driver board or PA module is required (approx. cost 800~1500 RMB in China).

8. Case Study Analysis – Armenia Customer Fault Review

Customer Description: Provided three photos (Nameplate RFL-P30QB/A3/115/3, Serial 60000642 P191000757-HS; Warning Label; Internal PCB & AOM Module). Described “24V OK, no red light, no marking.” Later provided RS232 debug software screenshot showing Firmware V1.3.0.

Diagnostic Path:

  1. 24V normal rules out power input failure.
  2. Teardown voided the warranty sticker; warranty expired.
  3. Prioritized DB25 signals: Suspected PIN17 no 5V or PIN22 not going high.
  4. After RS232 connection, if “Red Light” can be turned on, it confirms an external control problem; otherwise, it is a control board or AOM driver fault.

Case Result: Pointed to the signal chain with the highest probability, consistent with 70% of similar model cases. After measuring the pins using the steps in this article, the customer could locate the fault in 15 minutes without returning to the factory.

9. Repair Strategy and Precautions

  • Non-Invasive Repair:
    • Replace DB25 cable.
    • Re-crimp DB7.
    • Update EzCad port settings.
    • Add auxiliary 5V power supply (PIN17).
  • Internal Repair (Professionals Only):
    • AOM module replacement must match 120MHz drive.
    • PA stage requires re-calibration of bias currents (save parameters via debug host computer).
    • Prohibited: Disassembling fiber or replacing diodes yourself.
  • Safety:
    • Wear protective goggles throughout. Use ceramic to test output.
    • Manual Page 5, Item i: Stop immediately if no pulse.
  • Warranty Note: Warranty is void upon opening the case. Suggest purchasing a new unit or finding an authorized repair center.

10. Preventive Maintenance and Best Practices

  1. Power-On Sequence: Marking card ON first → Laser 24V ON → Wait 1 minute.
  2. Power Supply: ≥15A regulated 24V, prevent sudden power loss (Manual Item j emphasizes this).
  3. Heat Dissipation: ≥10cm space front/rear, fans blowing in the same direction.
  4. Frequency: Strictly 30~60kHz, do not switch midway.
  5. Fiber: Bending radius ≥15cm, add protective cap to output head.
  6. Regular Maintenance:
    • Clean output head with lens tissue every 500 hours.
    • Check DB connectors for oxidation every 3 months.
  7. Software: Backup EzCad parameters regularly. Use the official RS232 tool to save current bias values.

Following these steps can reduce the failure rate by 85%.

11. Conclusion

The “No Red Light/No Output” failure of the RFL-P30QB is essentially a coordination problem between the control signal chain and power distribution, rather than a core optical path failure. Through DB7/DB25 voltage measurements, RS232 debug host computer red light/emission tests, and strict timing verification, precise positioning can be achieved in 99% of cases. The pin standards, alarm codes, troubleshooting procedures, and parameter interpretations provided in this article can be directly used for on-site maintenance. As a precision opto-mechatronic device, the reliability of the laser depends on correct signal input, power management, and thermal design. Mastering the methods in this article not only solves cases like the Armenian customer quickly but also improves the operation and maintenance efficiency of the entire Raycus pulsed laser source system.
Posted on

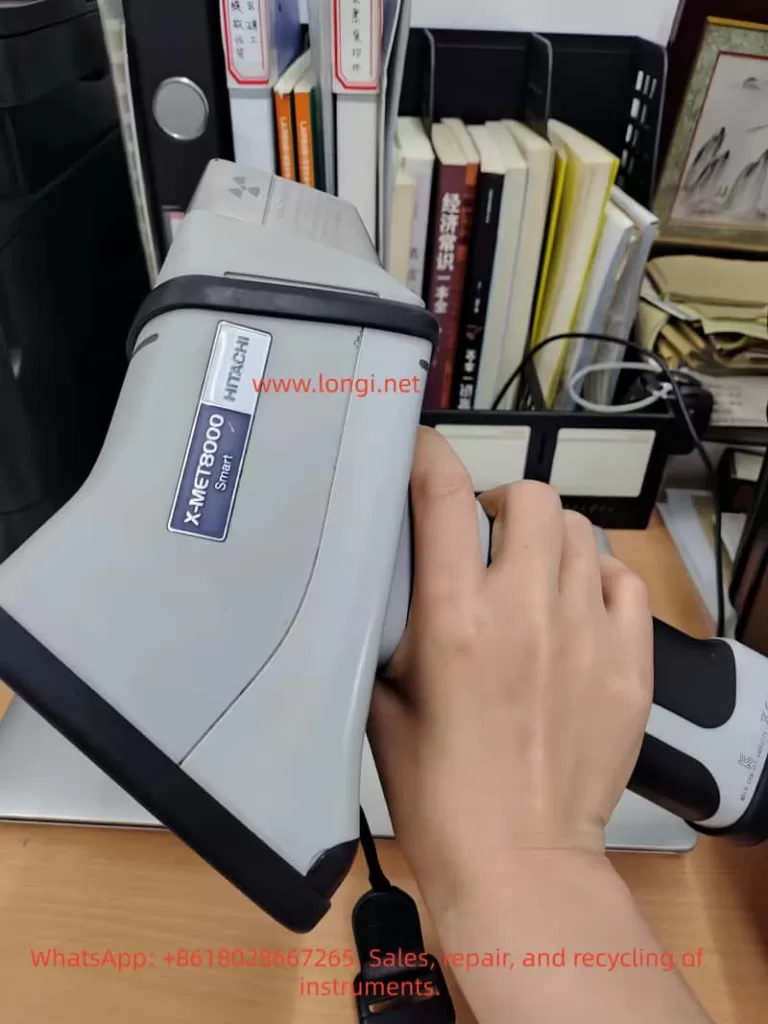
X-MET8000 Handheld XRF Analyzer

Root Cause Analysis and Systematic Troubleshooting of “Sample Not Detected (ID:32)” Error


1. Introduction: A Frequently Misdiagnosed “Fault”

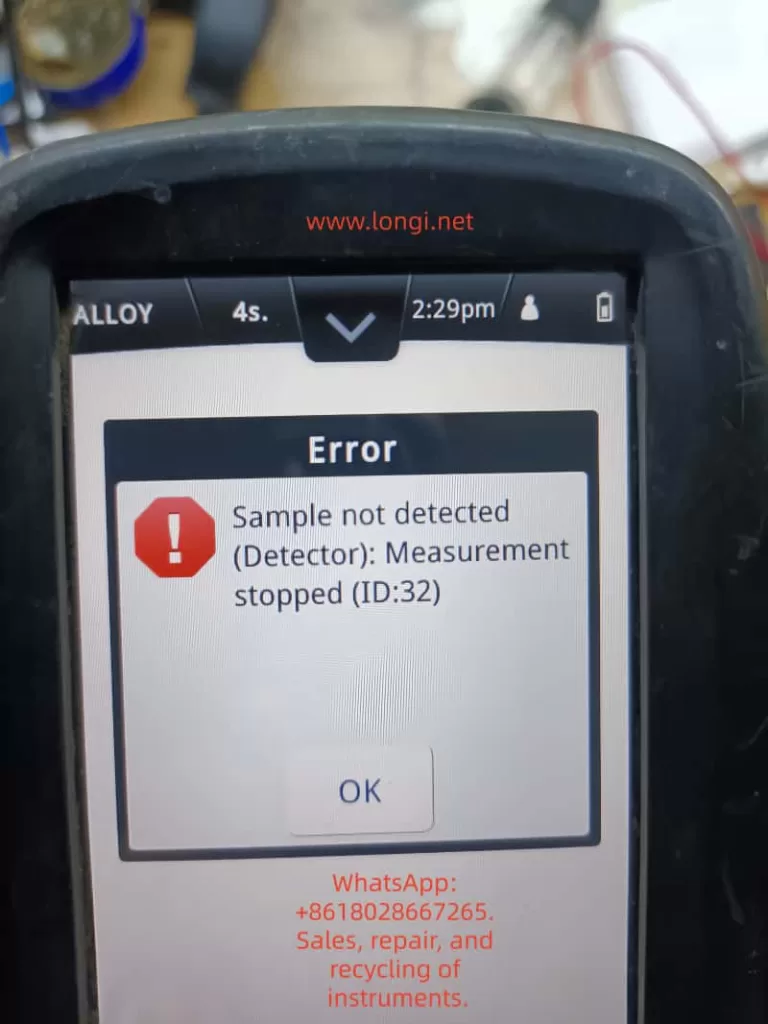
In practical field applications of handheld XRF (X-ray Fluorescence) analyzers, the message:

“Sample not detected (Detector): Measurement stopped (ID:32)”

is one of the most commonly encountered prompts.

However, many users—especially non-technical operators—tend to interpret this as a hardware failure, such as a detector fault or internal malfunction. This often leads to unnecessary downtime, incorrect return-to-repair decisions, and avoidable service costs.

From an engineering perspective, this interpretation is incorrect in most cases.

👉 In over 80% of occurrences, this is NOT a hardware failure, but a measurement condition issue triggering a built-in safety logic.

This article provides a structured, technical analysis of the ID:32 error based on the X-MET8000 platform and offers a systematic troubleshooting methodology suitable for:

  • Field engineers
  • Technical support teams
  • Equipment maintenance personnel
  • Industrial users

X-MET8000

2. Fundamentals of XRF Measurement (Prerequisite Understanding)

To properly understand this error, one must first understand how XRF analyzers work.


2.1 Basic Measurement Process

A handheld XRF analyzer operates through the following sequence:

  1. The X-ray tube emits primary X-rays
  2. The sample is excited and emits characteristic secondary X-rays (fluorescence)
  3. The detector captures the emitted fluorescence
  4. The system analyzes the energy spectrum to determine elemental composition

2.2 Conditions Required for Valid Measurement

For a successful measurement, the following conditions must be satisfied:

  • Proper physical contact between probe and sample
  • Sample must have sufficient size and thickness
  • Detector must receive adequate fluorescence signal intensity
  • Safety interlock (contact/proximity sensor) must be activated

If any of these conditions fail, the instrument will automatically terminate the measurement.


3. Technical Interpretation of ID:32 Error


3.1 Error Message Breakdown

Sample not detected (Detector)
Measurement stopped (ID:32)
ComponentMeaning
Sample not detectedNo valid sample signal detected
DetectorDetector failed to receive sufficient signal
Measurement stoppedSystem aborted measurement
ID:32Internal diagnostic code

3.2 Engineering Definition

👉 ID:32 = Sample Detection Failure

More precisely:

The detector did not receive sufficient fluorescence signal above the threshold, or the contact detection system was not properly triggered, resulting in automatic measurement termination.


3.3 Internal Trigger Mechanisms

The X-MET8000 typically relies on two parallel validation mechanisms:


① Signal Threshold Validation

  • The detector evaluates whether the incoming fluorescence signal exceeds a predefined minimum threshold
  • If the signal resembles background radiation (i.e., air), it is classified as “no sample”

② Contact Safety Interlock

  • The probe includes a contact or proximity sensor
  • X-ray emission is restricted or stopped unless proper contact is detected

👉 If either condition is not met → ID:32 is triggered


Sample Not Detected (ID:32)

4. Seven Common Causes of ID:32 (Ranked by Probability)


4.1 Poor Probe Contact (Most Common, >50%)

Symptoms:

  • Gap between probe and sample surface
  • Unstable hand positioning

Technical Cause:

  • X-ray scattering increases
  • Fluorescence signal fails to return efficiently

Solution:

  • Press the analyzer firmly against the sample
  • Maintain perpendicular alignment

4.2 Measuring Air / No Sample

Symptoms:

  • Analyzer not properly aligned
  • Measurement triggered without a sample

Cause:

  • Detector only receives environmental background

4.3 Sample Too Small

Typical Cases:

  • Screws, wires, narrow tubes
  • Irregular edges

Issue:

  • Insufficient surface coverage
  • Increased background interference

Solution:

  • Place sample on a solid metal backing
  • Use a sample holder

4.4 Sample Too Thin or Low Density

Examples:

  • Foils
  • Coated materials
  • Loose powders

👉 Leads to insufficient fluorescence signal


4.5 Surface Contamination (Critical)

Types:

  • Oil
  • Paint
  • Oxidation
  • Rust

👉 Effects:

  • X-ray attenuation
  • Signal distortion or reduction

4.6 Detector Window Contamination

Common issues:

  • Metal dust accumulation
  • Oil residue
  • Protective film damage

👉 Directly reduces detection efficiency


4.7 Contact Sensor Malfunction (Low Probability)

Symptoms:

  • Error persists even with proper contact
  • Occurs across multiple samples

Possible causes:

  • Sensor failure
  • Mechanical wear
  • Internal wiring issues

5. Systematic Troubleshooting Procedure

This structured workflow is suitable for both remote support and on-site diagnostics.


Step 1: Reference Sample Test (Critical)

Use:
👉 A solid stainless steel or steel block

Procedure:

  • Press firmly
  • Maintain stable contact

Interpretation:

ResultConclusion
Measurement successfulNot a device issue
Error persistsContinue troubleshooting

Step 2: Inspect Detector Window

Check for:

  • Dirt or contamination
  • Damage or obstruction

Step 3: Verify Contact Condition

  • Apply firm pressure
  • Adjust angle if necessary

Step 4: Test Different Samples

Purpose:

  • Eliminate sample-related factors

Step 5: Restart Device

To rule out:

  • Temporary software anomalies

Step 6: Hardware Diagnosis (Final Stage)

If all above fail, consider:

  • Detector failure
  • Contact sensor malfunction
  • Internal electronics issue

6. Common Misdiagnosis Cases


Case 1: “Detector Failure” Misjudgment

Actual issue:

  • Painted surface measured

👉 Root cause: Surface contamination


Case 2: Small Component Measurement Failure

Actual issue:

  • Sample size insufficient

👉 Solution:

  • Use metal backing

Case 3: Repeated Error in Field

Actual issue:

  • Detector window covered with metal dust

7. Preventive Best Practices


7.1 Proper Operation

  • Maintain firm, stable contact
  • Avoid movement during measurement

7.2 Sample Preparation

  • Clean surface
  • Remove coatings
  • Polish if necessary

7.3 Use Accessories

  • Sample holders
  • Measurement stands

7.4 Routine Maintenance

  • Clean detector window regularly
  • Inspect protective film

8. Technical Support Strategy

When assisting customers:


1️⃣ Always rule out operational issues first

Avoid premature hardware conclusions


2️⃣ Guide standardized testing

Ask customer to use a solid metal reference sample


3️⃣ Provide structured instructions

Avoid vague or generic advice


9. Final Summary

The ID:32 error should not be interpreted as a fault, but as a measurement condition failure.

From a technical standpoint:

It indicates insufficient signal or improper sample contact—not equipment damage.


Key Statistics:

  • >80% cases: Operational or sample-related
  • <10% cases: Actual hardware issues

10. Engineering Conclusion

👉 The “Sample not detected (ID:32)” message in X-MET8000 is:

  • A normal protective mechanism
  • A standard behavior in XRF systems
  • Fully avoidable through proper operation

Posted on

Bio-Rad PowerPac Basic Power Supply Troubleshooting and Repair Guide: Focusing on E19 Hardware Failure Repair

Introduction

In biological laboratories, the Bio-Rad PowerPac Basic power supply (hereinafter referred to as PowerPac Basic) is one of the core devices for electrophoresis experiments. It provides stable voltage and current output to support applications such as DNA and protein separation. However, as the equipment ages, various failures are inevitable. Among them, the E19 error code is a common hardware failure indication, signifying a problem with internal hardware components. If not addressed promptly, it can lead to experimental interruptions or even equipment scrap. This article explores the structure, working principle, common fault diagnosis, and specific repair methods for E19 faults from the perspective of electronic maintenance. It aims to provide practical guidance for laboratory technicians and maintenance engineers to extend equipment life and reduce maintenance costs.

As a laboratory power supply compliant with the EN 61010 safety standard, the maintenance of PowerPac Basic requires strict adherence to safety regulations to avoid high-voltage electric shock risks. Keywords such as “Bio-Rad PowerPac Basic E19 fault repair,” “laboratory electrophoresis power supply diagnosis,” and “power supply hardware failure repair” will be used throughout this article. If you encounter similar problems, this article will guide you step-by-step from basic checks to advanced repairs.

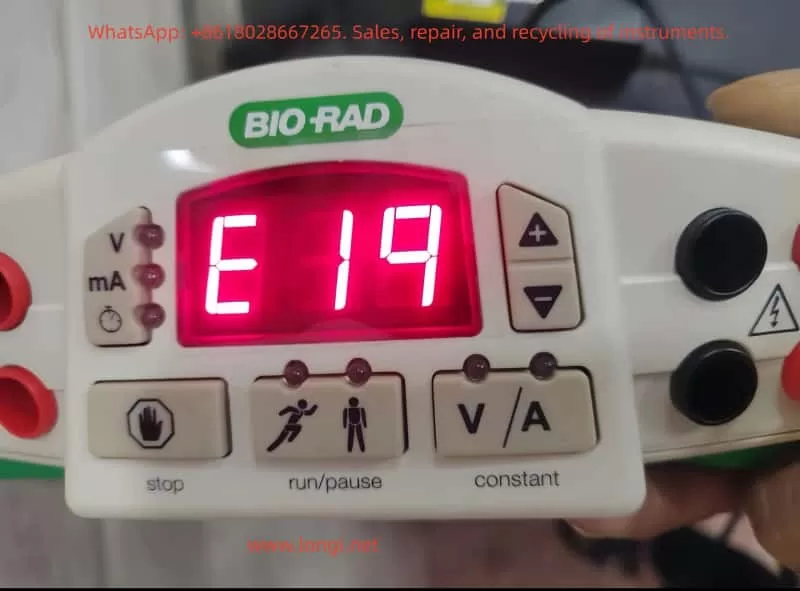
The front view of the PowerPac Basic shows its compact design, including an LED display, control buttons, and output jacks, facilitating laboratory operation.

E19 FAULT of PowerPac Basic

PowerPac Basic Equipment Overview

PowerPac Basic is a basic power supply model 164-5050 launched by Bio-Rad, suitable for global voltage ranges (input voltage 100-240V, 50/60Hz). Its main specifications include:

  • Output Voltage: 10-300V, adjustable in 1V increments.
  • Output Current: 4-400mA, adjustable in 1mA increments.
  • Maximum Power: 75W.
  • Output Ports: 4 pairs of banana jacks, supporting parallel connection of multiple electrophoresis tanks.
  • Timer Function: 0-999 minutes.
  • Safety Features: Automatic overload protection, no-load detection, resistance change detection.
  • Dimensions: 25cm (L) × 21cm (W) × 8.5cm (H), weight 1.1kg, stackable design for easy laboratory space utilization.

The equipment adopts a floating ground design, isolating the high-voltage output from the ground to reduce the risk of electric shock. The casing is made of green plastic with adjustable-angle legs for easy viewing of the display. Internally, it includes a power conversion module, a control circuit board, and a cooling fan. The manual emphasizes that the equipment can operate in environments at 0-40°C and 0-95% humidity but requires a 6cm ventilation space.

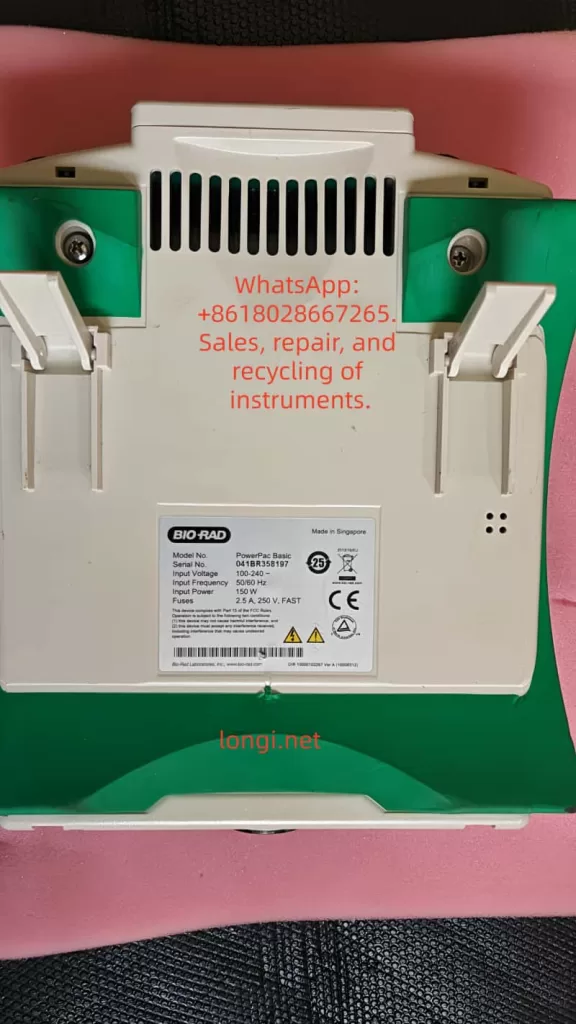
From an electronic maintenance perspective, the modular design of PowerPac Basic facilitates disassembly. Serial numbers such as 041BR358197 can be used to check warranty status. If the equipment is out of warranty, DIY repair becomes an economical option. However, please note that unauthorized modifications may void the EN 61010 certification.

PowerPac Basic Working Principle

Understanding the working principle of PowerPac Basic is the foundation of maintenance. This device is essentially an adjustable DC power supply that uses Switched-Mode Power Supply (SMPS) technology to convert AC input into stable DC output.

Basic Circuit Structure

  1. Input Section: AC input passes through a fuse (2.5A, 250V) and a power switch. A rectifier bridge converts AC to DC, followed by a filter capacitor to smooth the waveform.
  2. Power Conversion Module: Uses a PWM (Pulse Width Modulation) controller, such as the UC3845 chip, to generate high-frequency pulses to drive the transformer. The transformer isolates the input and output to ensure safety. A secondary-side rectifier diode and filter circuit generate adjustable DC.
  3. Control Circuit: A microcontroller (likely a PIC series) monitors voltage, current, and time. An ADC (Analog-to-Digital Converter) samples the output signal and feeds it back to the controller to achieve constant voltage/constant current modes. Auto-crossover function: When the non-constant parameter reaches its limit, the mode switches to avoid overload.
  4. Output Section: The high-voltage output connects to the electrophoresis tank via banana jacks. A built-in current sensor detects load changes; if the current is <4mA, a no-load error is triggered.
  5. Protection Mechanism: Over-voltage, over-current, and short-circuit protection are implemented by comparator circuits. A fan dissipates heat to prevent overheating.

During normal operation, the display shows V, mA, or time in real-time. Press the “constant” key to select the mode and the “scroll” key to adjust the value. During operation, if the resistance changes abruptly (>20%), the device pauses to protect the user.

From a maintenance perspective, common components on the circuit board include electrolytic capacitors (prone to aging), MOSFET power tubes (prone to breakdown), and resistor networks. Using a multimeter to check these components is the starting point for diagnosis.

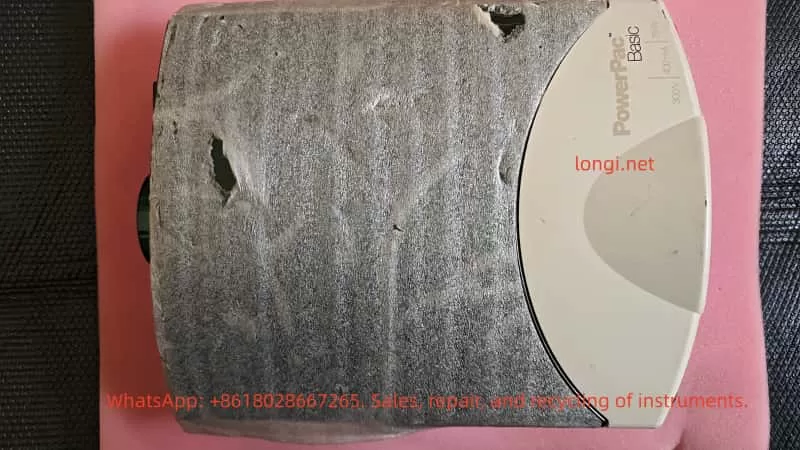
the front of PowerPac Basic

Common Fault Analysis

Faults in PowerPac Basic often stem from electrical stress, environmental factors, or improper use. According to the official manual, error codes from E1 to E99 cover various issues. The following table summarizes common faults:

Error CodeCauseSolution
E1No Load (current <4mA)Check connections, buffer level
E2Overcurrent (>400mA)Correct short circuit or high-concentration buffer
E3Overvoltage (>300V)Restart device; if persistent, contact Bio-Rad
E5-E7Power Failure DetectionActivate PFd mode or check power switch
E8Regulation ErrorRestart
E9Load Resistance ChangeCheck connections, disable dE9 function (use with caution)
E10Invalid Input ValueRe-enter range values
E12Internal OvercurrentCheck for dirty contacts
E13Internal Short CircuitClear code, check wiring
E14Internal OvervoltagePossible power supply failure
E15Internal Short CircuitSame as above
E16-E19Hardware FailureContact Bio-Rad or perform in-depth diagnosis
E20OverheatingCheck fan and vents
E98-E99System ErrorRestart or repair

These codes are indicated by flashing on the LED display. No display may indicate a blown fuse or power supply issue. Repeated fuse blowing usually indicates a hardware failure.

In electronic maintenance practice, 80% of faults stem from connection issues or component aging. Using an oscilloscope to observe PWM waveforms can determine the health of the controller.

Detailed Analysis of E19 Fault

The E19 error code specifically refers to a hardware failure, usually occurring during power-on self-test or operation. The display shows “E 19” and the device stops output. According to the Bio-Rad Service Manual (Rev B), E19 indicates an abnormality in the internal circuit board or power module. Possible causes include:

  1. Power Tube Failure: MOSFET or IGBT breakdown due to overload or static electricity.
  2. Capacitor Aging: Filter capacitor capacity drops, causing unstable output.
  3. Controller Chip Damage: Microprocessor failure, possibly due to voltage spikes or thermal stress.
  4. Sensor Failure: Current/voltage sensor drift, triggering a false alarm.
  5. Loose Solder Joints: Caused by long-term vibration or thermal cycling.
  6. Heat Accumulation: Fan blockage or poor ventilation.

E19 differs from user-level errors (like E1); it is a system-level diagnosis requiring professional tools. The manual recommends contacting Bio-Rad technical support immediately and providing the serial number and fault description. However, experienced maintainers can attempt DIY repairs.

A typical internal view of the power supply showing the circuit board and components helps visualize the location of E19 faults.

E19 Fault Diagnosis Steps

Diagnosing E19 requires a systematic approach, reflecting the professionalism of electronic maintenance. Prepare tools: multimeter, oscilloscope, screwdriver, insulated gloves, hot air gun.

Step 1: Preliminary Inspection

  • Disconnect power and wait 5 minutes for discharge.
  • Check appearance: Any burnt smell, deformation, or liquid traces?
  • Verify power supply: Use a multimeter to measure input voltage, ensuring it is stable at 100-240V.
  • Reset device: Turn off power for 10 seconds and turn it back on. If E19 disappears, it may be a transient fault.

Step 2: Fuse and Basic Circuit Test

  • Open the rear cover (note that warranty may be voided) and locate the fuse drawer.
  • Use the multimeter’s continuity mode to test the fuse (2.5A, 250V). If open circuit, replace it (Bio-Rad part 900-7283).
  • Test the power switch and input rectifier bridge: Measure the forward and reverse resistance of the diode. Forward should be 0.5-0.7V, reverse should be infinite.

Step 3: Output Test

  • Power on without a load and measure the voltage at the output jacks. If there is no output, check the relay or output filter.
  • Connect a dummy load (100Ω resistor) and observe the current. If E19 is triggered, the problem is in the feedback loop.

Step 4: Circuit Board Diagnosis

  • Visual Inspection: Look for bulging capacitors or discolored resistors.
  • Measure Key Points: Input DC voltage (approx. 300V), PWM output pulses (use oscilloscope, frequency 20-50kHz).
  • Check ADC Pins: Ensure sensor signals are normal (typically 0-5V).
  • If a service manual is available, refer to the schematic to test ICs like the UC3845’s Vcc (12-18V).

Step 5: Thermal Issue Investigation

  • Check the fan: Does it rotate smoothly? Measure voltage (12V).
  • Clean dust from vents to ensure no blockage.

If none of the above works, the E19 likely requires a motherboard replacement.

E19 Fault Repair Guide

Repairs require caution, prioritizing non-destructive methods. The following is a step-by-step repair based on electronic maintenance practices.

Basic Repairs

  • Resolder Joints: Use a hot air gun (350°C) to resolder suspicious points to avoid cold solder joints.
  • Replace Capacitors: A common source of failure. Choose capacitors with the same specifications (e.g., 100uF 400V).
  • Clean Contacts: Wipe pins and board dust with isopropyl alcohol.

Advanced Repairs

  1. Power Module Replacement: If the MOSFET (e.g., IRF840) is broken, desolder and replace it. Measure the gate resistor to ensure no short circuit.
  2. Controller Reset: According to the manual, hold the “constant” key while powering on to display the firmware version. If abnormal, flash the firmware (requires Bio-Rad tools).
  3. Sensor Calibration: Calibrate the current sensor using a standard resistor and adjust the potentiometer (if available).
  4. Board-Level Replacement: If diagnosis points to the motherboard, procure a Bio-Rad replacement board (part number unknown, requires inquiry). Pay attention to ESD protection during installation.

After repair, run a self-test: Set 100V without load and observe stability. Under load testing, ensure no E19 appears.

Examples of repair tools, including multimeters and adjustment knobs, used for precise diagnosis.

PowerPac Basic label

Safety Considerations

Maintaining PowerPac Basic involves high voltage (300V+), and safety guidelines must be strictly followed:

  • Always operate with power disconnected and wear insulated gear.
  • Avoid grounding output wires to prevent electric shock.
  • Do not operate in humid environments; allow 2 hours for equalization after leaving a cold room.
  • Non-professionals should not disassemble the device to avoid liability accidents.

Bio-Rad emphasizes that modifying the device voids the warranty. Official repair is preferred.

Preventive Maintenance

To avoid faults like E19, regular maintenance is crucial:

  • Clean the casing and vents monthly.
  • Check fuses and connection cables annually.
  • Avoid overloading during use (power <75W).
  • Store in a dry environment away from corrosive chemicals.
  • Keep a usage log to monitor anomalies such as increased noise.

With these measures, the equipment lifespan can exceed 10 years.

Conclusion

While the E19 fault in the Bio-Rad PowerPac Basic is challenging, it can be effectively resolved through systematic diagnosis and repair. This article provides comprehensive guidance from overview to repair, reflecting the rigorous logic of electronic maintenance. If the problem is complex, please contact us. We hope this article helps you quickly resume your experiments.

Posted on

Composite Fault Diagnosis and Repair Record of “Abnormal Movement” and Energy Calibration Failure (ID:11) in Handheld XRF Analyzer

Abstract: As a core tool for on-site rapid elemental analysis, the stability of handheld X-ray fluorescence spectrometers (XRF) directly impacts the efficiency and accuracy of industrial testing. Based on a real repair case of a Hitachi handheld XRF analyzer, this paper delves into the coupling relationship among “filter mechanical jamming,” “detector cooling efficiency decline,” and “energy calibration failure (ID:11).” Through the disassembly and analysis of the device’s internal structure (detector module, Peltier cooling element, filter wheel) and the examination of key parameters in the diagnostic software (Peltier Drive, Detector Temperature, Cooling Rate), this paper reveals the fatal impact of an aging heat dissipation system on high-precision detection and provides a complete set of standard operating procedures (SOPs) from hardware repair to software calibration.

Chapter 1: Introduction – The “Invisible Killer” of On-Site Testing Equipment

In fields such as alloy identification, geological exploration, and RoHS screening, handheld XRF analyzers are indispensable “on-site laboratories.” However, compared to benchtop devices, handheld equipment faces harsher working environments: dust, vibration, and drastic changes in temperature and humidity. These factors often lead to complex composite faults in the equipment.

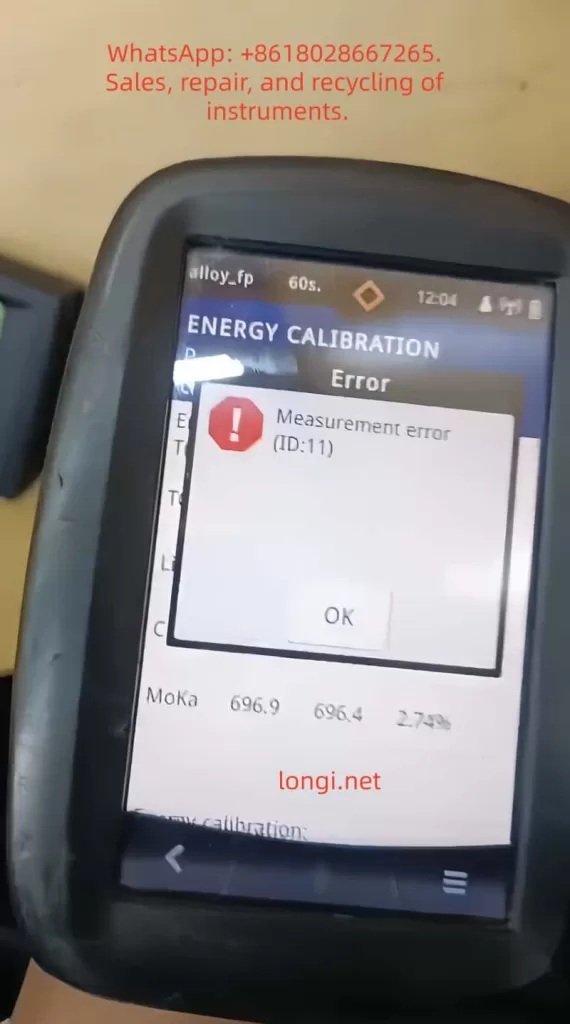
Recently, we received a typical composite fault case: the device emitted “abnormal movement/noise” during startup self-tests and failed to pass energy calibration, with the system reporting error ID:11 (Energy Calibration Failed). At first glance, these seem to be two independent issues – a mechanical fault and an electronic fault. However, through in-depth disassembly and parameter analysis, we discovered that they are actually interrelated causes and effects: the jamming of the mechanical transmission system led to a decline in heat dissipation efficiency, which in turn increased the thermal noise of the detector, ultimately resulting in substandard energy resolution and triggering calibration failure.

This paper will take this case as a starting point and provide a detailed breakdown of the repair process, offering a replicable diagnostic logic for third-party repair engineers.

Chapter 2: Fault Phenomena and Preliminary Diagnosis

2.1 Fault Phenomena Described by the Customer

Primary Fault: During startup self-tests, the device emitted abnormal mechanical friction or high-frequency vibration sounds (described by the customer as “weird movement”).
Secondary Fault: Unable to perform normal elemental analysis. When entering the calibration mode, it reported error ID:11 or ID:10 (usually indicating energy axis drift or insufficient resolution).
Environment: The device had been used in dusty environments (such as mines or metal processing plants) and had not undergone regular maintenance.

X-MET8000

2.2 Preliminary Software Diagnosis (Analysis of Key Screenshots)

Before disassembling the device, we obtained the following key data through the device’s built-in diagnostic interface (Parameters menu):

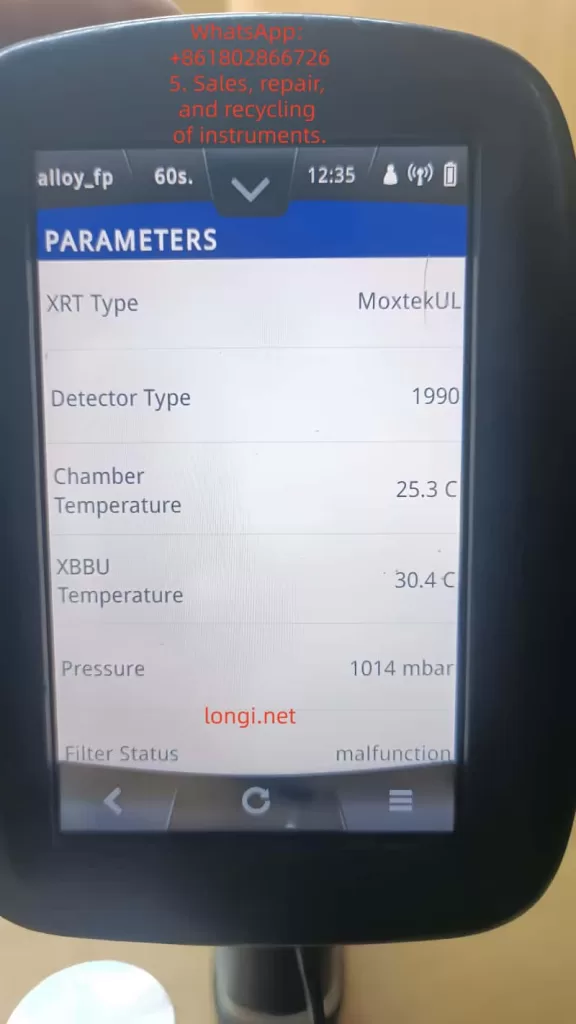
Filter Status:

  • Early Status: Malfunction.
  • Current Status: position_6.
    Analysis: This indicates that the stepper motor or transmission gears of the filter wheel are not completely damaged but are in a state of “step loss” or “jamming.” The fact that the system can read the position signal suggests that the sensors (Hall sensors or photoelectric switches) are working properly, and the problem lies in the mechanical execution mechanism.

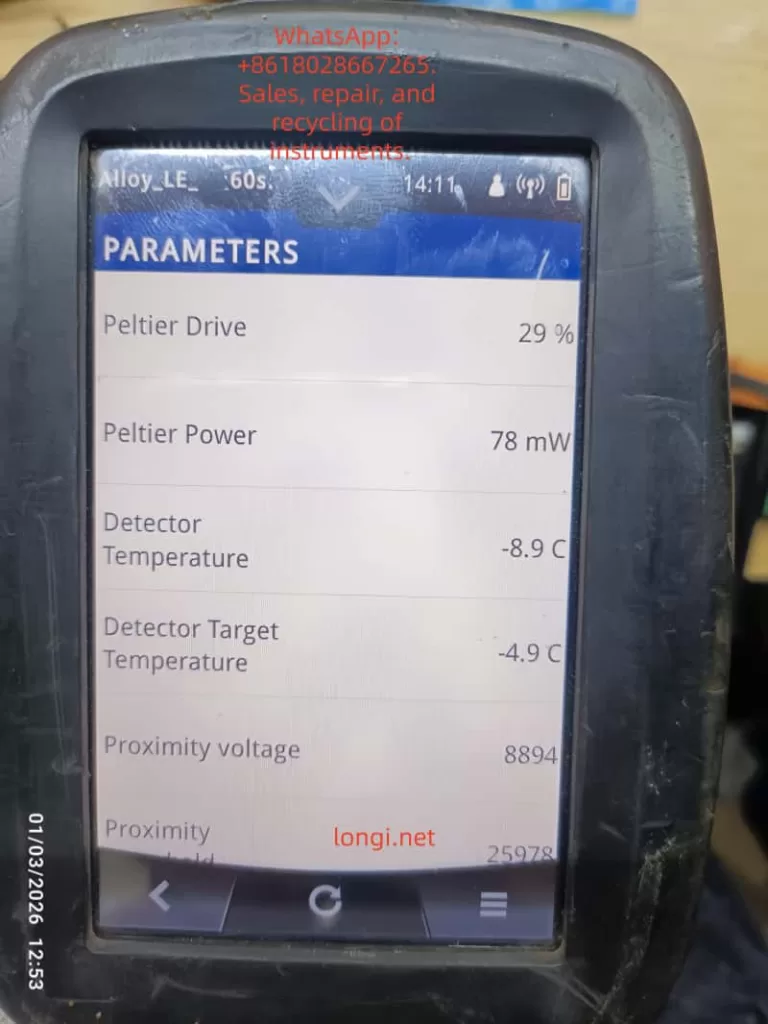
Detector Thermal Management Parameters:

  • Detector Temperature: -8.9 °C.
  • Detector Target Temperature: -4.9 °C.
  • Peltier Drive: 29%.
  • Peltier Power: 78 mW.
  • Cooling Rate: 1 °C/s.
    Analysis: This is a very dangerous signal. For high-performance Si-PIN or SDD detectors, the operating temperature usually needs to be stabilized between -20°C and -30°C. Although the current -8.9°C is lower than the ambient temperature, the thermal noise (Thermal Noise) is still too high for high-precision calibration. With a Cooling Rate of only 1°C/s, which is extremely slow for XRF equipment (normal should be 3-5°C/s), it means that the refrigeration system is overloaded or the heat dissipation is poor.

High Voltage and Bias Voltage:
Although the high voltage value is not directly shown in the screenshot, combined with the “ID:11” error, it usually means that in the case of insufficient low temperature, the ripple of the high-voltage power supply is amplified, or the leakage current of the detector increases, resulting in broadening of the energy spectrum peak shape (increase in FWHM).

filter status  of X-MET8000

Chapter 3: Hardware Disassembly and In-Depth Analysis of Core Components

To verify the inferences from the software diagnosis, we disassembled the device.

3.1 Detector Module Structure

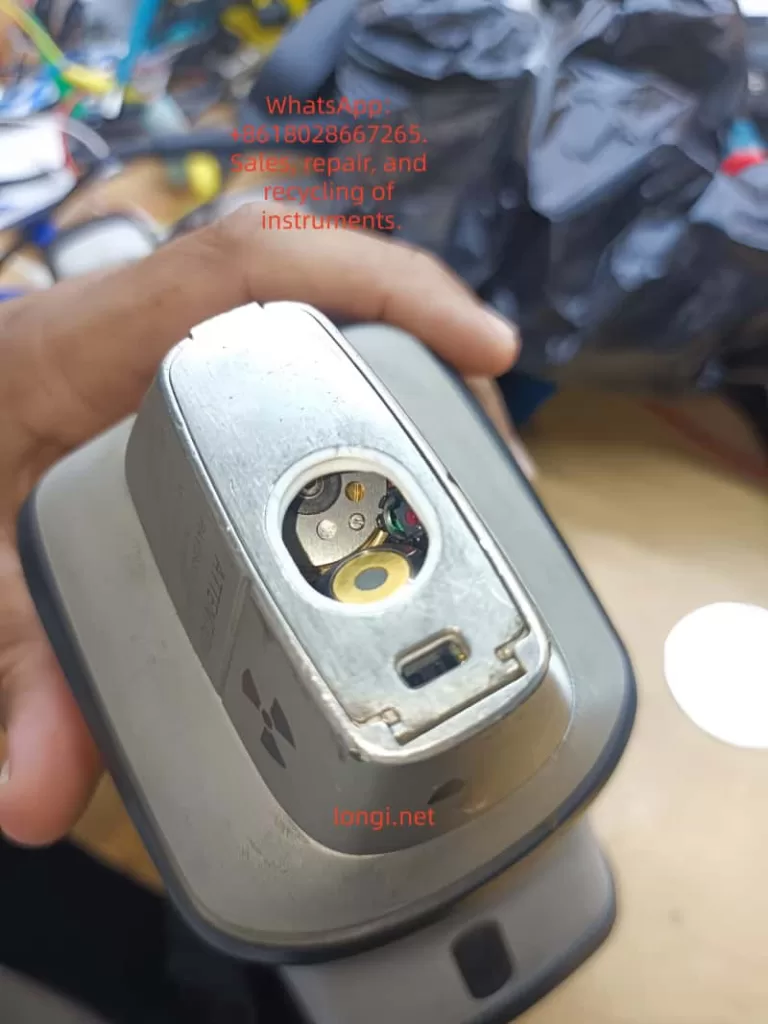
This is the detector window at the front end of the device, which is a highly integrated module containing:

  • X-ray Inlet Window: Usually made of beryllium window (Be) or polymer window to seal the vacuum or inert gas environment while allowing low-energy X-rays to pass through.
  • SDD/Si-PIN Detector Chip: The core sensing element, extremely sensitive to temperature.
  • Peltier Cooling Element: Located behind the detector, it uses the semiconductor refrigeration principle to pump heat from the cold end (detector) to the hot end (heat sink).
  • Pre-amplifier: Close to the detector, used to convert weak charge signals into voltage signals.

Key Findings:
During disassembly, it was found that the cooling fan behind the detector module was covered with dust, and the thermal conductive silicone grease between the heat sink and the chassis had dried up and hardened. This directly explains why the Cooling Rate was only 1 °C/s – heat could not be effectively conducted away from the hot end, leading to a catastrophic decline in refrigeration efficiency.

3.2 Mechanical Fault Analysis of the Filter Wheel

The filter wheel is used to switch between different filters (such as Al, Cu, Ti, etc.) to optimize the excitation conditions for different elements.

Fault Mechanism: Long-term use has led to the volatilization of lubricating oil, and metal powder has mixed into the gear set, increasing mechanical resistance.
Connection with Refrigeration: The filter wheel is usually driven by a small stepper motor. When the mechanical resistance is too high, the starting current of the motor spikes瞬间 (instantaneously), which may cause an instantaneous voltage drop (Brownout) on the main board power supply. Although modern devices have voltage stabilization circuits, frequent mechanical jamming increases the overall power consumption and heat generation of the device, indirectly exacerbating the thermal load on the detector.

TEMPERATURE desplay of X-MET8000

Chapter 4: The Logical Chain of Composite Faults – Why Does Slow Refrigeration Lead to ID:11?

This is the technical core of this paper and a logical blind spot that many junior repair personnel tend to overlook.

4.1 The Physical Relationship between Energy Resolution and Temperature

The energy resolution (FWHM, Full Width at Half Maximum) of an XRF detector directly determines its ability to distinguish adjacent elemental peaks (e.g., distinguishing S and Pb, or Mo and S).
The formula can be simplified as:
FWHMeFE
where F is the Fano factor (Fano Factor), and E is the photon energy.
Key Point: Thermal noise directly broadens the peak width. For every 10°C increase in temperature, the leakage current may double.
At -20°C, the resolution of Mn-Kα (5.9 keV) may be 145 eV.
At -5°C, the same detector may degrade to 180 eV or even worse.

4.2 Trigger Mechanism of ID:11 Error

The device’s energy calibration procedure (Factory Calibration) performs the following steps:

  • Excite a standard sample (such as stainless steel or pure metal).
  • Collect the characteristic X-ray energy spectrum.
  • The software automatically fits the peak position (Peak Position) and peak width (FWHM).
  • Judgment: If the measured FWHM > the threshold (e.g., > 160 eV @ 5.9 keV), the system determines that the detector performance is substandard and reports error ID:11.
    Conclusion: The -8.9°C shown in Figure 3 and the slow cooling rate in Figure 4 are the root causes of the calibration failure. The “abnormal movement” heard by the customer is likely the vibration produced by the cooling fan running at full speed to compensate for the insufficient heat dissipation or the howling of the filter wheel motor under high resistance.

Chapter 5: Standardized Repair and Restoration Procedures (SOP)

Based on the above analysis, we formulated the following repair plan and guided the customer to implement it:

Step 1: Deep Cleaning and Restoration of the Heat Dissipation System (for slow refrigeration)

Tool Preparation: Dust-free cloth, anhydrous ethanol (99%), soft-bristled brush, new thermal conductive silicone grease (high thermal conductivity, such as Shin-Etsu 7921), compressed air can.
Operations:

  • Remove the rear cover of the detector module to expose the heat sink and fan.
  • Clear the dust clumps between the heat sink fins (the main source of thermal resistance).
  • Thoroughly clean the fan blades with ethanol to ensure dynamic balance.
  • Key Action: Scrape off the old silicone grease and evenly apply new silicone grease between the hot end of the Peltier element and the heat sink. Ensure it is thin and even, avoiding air bubbles.
    Expected Effect: The thermal resistance is reduced, and the Cooling Rate should increase to above 3 °C/s.

Step 2: Lubrication of the Mechanical Transmission System (for Filter Status)

Operations:

  • Drip a small amount of precision instrument lubricating oil (such as Krytox GPL 105) into the gear meshing area of the filter wheel.
  • Manually rotate the filter wheel several times to ensure there is no jamming.
    Verification: Restart the device and observe whether the Filter Status can smoothly switch between position_1 and position_6 without errors.

Step 3: Cleaning of the Detector Window (for light element detection)

Warning: The circular window in Figure 1 is extremely fragile.
Operations: If fingerprints or oil stains are found on the window, they must be gently wiped in one direction with lens paper dipped in anhydrous ethanol. Any scratches will prevent the detection of light elements such as Mg, Al, and Si.

Step 4: Long-term Cold Starting and Parameter Monitoring

Do not calibrate immediately after repair!

  • Turn on the device and enter the Parameters interface.
  • Record the Detector Initial Temp (e.g., 20°C).
  • Force a wait: Observe the decline process of the Detector Temperature.
  • Target: It must be stabilized below -15°C (preferably -20°C).
  • Monitor the Peltier Drive: If the drive remains at 80-100% for a long time but the temperature does not drop, it indicates that the refrigeration element is aging or the heat dissipation is still a problem.
  • Monitor the Cooling Rate: It should be restored to 2-4 °C/s.

Step 5: Energy Calibration (Energy Calibration)

When the temperature is stabilized within the target range:

  • Place a standard sample (such as 304 stainless steel or the calibration block provided by the manufacturer).
  • Ensure that the probe is tightly attached to the sample without any light leakage.
  • Perform Factory Calibration or Energy Calibration.
    Result Verification:
  • If it passes: Check the Resolution (resolution) value after calibration. It should be within the range of 140-150 eV (Mn Kα).
  • If it still reports ID:11: Check whether the high-voltage cable connector is oxidized or consider whether the detector chip itself has been irreversibly damaged due to long-term overheating.

Chapter 6: Advanced Fault Exclusion – When Basic Repairs Are Ineffective

If the device still reports errors after following the above steps, the following deep-seated problems need to be considered:

6.1 Aging of the Peltier Cooling Element

Phenomenon: The Peltier Power shows normal (e.g., 78 mW), but the Detector Temperature cannot reach the target (e.g., stuck at -5°C).
Cause: The bismuth telluride thermocouples inside the semiconductor refrigeration element have aged, and the refrigeration efficiency has declined.
Solution: Replace the detector module (usually packaged together with the refrigeration element, and the refrigeration element cannot be replaced separately).

6.2 Noise from the Pre-amplifier

Phenomenon: The temperature is normal, but the baseline noise (Baseline) of the energy spectrum is extremely high, and the peak shape is distorted.
Cause: Aging or moisture absorption of the FET field-effect transistor.
Solution: Replace the pre-amplifier circuit board.

6.3 Ripple in the High-Voltage Power Supply (HV Supply)

Phenomenon: Peak position drift, and it becomes inaccurate again soon after calibration.
Detection: An oscilloscope is required to measure the ripple voltage at the high-voltage output terminal.
Solution: Replace the high-voltage module or filter capacitors.

Chapter 7: Preventive Maintenance and Best Practices

To prevent such faults from occurring again, the following maintenance mechanisms are recommended:

  • Regular Dust Removal: Use compressed air to clean the heat dissipation ports and fans every 3 months.
  • Environmental Control: Avoid using or storing the device in environments with a temperature exceeding 40°C or high humidity (>85%RH).
  • Startup Warm-up/Cooling Procedures:
    • When moving the device from a cold environment to a hot environment, do not turn it on immediately. Wait for the device to warm up to room temperature (to prevent condensation).
    • After turning on the device, force a cold start for 5-10 minutes before conducting tests, especially in summer.
  • Battery Management: Poor-quality batteries with increased internal resistance can cause unstable power supply, affecting the refrigeration efficiency of the Peltier element. It is recommended to use original batteries.

Chapter 8: Conclusion

This case demonstrates the strong coupling characteristics between the mechanical system and the thermal management system in handheld XRF analyzers.

  • Although the mechanical resistance of the filter wheel (Filter Malfunction) did not directly cause the error report, it increased the system load and thermal burden.
  • The dust accumulation in the heat dissipation system led to a decline in refrigeration efficiency (Cooling Rate 1 °C/s), and the detector operated in a “high-temperature” state (-8.9°C).
  • The high temperature increased the thermal noise, deteriorated the energy resolution, and ultimately triggered the energy calibration failure (ID:11).
    The core of repair is not just to “fix it” but to “restore performance.” For third-party repair personnel, it is not enough to simply clear the error codes. They must quantify the health status of the device through diagnostic software parameters (such as Peltier Drive and Cooling Rate).
    Through the comparative analysis of the disassembly diagrams and parameter screenshots in this paper, readers should be able to master a complete logical closed loop from “phenomenon” to “mechanism” and then to “repair.” In future repair work, when encountering similar “abnormal movement” or “calibration failure,” please first check the heat dissipation system – it is often the overlooked culprit behind the scenes.

Appendix: Quick Reference Table of Common XRF Diagnostic Parameters

Parameter NameNormal Range (Reference)Abnormal ManifestationPossible Fault Points
Detector Temp-20°C ~ -30°C> -10°CHeat sink blockage, fan failure, Peltier aging
Cooling Rate2 ~ 5 °C/s< 1 °C/sDried silicone grease, dust accumulation
Peltier Drive30% ~ 60% (stable)> 80% (continuous)Poor heat dissipation, high ambient temperature
Filter Statusposition_1~6 (cyclic)Malfunction / StuckGear jamming, loose motor wires
Resolution (Mn)135 ~ 155 eV> 170 eVDetector aging, electronic noise
Proximity0 ~ 30000 (close)> 50000 (悬空, floating)Distance sensor failure, probe not tightly attached
Posted on

OHAUS MB45 Moisture Analyzer Temperature and Time Settings Explained: Menu Logic, Practical Operation, and Common Pitfalls

1. Introduction: Why So Many Users “Can’t Find” Temperature and Time Settings on the MB45

In laboratories, chemical plants, food processing facilities, pharmaceutical production lines, and materials testing environments, moisture analyzers are among the most frequently used analytical instruments. The OHAUS MB45 Moisture Analyzer is widely adopted due to its robust design, stable measurement results, and relatively low maintenance cost.

However, despite its popularity, one question repeatedly arises during real-world use:

“Where do I set the temperature and drying time on the MB45?”
“There is no temperature knob or time button—are these functions missing or locked?”

In reality, the MB45 fully supports temperature and time control. The confusion does not stem from missing functionality, but from the menu logic and design philosophy of the instrument. Unlike simpler or older moisture analyzers, the MB45 does not expose temperature and time as standalone controls. Instead, they are embedded within a structured test parameter system.

This article provides a comprehensive, engineer-oriented explanation of how MB45 temperature and time settings work, how to adjust them correctly, and how to avoid the most common operational mistakes—based on actual device behavior rather than a simple manual rewrite.


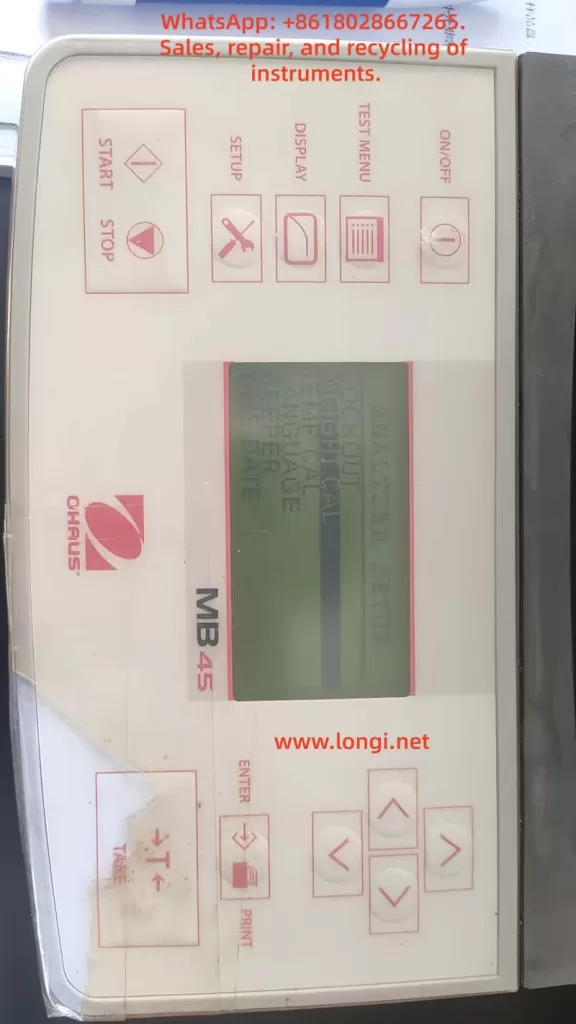
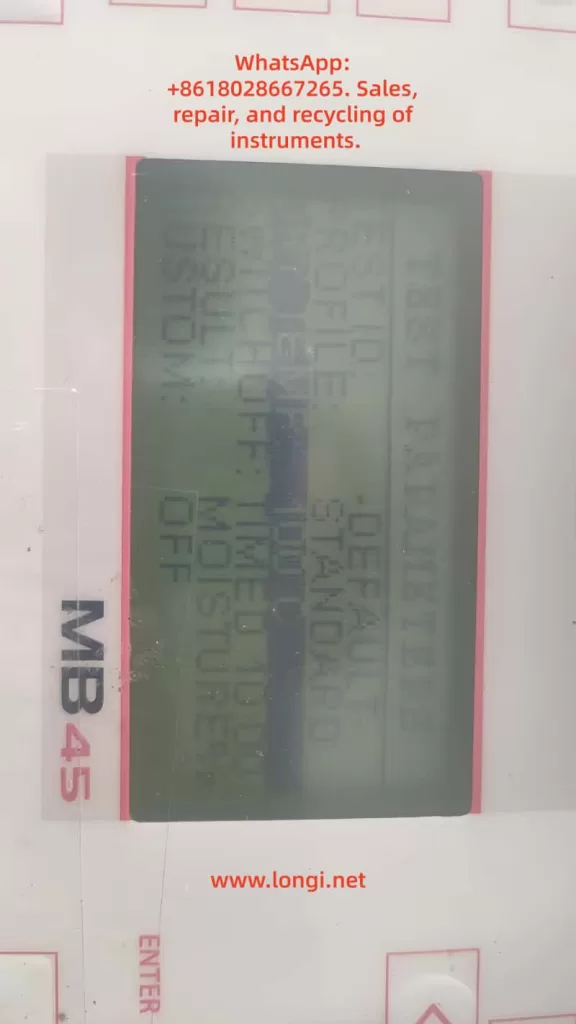
analyzer setup menu of MB45

2. Core Design Philosophy of the MB45: Test-Centered Parameter Control

2.1 The MB45 Is Not a “Direct-Adjustment” Instrument

Many users expect to adjust temperature and time directly from the main screen, as they would on older or entry-level moisture analyzers. The MB45, however, is designed around test methods, not individual parameters.

In the MB45:

  • Temperature is not an independent setting
  • Time is not always visible
  • All critical parameters belong to a test definition

In other words:

Temperature and time only exist in the context of a test method.


2.2 Understanding the MB45 Menu Architecture

The MB45 menu system can be logically divided into three levels:

  1. System Setup (SETUP)
    • Display options
    • Units
    • General instrument configuration
  2. Test Management (TEST MENU / TEST LIBRARY)
    • Create tests
    • Recall saved tests
  3. Test Parameters (TEST PARAMETERS)
    • Drying profile
    • Final temperature
    • Shutoff condition (time, auto, manual)
    • Start weight

Temperature and time are both located in the third level: TEST PARAMETERS.

Failing to recognize this structure is the primary reason users believe the instrument lacks these controls.


3. Temperature Setting Explained: FINAL TEMP

3.1 Where Is the Temperature Setting?

The correct navigation path is:

SETUP
→ TEST PARAMETERS
→ FINAL TEMP

Once “FINAL TEMP” is visible on the display, you are already in the correct configuration area.


3.2 What Does FINAL TEMP Actually Mean?

FINAL TEMP refers to:

  • The target temperature maintained by the heating system
  • The stable temperature reached during the drying process

It is not a ramp rate or an instantaneous value, but the steady-state operating temperature used for moisture removal.


3.3 How to Change FINAL TEMP

  1. Use the UP / DOWN keys to highlight FINAL TEMP
  2. Press ENTER
  3. The numeric value begins flashing
  4. Use arrow keys to increase or decrease the temperature
  5. Press ENTER again to confirm

3.4 Temperature Range and Resolution

  • Typical adjustable range: 50 °C to 200 °C
  • Adjustment resolution: 1 °C

It is important to note that higher temperature does not automatically produce better results. Excessive heat can cause thermal decomposition, oxidation, or spattering, leading to incorrect moisture readings.


4. Time Setting Explained: Why You “Can’t See” TIME

4.1 No Dedicated TIME Parameter by Default

One of the most misunderstood aspects of the MB45 is that time is not always displayed. This is intentional.

The MB45 determines test duration through a shutoff condition, not a universal timer.


4.2 Understanding SHUTOFF MODE

Navigation path:

SETUP
→ TEST PARAMETERS
→ SHUTOFF MODE

SHUTOFF MODE defines how the test ends, not how it starts.

Typical options include:

  • AUTO – automatic stability-based termination
  • TIME – fixed-time termination
  • MANUAL – operator-controlled termination

4.3 Why TIME Only Appears After Selecting TIME Mode

The TIME parameter is only visible after SHUTOFF MODE is set to TIME.

Correct procedure:

  1. Enter SHUTOFF MODE
  2. Select TIME
  3. Press ENTER
  4. The display now shows:TIME: 10:00
  5. Enter TIME again to modify minutes and seconds

This design ensures that time is only adjustable when it is actually used as the termination criterion.


TEST PARAMETERS MENU OF MB45

5. Common User Errors and Misinterpretations

Error 1: Assuming the Instrument Is Locked or Incomplete

Reality:
The user did not enter TEST PARAMETERS.


Error 2: Searching for Temperature or Time in DISPLAY Menu

DISPLAY controls visualization only.
No test parameters can be changed there.


Error 3: Expecting TIME to Appear Automatically

TIME is hidden unless SHUTOFF MODE is explicitly set to TIME.


Error 4: Pressing ENTER Without Selecting the Parameter Line

ENTER only works when a specific parameter line is highlighted.
This is often mistaken for a keypad fault.


Error 5: Believing the Instrument Is Defective

On older MB45 units, membrane keypad wear can reduce responsiveness, but in most cases the issue is navigation logic, not hardware failure.


6. Practical Engineering Recommendations

6.1 Typical Temperature Ranges by Material Type

Material TypeRecommended Temperature
Food powders105 °C
Chemical granules120 °C
Plastic pellets130–150 °C
Volatile samples≤ 80 °C

These values are practical starting points, not absolute rules. Validation testing is always recommended.


6.2 TIME vs AUTO: Which Should You Use?

  • R&D and formulation work: AUTO
  • Routine production testing: TIME
  • Incoming material inspection: TIME with fixed sample mass

AUTO mode offers higher analytical precision, while TIME mode offers repeatability and speed.


6.3 Use the Test Library Whenever Possible

Once a test method is properly configured:

  • Save it to the test library
  • Recall it directly for future measurements
  • Eliminate operator variability

This practice is highly recommended in regulated or quality-controlled environments.


7. When Parameters Cannot Be Changed: A Diagnostic Checklist

If adjustments appear impossible:

  1. Confirm you are in TEST PARAMETERS, not DISPLAY
  2. Ensure the correct line is highlighted
  3. Press ENTER firmly and deliberately
  4. Check for keypad membrane aging
  5. Verify no unintended mode restrictions are active

Most issues are operational, not electronic.


8. Conclusion: Understanding the Logic Matters More Than Memorizing Steps

The OHAUS MB45 is not difficult to use—but it requires an understanding of its design logic.

Once the user understands that:

  • Temperature = FINAL TEMP
  • Time = SHUTOFF MODE → TIME

the instrument becomes predictable, reliable, and efficient.

For laboratory technicians, maintenance engineers, and equipment resellers, mastering this logic is far more valuable than simply knowing which buttons to press. It ensures consistent results, reduces errors, and improves long-term operational confidence.

Proper understanding transforms the MB45 from a “confusing device” into a dependable analytical tool suitable for daily professional use.

Posted on

HACH SC1000 Modbus Communication Data Error Troubleshooting

Mapping Table, Register Offset, and Engineering Recovery Guide

1. Introduction: When Modbus Communication Is “Online” but All Data Is Wrong

In industrial water quality monitoring systems, the HACH SC1000 controller is widely used to integrate pH, conductivity, dissolved oxygen, turbidity, COD, ammonia, and multi-parameter probes into centralized monitoring platforms.

Most SC1000 installations communicate with PLCs, DCS systems, or industrial PCs through RS485 Modbus RTU.

A common and extremely misleading field problem is:

The serial port is online, Modbus polling works, no communication alarms appear —
yet the values on the control system are completely wrong.

Typical symptoms include:

  • Some parameters always show 0
  • One parameter shows a “reasonable” value but appears under the wrong variable
  • Switching byte order suddenly produces very large or negative numbers
  • No communication timeout or CRC error exists

This type of fault is often misdiagnosed as:

  • Cable interference
  • RS485 wiring error
  • Baud rate or parity mismatch
  • Sensor failure

However, in real engineering practice, if communication is stable but data is logically wrong, the root cause is almost never the physical layer.

It is almost always a Modbus register mapping structure problem.

This article provides a systematic engineering analysis based on a real SC1000现场案例, and explains:

  • Why this problem happens
  • How to identify it correctly
  • How to recover the system
  • How to prevent it permanently

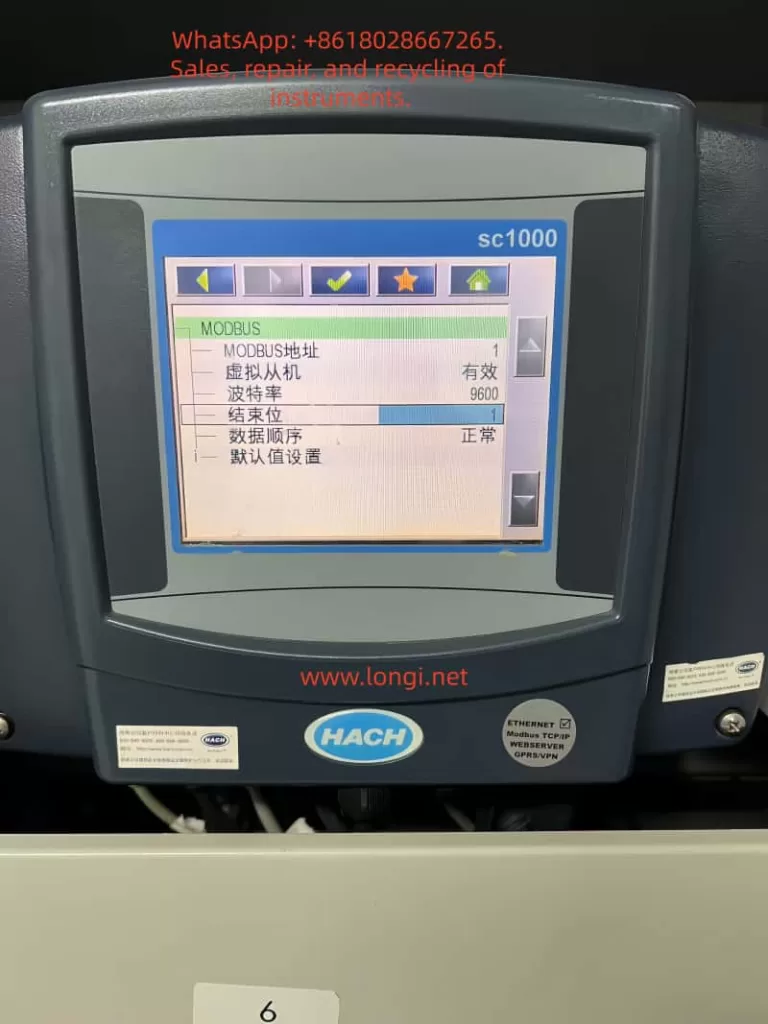
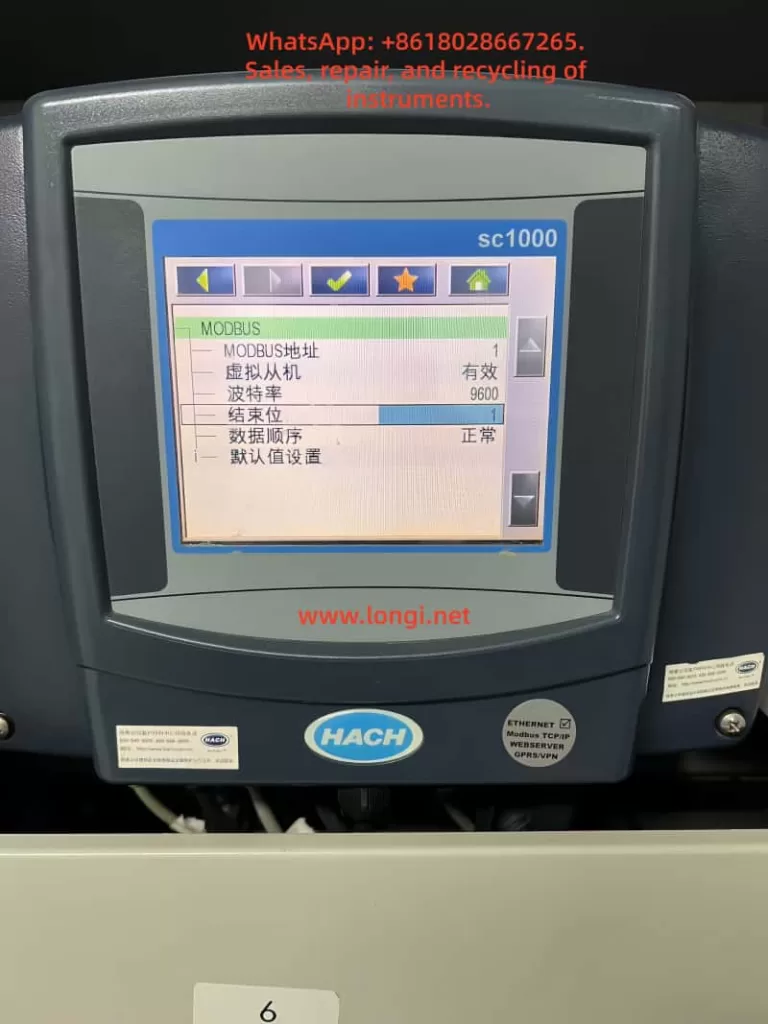
HACH SC1000 controller Modbus communication settings screen showing slave address, baud rate 9600, stop bit 1, and data order configuration for RS485 Modbus RTU

2. Understanding SC1000 Modbus Architecture: Not a Fixed Register Device

Many engineers assume that the SC1000 has a “fixed Modbus register table” like most simple instruments.

This assumption is incorrect.

The SC1000 is a modular multi-parameter platform, not a single-function transmitter.

Its Modbus output is built from three layers:

  1. Sensor layer (pH, LDO, conductivity, turbidity, etc.)
  2. Internal variable layer (measurement, temperature, status words, warning codes, error codes)
  3. Modbus publishing layer (mapping table / telegram table)

Only the third layer defines what the external system can see.

The SC1000 does not simply expose one permanent register table.
Instead, it dynamically generates a Modbus mapping table according to:

  • Installed sensor modules
  • Active variables
  • Engineering configuration
  • Default regeneration or manual editing

This mapping table controls:

  • Which variables are published
  • The order of variables
  • Register offsets
  • Data types (float / int)

Once this table changes, the PLC or industrial PC must follow it exactly.
If the control system continues reading the old structure, the data becomes meaningless.


Industrial HMI screen showing incorrect water quality data from HACH SC1000 via Modbus, with pH value displayed in wrong channel and multiple parameters showing zero readings

3. Typical Fault Characteristics of Mapping Table Failure

In the real case discussed, the control system showed:

  • pH ≈ 7.689 (correct value)
  • but it appeared under the wrong channel
  • most other channels were 0
  • changing data order produced huge or negative values

These symptoms form a very clear technical fingerprint.

3.1 Physical communication is normal

  • No timeout
  • No CRC alarm
  • Stable refresh
  • Values change consistently

This proves:

  • RS485 wiring is fine
  • Baud rate and framing are correct
  • Modbus RTU frames are valid

3.2 Logical structure is broken

  • Only one variable looks real
  • Others are zero or impossible
  • Changing byte order changes magnitude but not correctness

This proves:

  • The data exists
  • But registers are being interpreted using the wrong structure

This is a register mapping failure, not a communication failure.


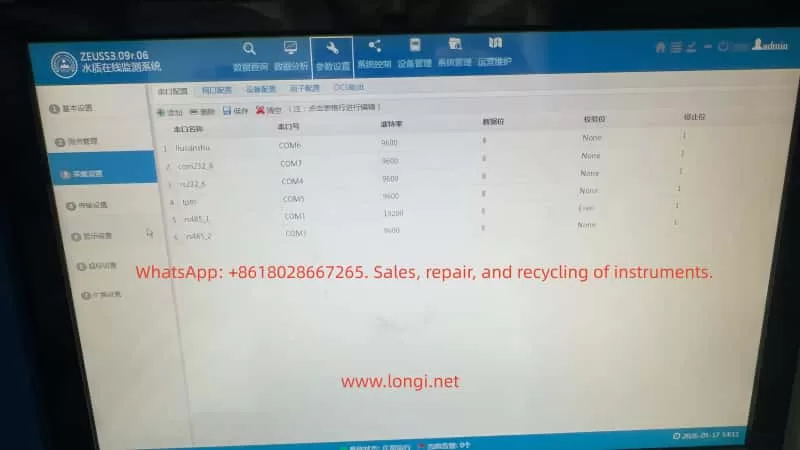
Water quality monitoring system device configuration interface listing HACH instruments connected via RS485, including SC1000, Hydrolab probes, and NPW analyzers for Modbus data acquisition

4. The Root Cause: SC1000 Modbus Mapping Table Has Changed

When the SC1000 Modbus variable list was inspected, it showed entries such as:

0   Temperature        float  
2   Error Code         int  
3   pH                 float  
5   pH                 float  
7   Status Word        int  
8   Device Warnings    int  
9   Device Errors      int  
10  pH                 float  

Two facts are immediately obvious:

4.1 Registers are not continuous

Offsets are:
0, 2, 3, 5, 7, 8, 9, 10 …

This means the table includes:

  • gaps
  • integer diagnostic registers
  • mixed data lengths

4.2 Data types are mixed

The table mixes:

  • float measurement values
  • int status words
  • int warning codes
  • int error codes

However, most engineering projects configure the PLC or IPC to read:

pH
temperature
conductivity
dissolved oxygen
turbidity

as continuous float values.

When the SC1000 mapping table reverts to a default or regenerated structure, while the control system still expects a continuous float table, the result is guaranteed misalignment.

This explains perfectly why:

  • one pH value appears in the wrong variable
  • all others become zero or nonsense

HACH SC1000 Modbus register mapping table showing mixed float and integer variables such as pH, temperature, device warnings, and error codes, illustrating Modbus telegram structure

5. Why This Happens After “Just Viewing Parameters”

The SC1000 contains configuration functions such as:

  • Default value settings
  • Sensor reinitialization
  • Module scanning
  • Variable refresh

Any of the following actions may regenerate the Modbus table:

  • Installing or removing a probe
  • Entering and confirming default settings
  • Saving sensor configuration
  • Rebuilding internal variable lists

If the operator enters these menus and confirms with “OK”, the SC1000 may:

  • rebuild its internal object list
  • regenerate the Modbus publishing table
  • restore factory mapping structure

Once this happens, the control system is immediately out of sync.

This is why many field failures occur suddenly after “only checking parameters”.


6. Systematic Engineering Troubleshooting Process

Step 1: Eliminate physical communication faults

Confirm:

  • No Modbus timeout
  • No CRC errors
  • Stable refresh rate
  • Values change logically

If true → proceed to logical structure analysis.


Step 2: Verify whether mapping misalignment exists

Indicators:

  • One real value appears under wrong tag
  • Many values are zero
  • Switching byte order only changes magnitude

If present → mapping table problem confirmed.


Step 3: Inspect SC1000 Modbus variable table

Navigate to:

Fieldbus → Modbus → Sensor → Variables / Telegram / Register list

Check:

  • Offsets
  • Order
  • Data types
  • Diagnostic registers presence

Step 4: Compare with PLC / IPC Modbus configuration

Confirm for each channel:

  • Function code (03 / 04)
  • Register address
  • Data length (1 or 2 registers)
  • Data type (float / int)

If PLC expects continuous floats while SC1000 outputs mixed types, misalignment is guaranteed.


7. Engineering Recovery Methods

Method A – Restore original SC1000 mapping (Recommended)

If any original documents exist:

  • commissioning sheet
  • Modbus register list
  • integrator documentation
  • screenshots

Use them to rebuild the SC1000 mapping:

  • remove diagnostic registers
  • publish only process values
  • arrange continuous floats

This keeps the control system unchanged.


Method B – Rebuild a new engineering mapping table

If no documentation exists, rebuild on site.

Recommended industrial structure:

0   pH              float
2   Temperature     float
4   Conductivity    float
6   Dissolved O2    float
8   Turbidity       float
10  COD             float

Principles:

  • Only process variables
  • Only float
  • Continuous order
  • No status words

Once published, adjust PLC addresses to match.


Method C – Modify PLC Modbus configuration

This is least preferred.

It requires:

  • remapping every channel
  • reinterpreting data types
  • rebuilding alarms and scaling

It increases long-term maintenance risk.


8. How to Prevent This Failure in Engineering Projects

8.1 Always export Modbus mapping tables

Every SC1000 project must include:

  • printed mapping table
  • Excel documentation
  • commissioning photos

The Modbus table is as important as PLC code.


8.2 Treat “default settings” as dangerous operations

Default or regeneration functions should be restricted and documented.


8.3 Check mapping after probe replacement

Any sensor change may rebuild internal variables.

Mapping verification must become a maintenance step.


8.4 Establish dual-side backups

  • SC1000 parameter backup
  • PLC project backup

This prevents catastrophic configuration drift.


9. Conclusion

When HACH SC1000 Modbus communication shows:

  • online communication
  • wrong values
  • variable displacement
  • zero readings

the correct engineering conclusion is:

This is not a communication problem.
This is a Modbus mapping structure problem.

The SC1000 is not a fixed-register device.
Its Modbus output is an engineering-level data structure.

Once the mapping table changes, the control system must change with it — or the data becomes meaningless.

The real solution is not changing baud rate, cables, or parity.
The real solution is:

  • inspecting the mapping table
  • understanding register structure
  • rebuilding engineering-grade Modbus telegrams.
Posted on

HACH SC1000 Water Quality Analyzer Controller User Guide

Introduction

The HACH SC1000 Water Quality Analyzer Controller is a high-precision, multi-parameter monitoring platform widely used in drinking water treatment, industrial wastewater treatment, and environmental monitoring applications. Designed as a modular and scalable controller, the SC1000 supports multiple digital sensors and communication options, enabling centralized monitoring and control of complex water quality systems.

This user guide provides a comprehensive overview of the SC1000 controller, including product features, installation procedures, operating instructions, and maintenance guidelines, to help users deploy and operate the system efficiently and reliably.


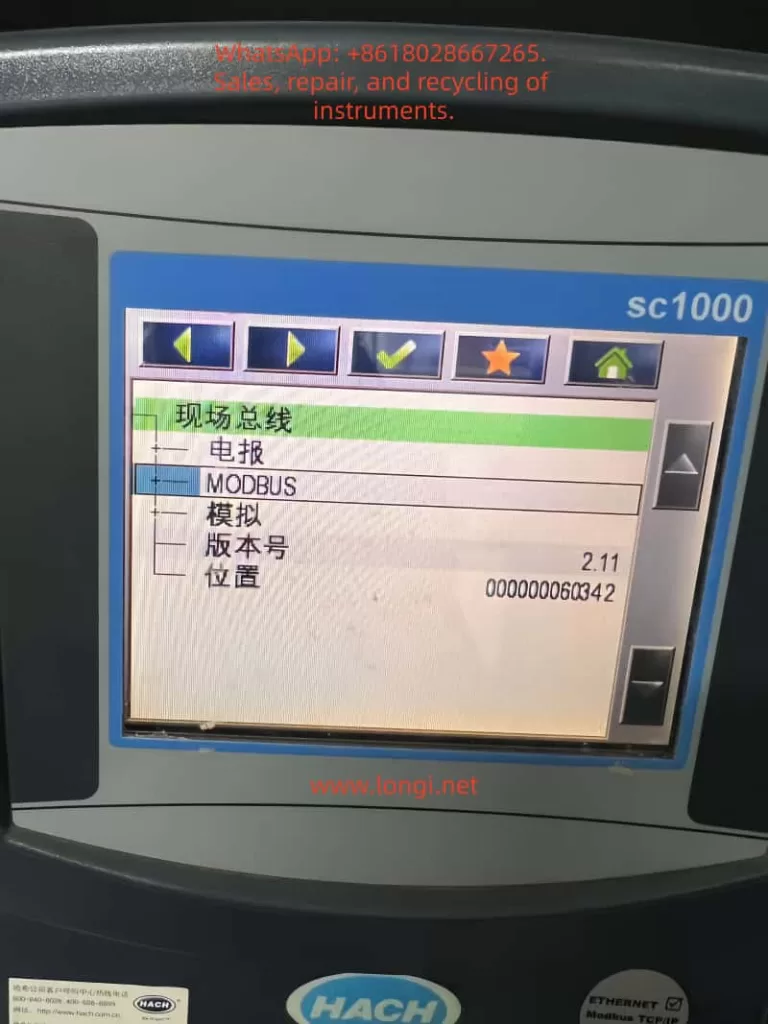
SC1000 controller MODBUS settings screen on HACH water analyzer

1. Product Overview

1.1 Key Features

The SC1000 is a menu-driven, modular multi-parameter controller with the following core advantages:

  • Multi-parameter monitoring: Supports simultaneous connection of multiple digital sensors such as pH, dissolved oxygen, conductivity, turbidity, chlorine, and more.
  • High-accuracy measurement: Advanced digital signal processing ensures stable, precise, and repeatable measurements.
  • Modular expansion: Supports plug-in communication cards, analog/digital I/O cards, and relay modules.
  • User-friendly interface: Color display with intuitive menu navigation and on-screen configuration.
  • Remote monitoring capability: Supports Ethernet and fieldbus modules for remote data access and system integration.

1.2 System Components

A standard SC1000 system typically consists of:

  • Display module: Color display unit for real-time values, alarm status, and system configuration.
  • Probe (controller) module: Core processing unit for sensor communication, data acquisition, and output control.
  • Expansion cards: Including relay cards, analog input/output cards, and digital or fieldbus communication modules.
  • Power and accessories: Power cables, fuses, mounting brackets, terminal blocks, and communication cables.

2. Installation Guide

2.1 Pre-installation Checklist

Before installation, verify the following:

  • All components are complete and undamaged.
  • The installation environment is dry, well ventilated, and free of strong electromagnetic interference.
  • Adequate space is reserved for cable routing, ventilation, and maintenance access.
  • Required tools are prepared (screwdrivers, drill, mounting hardware, cable glands, etc.).

2.2 Mechanical Installation

2.2.1 Dimensions and Space Requirements

  • Display unit: approximately 200 × 230 × 50 mm
  • Probe module: approximately 315 × 255 × 120 mm (excluding display)
  • Clearance requirements:
    • At least 5 cm clearance on sides and top for heat dissipation
    • At least 15 cm clearance at the bottom for wiring

2.2.2 Wall-mount Installation

  1. Mark mounting hole positions on the wall according to the backplate.
  2. Drill holes and insert expansion anchors.
  3. Hang the controller on the mounting screws.
  4. Secure the bottom screws and verify the unit is firmly fixed.

2.2.3 Pipe or Panel Mounting

  • Use the official HACH mounting kit.
  • Install the brackets securely on horizontal or vertical pipes.
  • Ensure vibration is minimized and cables are properly strain-relieved.

2.3 Electrical Installation

2.3.1 Power Supply Connection

The SC1000 supports both AC and DC power input:

  • AC power: 100–240 VAC, 50/60 Hz
  • DC power: 24 VDC (18–30 VDC range)

Installation procedure:

  1. Disconnect all power sources before wiring.
  2. Remove the probe module cover and safety barrier.
  3. Route the power cable through the sealed cable gland.
  4. Connect the power wires to the designated terminals.
  5. Reinstall the safety barrier and enclosure cover.

2.3.2 Expansion Card Wiring

Relay modules

  • Disconnect power before installation.
  • Remove the relay cover.
  • Wire alarm or control loads according to the terminal diagram.
  • Verify correct NO/NC selection and tighten all screws.

Analog / digital I/O cards

  • Connect signal cables according to the card type (4–20 mA, digital input, digital output).
  • Use shielded cables where possible.
  • Ground shields at one end only to avoid ground loops.

2.4 Network and Sensor Connection

The SC1000 uses a digital network bus to connect probe modules and sensors.

Installation steps:

  1. Strip and prepare the network cable.
  2. Connect the wires to the communication terminal block.
  3. Secure the connector and install termination resistors if required.
  4. Insert the connector into the probe module network port.
  5. Power on the system and verify sensor recognition.

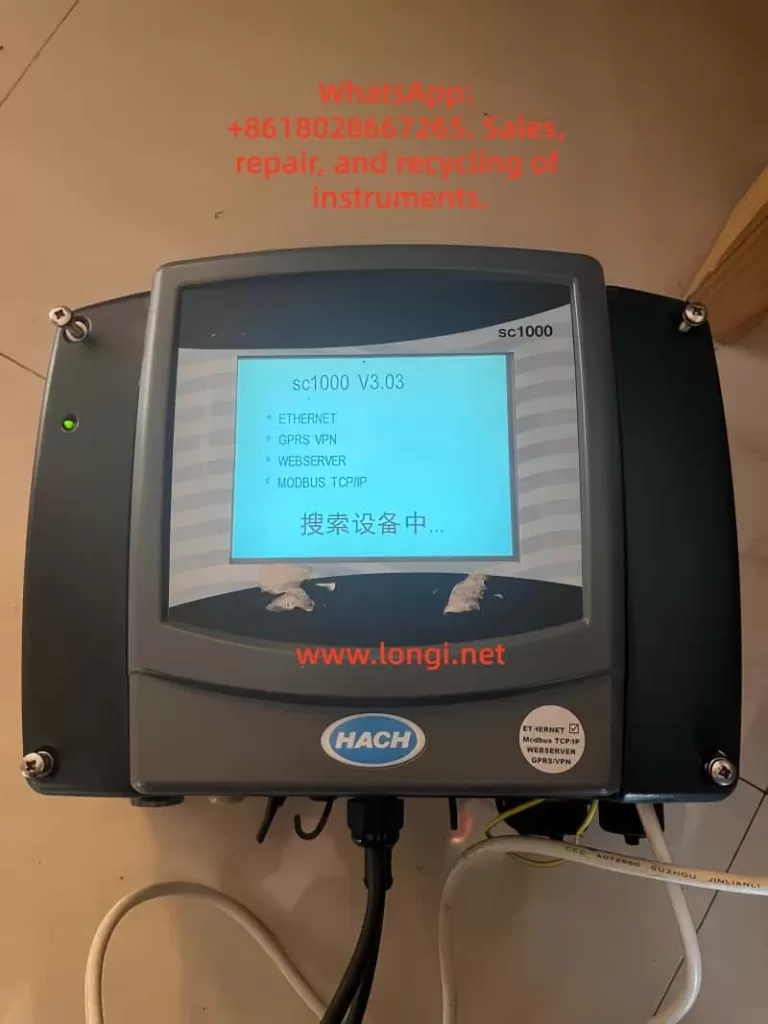
HACH SC1000 controller front panel and touchscreen interface

3. Operating Instructions

3.1 Display and Interface Operation

3.1.1 Touchscreen Calibration

Touchscreen calibration is recommended during initial commissioning or after display replacement.

Procedure:

  • Enter System Settings → Display Settings → Touchscreen Calibration
  • Follow on-screen instructions and confirm calibration points.

3.1.2 Menu Navigation

The main menu provides access to:

  • Sensor status
  • Measurement values
  • Configuration and calibration
  • Outputs and alarms
  • System diagnostics

Navigation is performed using on-screen icons and soft keys.


3.2 Sensor Management

3.2.1 Sensor Status Monitoring

  • View real-time measurements for each connected sensor.
  • Check diagnostic messages, warnings, and error codes.
  • Confirm communication and sensor health status.

3.2.2 Sensor Configuration

Within the sensor menu, users can configure:

  • Measurement units
  • Calibration parameters
  • Alarm thresholds
  • Output assignments
  • Temperature compensation and filtering

Always follow sensor-specific manuals when performing calibration.


3.3 System Configuration

3.3.1 Output Settings

  • Configure analog outputs (for example, 4–20 mA)
  • Assign outputs to specific parameters
  • Define scaling ranges, damping time, and failure behavior

3.3.2 Relay Settings

  • Assign relays to alarms, setpoints, or system events
  • Configure activation logic, delays, and hysteresis
  • Test relay actions before commissioning

3.3.3 Communication and Network Settings

  • Set Modbus address and baud rate
  • Configure Ethernet or fieldbus parameters
  • Verify data format consistency with PLC or SCADA systems

4. Maintenance and Troubleshooting

4.1 Routine Maintenance

  • Inspect enclosures for dust, corrosion, or moisture ingress.
  • Verify all terminals and connectors are secure.
  • Clean the display and housing with a soft, damp cloth.
  • Perform periodic sensor calibration according to application requirements.

4.2 Fuse Replacement

Before replacing fuses, disconnect all power sources.

Typical fuse types include slow-blow fuses such as M3.5A or T8A (refer to the nameplate).

Procedure:

  1. Remove the probe module cover.
  2. Take out the damaged fuse.
  3. Insert a fuse with identical rating.
  4. Reinstall covers and restore power.

4.3 Common Faults and Solutions

No display or no power

  • Check power supply voltage.
  • Inspect fuses and terminal connections.

Unstable or abnormal readings

  • Check sensor wiring and connectors.
  • Perform recalibration.
  • Inspect sensors for fouling or damage.

Communication errors

  • Verify address, baud rate, and protocol settings.
  • Inspect network cables and termination.
  • Check expansion cards and power stability.

5. Conclusion

The HACH SC1000 controller is a powerful and flexible water quality monitoring platform suitable for both industrial and municipal applications. With proper installation, configuration, and maintenance, the SC1000 provides reliable long-term performance and accurate multi-parameter measurement.

By following the procedures and best practices described in this guide, users can ensure stable system operation, accurate data acquisition, and efficient troubleshooting.

Posted on

Partech 750w² Monitor Manual Usage Guide

Introduction

In the modern industrial and environmental monitoring sectors, water quality monitoring is a crucial link to ensure production safety, environmental protection, and efficient resource utilization. The Partech 750w² Monitor, as a high-performance, multi-parameter water quality monitoring device, is widely used across various industries such as wastewater treatment, food processing, papermaking, and mining due to its high accuracy, ease of operation, and comprehensive functionality. This guide aims to provide users with a comprehensive and practical manual for operating the Partech 750w² Monitor by thoroughly interpreting its manual, covering instrument operations, sensor calibration, maintenance, and troubleshooting.

 Partech 750w² Monitor and sensor

I. Instrument Overview

1.1 Product Introduction

The Partech 750w² Monitor is a high-precision water quality monitoring device that integrates data acquisition, processing, display, and transmission. It supports use with various Partech WaterWatch² series sensors, enabling real-time monitoring of multiple key water quality parameters such as suspended solids (SS), dissolved oxygen (DO), and temperature. The instrument features a compact design and a user-friendly interface, making it suitable for various field environments.

1.2 Key Features

  • High-Precision Measurement: Utilizes advanced sensing technology and signal processing algorithms to ensure data accuracy.
  • Multi-Parameter Monitoring: Supports simultaneous monitoring of suspended solids, dissolved oxygen, temperature, and other parameters.
  • Flexible Configuration: Configurable with different sensors and measurement ranges based on user needs.
  • Data Recording and Transmission: Built-in data recorder with USB data transmission capability for easy data analysis and processing.
  • User-Friendly Operation: Intuitive display and simple keypad design for convenient operation.

II. Basic Operations

2.1 Power On/Off

To power on the instrument, simply press the On/Off button on the front panel, and the instrument will automatically enter measurement mode. When finished measuring or needing to turn off the instrument, press and hold the On/Off button until the screen turns off to complete the shutdown process.

2.2 Measurement Mode

In measurement mode, the instrument displays the current sensor readings in large numerals. The display also includes a status bar showing battery status, instrument settings, and other key information. Users can perform the following operations to further process measurement data:

  • Save Readings: Press the OK key in measurement mode to save the current sensor reading, time, and date. The status bar briefly displays “Saving” to confirm data storage.
  • View Recorded Data: Access the Recorded Data menu to view previously saved sensor readings.

2.3 Menu Navigation and Configuration

The instrument features an intuitive menu system for easy configuration and operation.

  • Access Main Menu: Press the Menu key in measurement mode to enter the main menu.
  • Select Options: Use the arrow keys to browse and select desired options in the main menu, then press the OK key to confirm.
  • Return to Measurement Mode: The instrument automatically returns to measurement mode after 60 seconds of inactivity in any non-measurement mode.
 Partech 750w² Monitor

III. Sensor Calibration

Accurate sensor calibration is crucial for ensuring reliable measurement data. The Partech 750w² Monitor supports calibration of suspended solids and dissolved oxygen sensors.

3.1 Suspended Solids Sensor Calibration

3.1.1 Zero Calibration

Zero calibration is the first step in the calibration process, used to eliminate baseline readings when no suspended solids are present.

  • Steps:
    1. Immerse the sensor in clean water, using a dark container to minimize ambient light interference.
    2. Enter the main menu, select Measurement Config, and then select Suspended Solids.
    3. Choose the Set Zero function, wait for the reading to stabilize, and press the OK key to complete zero calibration.

3.1.2 Set Measurement Range (Set Cal)

Setting the measurement range ensures accurate sensor measurements within the expected concentration range.

  • Steps:
    1. Determine the maximum expected concentration value for suspended solids based on your application.
    2. In the Measurement Config menu, select the Set Cal function.
    3. Use the arrow keys to adjust the measurement range to the maximum expected concentration value and press the OK key to confirm.

3.1.3 Take Sample for Calibration

When the exact value of the calibration solution is unknown, use the Take Sample function.

  • Steps:
    1. Immerse the sensor in a representative sample.
    2. In the Measurement Config menu, select the Take Sample function.
    3. Wait for calibration to complete; the instrument displays a calibration success message.

3.2 Dissolved Oxygen Sensor Calibration

3.2.1 100% Open Air Calibration

Dissolved oxygen sensor calibration is typically performed in open air to ensure accurate measurement of dissolved oxygen concentration in water.

  • Steps:
    1. Ensure the sensor is in a draft-free environment to avoid interference.
    2. Enter the main menu, select Measurement Config, and then select DO Saturation.
    3. Choose the Calibrate function, wait for the saturation percentage to reach approximately 90%, and press the OK key to complete calibration.

IV. Advanced Configuration and Features

In addition to basic measurement and calibration functions, the Partech 750w² Monitor offers numerous advanced configuration options and features to meet diverse user needs.

4.1 Site Management

The Site Management feature allows users to configure independent calibration values and settings for different monitoring locations. This is particularly useful for applications requiring simultaneous monitoring at multiple sites.

  • Add Site: In the main menu, select Sites, then Add Site, enter the site name, and confirm.
  • Delete Site: In the Sites menu, select Delete Site, choose the site to delete, and confirm.
  • Edit Site Name: In the Sites menu, select Edit Site Name, modify the site name, and confirm.

4.2 Data Recording and Transmission

4.2.1 Data Recording

The instrument’s built-in data recorder automatically logs sensor readings. Users can view recorded data through the Recorded Data menu.

  • View Recorded Data: Press the OK key in measurement mode to enter the Recorded Data menu and browse recorded data.

4.2.2 Data Transmission

The instrument supports USB data transmission to a PC for further analysis.

  • Connect to PC: Use the provided USB cable to connect the instrument to a PC.
  • Data Transmission: The instrument appears as a USB storage drive on the PC. Access the DataRecordings folder to view and copy data files.

V. Maintenance and Troubleshooting

To ensure long-term stable operation of the instrument, users should perform routine maintenance and promptly troubleshoot any issues that arise.

5.1 Routine Maintenance

  • Clean Sensors: Regularly clean the sensor surface to ensure measurement accuracy. Use a soft cloth to gently wipe the sensor surface, avoiding chemical cleaners.
  • Check Battery: Ensure the battery is adequately charged and avoid using the instrument with a low battery. If the instrument is not used for an extended period, remove the battery and store it properly.
  • Storage Environment: Store the instrument in a dry, ventilated, and shaded environment, avoiding extreme temperatures and humidity. Do not expose the instrument to direct sunlight or damp conditions.

5.2 Troubleshooting

Although the Partech 750w² Monitor is designed for reliability, users may encounter occasional issues. Here are some common problems and their solutions:

5.2.1 Unable to Power On

  • Check Battery: Confirm the battery is correctly installed and adequately charged. If the battery is low, charge it before use.
  • Check Power Adapter: If using an external power adapter, confirm it is functioning correctly and properly connected. Try using another power adapter or socket for testing.

5.2.2 Inaccurate Measurement Data

  • Check Sensors: Confirm the sensor is undamaged and properly connected. Check for loose or damaged sensor cables and reconnect them.
  • Recalibrate: Recalibrate the sensor following the calibration steps in the manual. Ensure all instructions are followed during calibration and use the correct calibration solution.

5.2.3 Data Transmission Failure

  • Check USB Connection: Confirm the USB cable is securely connected and the PC’s USB port is functioning correctly. Try using another USB cable or port for testing.
  • Check Data Files: Confirm the data files in the DataRecordings folder are not corrupted. If corrupted, try retransmitting data from the instrument.

VI. Firmware Updates

To ensure instrument performance stability and continuous functionality optimization, it is recommended to regularly update the instrument firmware. Firmware updates can fix known issues, add new features, or improve instrument performance.

  • Pre-Update Preparation: Ensure the instrument is adequately charged and back up important data. Do not disconnect the instrument from the PC or turn off the power during the update process.
  • Update Steps:
    1. From the Monitor Config menu, select Update Monitor F/W.
    2. Copy the BIN file containing the firmware update to the root directory of the instrument. Ensure the file name is correct and unmodified.
    3. Confirm there is only one BIN file on the instrument and press the OK key to begin the update. The instrument displays the update progress during the process.
    4. Wait for the update to complete; the instrument automatically restarts. After restarting, check that the instrument functions normally.

VII. Conclusion

The Partech 750w² Monitor, as a high-performance water quality monitoring device, is widely used across various industries due to its high accuracy, ease of operation, and comprehensive functionality. Through this detailed guide, users should now have a comprehensive understanding of instrument operations, sensor calibration, maintenance, and troubleshooting. In practical applications, it is recommended to strictly follow the instructions in the manual for operation and maintenance to ensure long-term stable operation of the instrument and accuracy of measurement data.

Furthermore, as technology continues to evolve, Partech may introduce more innovative products and technical support services. Users should stay informed by regularly checking Partech’s official website or contacting customer service for the latest product information and technical support. Through continuous learning and practice, users will be better equipped to utilize the Partech 750w² Monitor for water quality monitoring, contributing to environmental protection and resource utilization.

Posted on

Understanding the “O2 Sensor 0 Days Remaining” Message on HACH HQ40d Analyzers — Mechanism, Root Cause, and Engineering Solutions for LDO Dissolved Oxygen Probes


1. Introduction: What Does “O2 Sensor 0 Days Remaining” Really Mean?

When operating a HACH HQ40d portable multi-parameter analyzer equipped with an LDO101 / LDO10101 dissolved oxygen (DO) probe, users may encounter the on-screen message:

“O2 Sensor 0 days remaining.”

This message often causes confusion among field engineers, laboratory technicians, and equipment resellers. It is frequently misinterpreted as a probe failure, instrument malfunction, or electronic defect. In reality, this message is not a fault code. It is a consumable lifetime notification.

The message indicates that the luminescent sensor cap installed on the LDO probe has reached the end of its manufacturer-defined service life.


O2 Sensor 0 days remaining

2. LDO Technology: Why These Sensors Are Different

To understand this message, it is essential to distinguish LDO (Luminescent Dissolved Oxygen) sensors from traditional electrochemical DO electrodes.

2.1 Conventional DO electrodes

Traditional Clark-type electrodes rely on:

  • Anode and cathode systems
  • Electrolyte solution
  • Oxygen-permeable membranes

They consume oxygen during measurement and are sensitive to flow rate, membrane condition, and electrolyte aging.

2.2 LDO optical dissolved oxygen sensors

HACH’s LDO probes operate using optical fluorescence quenching technology. Blue light excites a luminescent material inside the sensor cap. Dissolved oxygen molecules quench the fluorescence. The instrument measures changes in fluorescence lifetime or phase shift to calculate oxygen concentration.

In this design, the active sensing element is not the probe body, but the luminescent sensor cap at the tip.


3. Physical Structure of an LDO101/LDO10101 Probe

An LDO probe can be functionally divided into three major sections:

  1. Probe body
    • LED excitation source
    • Photodetector
    • Temperature sensor
    • Signal processing electronics
  2. Luminescent sensor cap (consumable)
    • Luminescent dye layer
    • Oxygen diffusion layer
    • Protective optical coating
    • Integrated lifetime memory chip
  3. Cable and connector assembly

Only the sensor cap is subject to predictable chemical aging. The probe body itself is typically long-life.


LDO10101

4. Where Does the “Remaining Days” Value Come From?

Each genuine LDO sensor cap contains an internal memory device that stores:

  • Manufacturing data
  • Installation time
  • Operating lifetime
  • Calibration information

The HQ-series instruments periodically read this data and calculate the remaining validated service life. HACH specifies a typical service life of approximately one year for an LDO sensor cap.

When this counter reaches zero, the instrument displays:

“O2 Sensor 0 days remaining.”

This mechanism ensures data quality control and traceability rather than indicating immediate electrical failure.


5. Is This a Malfunction?

From an engineering standpoint, the answer is clear:

No. This is not a hardware fault.

It does not indicate:

  • Open or short circuits
  • Optical module failure
  • Communication errors
  • Mainboard defects
  • Loss of sensor detection

It indicates that the sensor cap has exceeded the period over which the manufacturer guarantees accuracy and response performance.


6. Can the Instrument Still Measure?

6.1 Functional perspective

In most firmware versions, the instrument will continue to display DO readings. The probe may still respond to oxygen changes.

However, after the luminescent material ages:

  • Fluorescence intensity decreases
  • Signal-to-noise ratio degrades
  • Response time increases
  • Temperature compensation accuracy declines

6.2 Engineering and compliance perspective

For regulated environments, laboratories, environmental monitoring projects, or contract testing, continued operation beyond the rated life is not acceptable. Measurement data may no longer meet quality or traceability requirements.

In such contexts, replacement of the sensor cap is mandatory.


7. Can the LDO10101 Sensor Cap Be Replaced?

Yes. The LDO system is designed around a replaceable sensor cap architecture.

The luminescent cap is a standard consumable component supplied by the manufacturer. Replacement does not require probe disassembly or electronic repair. Once a new cap is installed, the instrument automatically recognizes the new lifetime chip.

After replacement, the remaining life counter resets and the probe must be recalibrated.


8. Standard Replacement and Recovery Procedure

A professional maintenance workflow includes:

  1. Removing the expired sensor cap
  2. Installing a new genuine luminescent sensor cap
  3. Powering the instrument and verifying cap recognition
  4. Performing full dissolved oxygen calibration
    • Air-saturated calibration or
    • Water-saturated calibration

Calibration is essential because optical compensation coefficients are cap-specific.


9. Economic and Project-Level Considerations

Unlike traditional membrane kits, LDO sensor caps represent a higher-value consumable. Market pricing typically places them in the hundreds of US dollars per unit range.

This creates an important engineering reality:

The main operational cost of LDO dissolved oxygen probes is concentrated in the sensor cap, not in the probe body.

Therefore, during:

  • Instrument procurement
  • Maintenance planning
  • Project bidding
  • Second-hand equipment evaluation

the remaining sensor cap lifetime must be treated as a critical parameter.


10. Common Misdiagnoses in the Field

In service and resale environments, this message is often incorrectly interpreted as:

  • Probe failure
  • Instrument motherboard defects
  • Software malfunction
  • Optical module damage

Such misinterpretations frequently lead to unnecessary disassembly or replacement of functional hardware.

The correct diagnostic conclusion is always:

Consumable lifetime expiration, not electronic failure.


11. Implications for Service Engineers and Equipment Resellers

For technical service teams and secondary-market suppliers, the “0 days remaining” message provides immediate insight into the true maintenance status of a dissolved oxygen system.

An instrument showing this message should be classified as:

“Operational, but requiring consumable replacement before certified use.”

Failure to communicate this condition to end users may result in incorrect pricing, unexpected operating costs, or post-sale disputes.


12. Design Perspective: Why Manufacturers Use Lifetime-Managed Sensor Caps

The LDO approach delivers clear advantages:

  • No oxygen consumption
  • Reduced flow dependency
  • Lower drift compared to electrochemical electrodes
  • Simplified routine maintenance

However, these advantages require:

  • Precisely formulated luminescent materials
  • Strict optical stability control
  • Integrated lifetime monitoring

Modern analytical instrumentation increasingly adopts this model: long-life core hardware combined with digitally managed consumables.


13. Conclusion

When a HACH HQ40d analyzer displays:

“O2 Sensor 0 days remaining,”

the engineering meaning is unequivocal:

The luminescent sensor cap on the LDO10101 dissolved oxygen probe has reached the end of its validated service life. The probe itself is not defective. Replacement of the sensor cap, followed by proper calibration, is the correct and complete solution.

This message represents a maintenance requirement, not a hardware failure.

Posted on

Analysis of the Reasons Why ABB EL3020 Infrared Analyzer Cannot Enter Manual Zero/Span Calibration and Engineering Solutions

I. Problem Background and On-site Phenomena

ABB EL3020 infrared gas analyzers are widely used in industrial flue gas analysis, process gas monitoring, and environmental online monitoring systems for the continuous measurement of gases such as CO, CO₂, SO₂, and NOx. They feature both automatic and manual calibration functions. During on-site operation and maintenance, it is common to encounter a situation where, despite having introduced zero gas and span calibration gas in preparation for manual calibration, when accessing the “Manual Calibration” menu, the instrument interface displays the message “ATTENTION: Autocalibration is running!”. At this point, the zero and span calibration menus cannot be accessed, and the buttons cannot be used to select calibration items. The instrument appears to be “stuck” on the calibration interface, leading customers to mistakenly assume it is a system crash, panel failure, or software anomaly. In reality, this is due to the normal operation of the EL3020’s internal calibration logic.

 Autocalibration is running
EL3020

II. Overview of the EL3020 Calibration System

The EL3020 belongs to the ABB EasyLine/EL3000 series, and its calibration modes are divided into two categories: automatic calibration and manual calibration, with the system design following an exclusion principle.

1. Automatic Calibration

  • Characteristics: It can be executed periodically at set times (e.g., once a day or once a week), triggered by external signals (such as from a PLC, digital input (DI), or Modbus), or initiated automatically after power-on. It automatically completes zero and span calibrations and controls the switching of calibration gases using solenoid valves.
  • Purpose: To ensure the long-term stable operation of the analyzer without human intervention, preventing measurement errors caused by optical drift and environmental changes.

2. Manual Calibration

  • Usage: It is used for initial installation and commissioning, after replacing components such as the optical module, for calibration gas comparison, post-repair calibration, and abnormal correction.
  • Operation: It is carried out by engineers on-site and requires human confirmation of zero gas, span gas, and stabilization time, among other factors.

3. Exclusion Principle

During automatic calibration, the manual calibration function is forcibly locked by the system to prevent the simultaneous writing of calibration parameters by automatic and manual processes, interference with the calibration process by human actions, and measurement inaccuracies caused by parameter confusion.

III. Meaning of the “Autocalibration is running” Status

When the EL3020 displays “Autocalibration is running”, it does not necessarily mean that the device is actively switching solenoid valves to introduce calibration gases. Instead, it indicates that the system’s automatic calibration process is in an incomplete state, which may result from the following situations:

1. Automatic Calibration is Actually in Progress

For example, when the instrument has just been powered on, when it has reached the scheduled time for automatic calibration, or when an external PLC has just triggered a calibration signal. At this time, the instrument is undergoing processes such as gas circuit switching, sensor stabilization, zero-point collection, span collection, data calculation, and storage. Manual calibration is locked until these processes are completed.

2. Automatic Calibration was Interrupted, and the Status was Not Reset (Most Common)

During the calibration process, sudden power outages, insufficient calibration gas pressure, gas circuit blockages or leaks, abnormal optical module signals, premature termination by operators, or abnormal external control signals can cause the automatic calibration process to be incomplete. As a result, the system’s “calibration status bit” remains in the “running” state, and the menu is locked.

3. The Preconditions for Automatic Calibration Are Not Met for an Extended Period

If the sensor signal remains unstable for a long time, the temperature or light intensity does not reach the stability threshold, the zero gas or span gas concentration is not within a reasonable range, or the flow rate is abnormal, the automatic calibration process will continue to wait for these conditions to be met, and the status will remain “running”.

Physical internal structure diagram of EL3020

IV. System Design Reasons

From the perspective of analyzer system safety, it is a reasonable design to lock manual calibration when automatic calibration is not completed. Writing parameters during automatic calibration while manual writing occurs can lead to EEPROM data conflicts. Forcing a span calibration before zero-point collection is completed can cause serious proportional errors. An incomplete automatic calibration indicates that the current parameters have unknown credibility. Forcibly opening the manual entry point can easily result in “the more adjustments, the more errors” situations. Therefore, the EL3020 adopts a “status lock” mechanism, and manual calibration will always be unavailable as long as the automatic calibration status is not cleared.

V. On-site Solutions

Engineering handling should follow the principle of “from software to hardware, from simple to complex”.

✅ Solution 1: Wait for the Automatic Calibration to Complete (Preferred)
When the device has just been powered on or an automatic calibration has just been triggered, ensure a normal supply of zero gas and span gas, and maintain stable flow, pressure, and temperature. Observe whether the status ends on its own. After the automatic calibration process is fully completed, the system will automatically release the manual calibration menu. This solution is suitable for newly commissioned instruments, normal periodic calibrations, and warm-up stages.

✅ Solution 2: Attempt to Abort the Automatic Calibration in the Menu
Some EL3000 series models support options such as “Abort Calibration” or “Stop Auto Calibration”. If such options are available in the menu, you can try to terminate the automatic process to make the system exit the “running” state. This solution is suitable for situations where the automatic calibration is obviously stuck, there is a history of human triggering, and you do not want to restart the device.

✅ Solution 3: Power Off and Restart (Most Common and Effective)
If the automatic calibration status cannot end on its own, stop the measurement, turn off the gas supply, and power off the instrument for at least 30 seconds. Then, power it back on, wait for the system to fully start up, and do not trigger the automatic calibration. Directly access the manual calibration menu. This solution is suitable for situations where the automatic calibration is abnormally interrupted, the menu is permanently locked, or the status is clearly abnormal.

✅ Solution 4: Eliminate the Root Cause of the Inability to Complete Automatic Calibration
If the device repeatedly enters the “Autocalibration is running” state and cannot end, you need to investigate the root cause. Focus on checking whether the zero gas is truly zero, whether the span gas concentration is correct, whether the gas circuit is blocked, whether the solenoid valves are functioning, whether the flow rate is stable, whether the sensor signal is within a reasonable range, and whether there are external signals continuously triggering calibration. Otherwise, even after a restart, the device may enter automatic calibration again and get stuck.

VI. Engineering Experience Summary

In the EL3020 and the entire EL3000 series, the inability to enter manual calibration is almost never due to a broken panel and rarely a true software fault. In most cases, it is caused by the “automatic calibration status not being cleared”. The handling logic is not about “how to access it” but rather figuring out why the system believes that automatic calibration has not ended, why automatic calibration cannot be completed normally, and how to make the automatic process end correctly or be reset.

VII. Summary

Currently, the instrument is in the automatic calibration state. According to ABB’s design logic, the system will forcibly lock the manual zero and span calibration menus until the automatic calibration is completed. This is not a fault but a protection mechanism. You need to first allow the automatic calibration to complete or clear the automatic calibration status through a restart before performing manual calibration.

VIII. Conclusion

The “Autocalibration is running” message on the EL3020 reflects the instrument’s internal calibration status management mechanism. Correctly understanding it helps engineering personnel quickly determine the nature of the problem, avoid盲目 (blindly) disassembling the instrument or mistakenly assuming damage to the main board, improve on-site fault handling efficiency, and reduce the secondary risks caused by misoperations. The key to solving the problem lies in understanding “why the automatic calibration has not ended”.