Posted on

Partech 750w² Monitor Manual Usage Guide

Introduction

In the modern industrial and environmental monitoring sectors, water quality monitoring is a crucial link to ensure production safety, environmental protection, and efficient resource utilization. The Partech 750w² Monitor, as a high-performance, multi-parameter water quality monitoring device, is widely used across various industries such as wastewater treatment, food processing, papermaking, and mining due to its high accuracy, ease of operation, and comprehensive functionality. This guide aims to provide users with a comprehensive and practical manual for operating the Partech 750w² Monitor by thoroughly interpreting its manual, covering instrument operations, sensor calibration, maintenance, and troubleshooting.

 Partech 750w² Monitor and sensor

I. Instrument Overview

1.1 Product Introduction

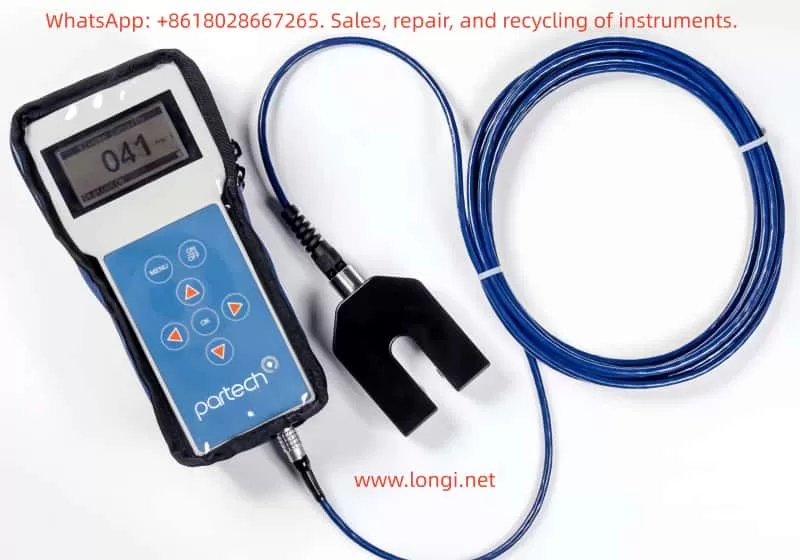
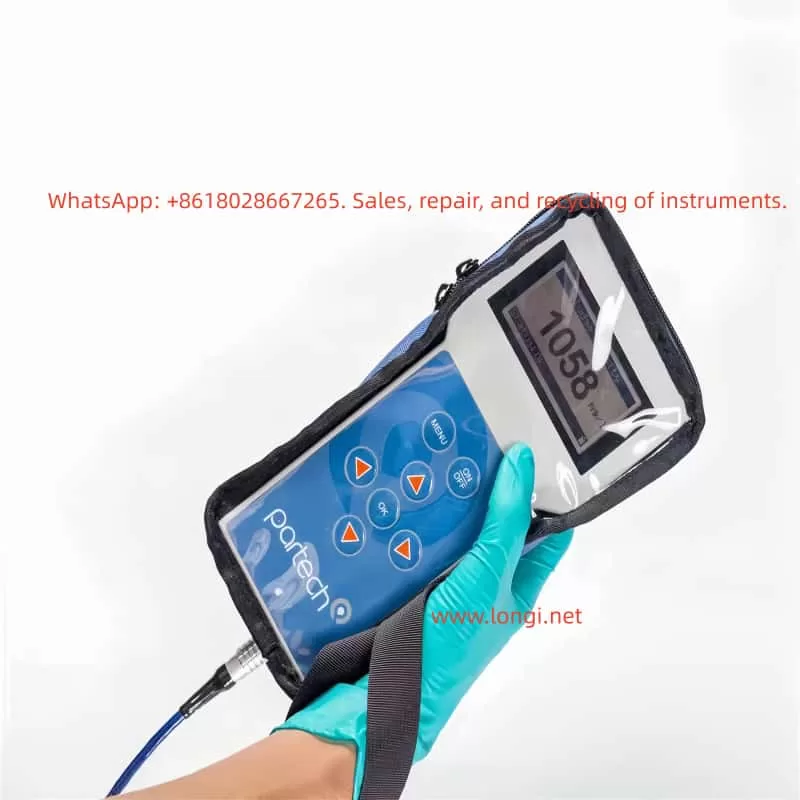
The Partech 750w² Monitor is a high-precision water quality monitoring device that integrates data acquisition, processing, display, and transmission. It supports use with various Partech WaterWatch² series sensors, enabling real-time monitoring of multiple key water quality parameters such as suspended solids (SS), dissolved oxygen (DO), and temperature. The instrument features a compact design and a user-friendly interface, making it suitable for various field environments.

1.2 Key Features

  • High-Precision Measurement: Utilizes advanced sensing technology and signal processing algorithms to ensure data accuracy.
  • Multi-Parameter Monitoring: Supports simultaneous monitoring of suspended solids, dissolved oxygen, temperature, and other parameters.
  • Flexible Configuration: Configurable with different sensors and measurement ranges based on user needs.
  • Data Recording and Transmission: Built-in data recorder with USB data transmission capability for easy data analysis and processing.
  • User-Friendly Operation: Intuitive display and simple keypad design for convenient operation.

II. Basic Operations

2.1 Power On/Off

To power on the instrument, simply press the On/Off button on the front panel, and the instrument will automatically enter measurement mode. When finished measuring or needing to turn off the instrument, press and hold the On/Off button until the screen turns off to complete the shutdown process.

2.2 Measurement Mode

In measurement mode, the instrument displays the current sensor readings in large numerals. The display also includes a status bar showing battery status, instrument settings, and other key information. Users can perform the following operations to further process measurement data:

  • Save Readings: Press the OK key in measurement mode to save the current sensor reading, time, and date. The status bar briefly displays “Saving” to confirm data storage.
  • View Recorded Data: Access the Recorded Data menu to view previously saved sensor readings.

2.3 Menu Navigation and Configuration

The instrument features an intuitive menu system for easy configuration and operation.

  • Access Main Menu: Press the Menu key in measurement mode to enter the main menu.
  • Select Options: Use the arrow keys to browse and select desired options in the main menu, then press the OK key to confirm.
  • Return to Measurement Mode: The instrument automatically returns to measurement mode after 60 seconds of inactivity in any non-measurement mode.
 Partech 750w² Monitor

III. Sensor Calibration

Accurate sensor calibration is crucial for ensuring reliable measurement data. The Partech 750w² Monitor supports calibration of suspended solids and dissolved oxygen sensors.

3.1 Suspended Solids Sensor Calibration

3.1.1 Zero Calibration

Zero calibration is the first step in the calibration process, used to eliminate baseline readings when no suspended solids are present.

  • Steps:
    1. Immerse the sensor in clean water, using a dark container to minimize ambient light interference.
    2. Enter the main menu, select Measurement Config, and then select Suspended Solids.
    3. Choose the Set Zero function, wait for the reading to stabilize, and press the OK key to complete zero calibration.

3.1.2 Set Measurement Range (Set Cal)

Setting the measurement range ensures accurate sensor measurements within the expected concentration range.

  • Steps:
    1. Determine the maximum expected concentration value for suspended solids based on your application.
    2. In the Measurement Config menu, select the Set Cal function.
    3. Use the arrow keys to adjust the measurement range to the maximum expected concentration value and press the OK key to confirm.

3.1.3 Take Sample for Calibration

When the exact value of the calibration solution is unknown, use the Take Sample function.

  • Steps:
    1. Immerse the sensor in a representative sample.
    2. In the Measurement Config menu, select the Take Sample function.
    3. Wait for calibration to complete; the instrument displays a calibration success message.

3.2 Dissolved Oxygen Sensor Calibration

3.2.1 100% Open Air Calibration

Dissolved oxygen sensor calibration is typically performed in open air to ensure accurate measurement of dissolved oxygen concentration in water.

  • Steps:
    1. Ensure the sensor is in a draft-free environment to avoid interference.
    2. Enter the main menu, select Measurement Config, and then select DO Saturation.
    3. Choose the Calibrate function, wait for the saturation percentage to reach approximately 90%, and press the OK key to complete calibration.

IV. Advanced Configuration and Features

In addition to basic measurement and calibration functions, the Partech 750w² Monitor offers numerous advanced configuration options and features to meet diverse user needs.

4.1 Site Management

The Site Management feature allows users to configure independent calibration values and settings for different monitoring locations. This is particularly useful for applications requiring simultaneous monitoring at multiple sites.

  • Add Site: In the main menu, select Sites, then Add Site, enter the site name, and confirm.
  • Delete Site: In the Sites menu, select Delete Site, choose the site to delete, and confirm.
  • Edit Site Name: In the Sites menu, select Edit Site Name, modify the site name, and confirm.

4.2 Data Recording and Transmission

4.2.1 Data Recording

The instrument’s built-in data recorder automatically logs sensor readings. Users can view recorded data through the Recorded Data menu.

  • View Recorded Data: Press the OK key in measurement mode to enter the Recorded Data menu and browse recorded data.

4.2.2 Data Transmission

The instrument supports USB data transmission to a PC for further analysis.

  • Connect to PC: Use the provided USB cable to connect the instrument to a PC.
  • Data Transmission: The instrument appears as a USB storage drive on the PC. Access the DataRecordings folder to view and copy data files.

V. Maintenance and Troubleshooting

To ensure long-term stable operation of the instrument, users should perform routine maintenance and promptly troubleshoot any issues that arise.

5.1 Routine Maintenance

  • Clean Sensors: Regularly clean the sensor surface to ensure measurement accuracy. Use a soft cloth to gently wipe the sensor surface, avoiding chemical cleaners.
  • Check Battery: Ensure the battery is adequately charged and avoid using the instrument with a low battery. If the instrument is not used for an extended period, remove the battery and store it properly.
  • Storage Environment: Store the instrument in a dry, ventilated, and shaded environment, avoiding extreme temperatures and humidity. Do not expose the instrument to direct sunlight or damp conditions.

5.2 Troubleshooting

Although the Partech 750w² Monitor is designed for reliability, users may encounter occasional issues. Here are some common problems and their solutions:

5.2.1 Unable to Power On

  • Check Battery: Confirm the battery is correctly installed and adequately charged. If the battery is low, charge it before use.
  • Check Power Adapter: If using an external power adapter, confirm it is functioning correctly and properly connected. Try using another power adapter or socket for testing.

5.2.2 Inaccurate Measurement Data

  • Check Sensors: Confirm the sensor is undamaged and properly connected. Check for loose or damaged sensor cables and reconnect them.
  • Recalibrate: Recalibrate the sensor following the calibration steps in the manual. Ensure all instructions are followed during calibration and use the correct calibration solution.

5.2.3 Data Transmission Failure

  • Check USB Connection: Confirm the USB cable is securely connected and the PC’s USB port is functioning correctly. Try using another USB cable or port for testing.
  • Check Data Files: Confirm the data files in the DataRecordings folder are not corrupted. If corrupted, try retransmitting data from the instrument.

VI. Firmware Updates

To ensure instrument performance stability and continuous functionality optimization, it is recommended to regularly update the instrument firmware. Firmware updates can fix known issues, add new features, or improve instrument performance.

  • Pre-Update Preparation: Ensure the instrument is adequately charged and back up important data. Do not disconnect the instrument from the PC or turn off the power during the update process.
  • Update Steps:
    1. From the Monitor Config menu, select Update Monitor F/W.
    2. Copy the BIN file containing the firmware update to the root directory of the instrument. Ensure the file name is correct and unmodified.
    3. Confirm there is only one BIN file on the instrument and press the OK key to begin the update. The instrument displays the update progress during the process.
    4. Wait for the update to complete; the instrument automatically restarts. After restarting, check that the instrument functions normally.

VII. Conclusion

The Partech 750w² Monitor, as a high-performance water quality monitoring device, is widely used across various industries due to its high accuracy, ease of operation, and comprehensive functionality. Through this detailed guide, users should now have a comprehensive understanding of instrument operations, sensor calibration, maintenance, and troubleshooting. In practical applications, it is recommended to strictly follow the instructions in the manual for operation and maintenance to ensure long-term stable operation of the instrument and accuracy of measurement data.

Furthermore, as technology continues to evolve, Partech may introduce more innovative products and technical support services. Users should stay informed by regularly checking Partech’s official website or contacting customer service for the latest product information and technical support. Through continuous learning and practice, users will be better equipped to utilize the Partech 750w² Monitor for water quality monitoring, contributing to environmental protection and resource utilization.

Posted on

Understanding the “O2 Sensor 0 Days Remaining” Message on HACH HQ40d Analyzers — Mechanism, Root Cause, and Engineering Solutions for LDO Dissolved Oxygen Probes


1. Introduction: What Does “O2 Sensor 0 Days Remaining” Really Mean?

When operating a HACH HQ40d portable multi-parameter analyzer equipped with an LDO101 / LDO10101 dissolved oxygen (DO) probe, users may encounter the on-screen message:

“O2 Sensor 0 days remaining.”

This message often causes confusion among field engineers, laboratory technicians, and equipment resellers. It is frequently misinterpreted as a probe failure, instrument malfunction, or electronic defect. In reality, this message is not a fault code. It is a consumable lifetime notification.

The message indicates that the luminescent sensor cap installed on the LDO probe has reached the end of its manufacturer-defined service life.


O2 Sensor 0 days remaining

2. LDO Technology: Why These Sensors Are Different

To understand this message, it is essential to distinguish LDO (Luminescent Dissolved Oxygen) sensors from traditional electrochemical DO electrodes.

2.1 Conventional DO electrodes

Traditional Clark-type electrodes rely on:

  • Anode and cathode systems
  • Electrolyte solution
  • Oxygen-permeable membranes

They consume oxygen during measurement and are sensitive to flow rate, membrane condition, and electrolyte aging.

2.2 LDO optical dissolved oxygen sensors

HACH’s LDO probes operate using optical fluorescence quenching technology. Blue light excites a luminescent material inside the sensor cap. Dissolved oxygen molecules quench the fluorescence. The instrument measures changes in fluorescence lifetime or phase shift to calculate oxygen concentration.

In this design, the active sensing element is not the probe body, but the luminescent sensor cap at the tip.


3. Physical Structure of an LDO101/LDO10101 Probe

An LDO probe can be functionally divided into three major sections:

  1. Probe body
    • LED excitation source
    • Photodetector
    • Temperature sensor
    • Signal processing electronics
  2. Luminescent sensor cap (consumable)
    • Luminescent dye layer
    • Oxygen diffusion layer
    • Protective optical coating
    • Integrated lifetime memory chip
  3. Cable and connector assembly

Only the sensor cap is subject to predictable chemical aging. The probe body itself is typically long-life.


LDO10101

4. Where Does the “Remaining Days” Value Come From?

Each genuine LDO sensor cap contains an internal memory device that stores:

  • Manufacturing data
  • Installation time
  • Operating lifetime
  • Calibration information

The HQ-series instruments periodically read this data and calculate the remaining validated service life. HACH specifies a typical service life of approximately one year for an LDO sensor cap.

When this counter reaches zero, the instrument displays:

“O2 Sensor 0 days remaining.”

This mechanism ensures data quality control and traceability rather than indicating immediate electrical failure.


5. Is This a Malfunction?

From an engineering standpoint, the answer is clear:

No. This is not a hardware fault.

It does not indicate:

  • Open or short circuits
  • Optical module failure
  • Communication errors
  • Mainboard defects
  • Loss of sensor detection

It indicates that the sensor cap has exceeded the period over which the manufacturer guarantees accuracy and response performance.


6. Can the Instrument Still Measure?

6.1 Functional perspective

In most firmware versions, the instrument will continue to display DO readings. The probe may still respond to oxygen changes.

However, after the luminescent material ages:

  • Fluorescence intensity decreases
  • Signal-to-noise ratio degrades
  • Response time increases
  • Temperature compensation accuracy declines

6.2 Engineering and compliance perspective

For regulated environments, laboratories, environmental monitoring projects, or contract testing, continued operation beyond the rated life is not acceptable. Measurement data may no longer meet quality or traceability requirements.

In such contexts, replacement of the sensor cap is mandatory.


7. Can the LDO10101 Sensor Cap Be Replaced?

Yes. The LDO system is designed around a replaceable sensor cap architecture.

The luminescent cap is a standard consumable component supplied by the manufacturer. Replacement does not require probe disassembly or electronic repair. Once a new cap is installed, the instrument automatically recognizes the new lifetime chip.

After replacement, the remaining life counter resets and the probe must be recalibrated.


8. Standard Replacement and Recovery Procedure

A professional maintenance workflow includes:

  1. Removing the expired sensor cap
  2. Installing a new genuine luminescent sensor cap
  3. Powering the instrument and verifying cap recognition
  4. Performing full dissolved oxygen calibration
    • Air-saturated calibration or
    • Water-saturated calibration

Calibration is essential because optical compensation coefficients are cap-specific.


9. Economic and Project-Level Considerations

Unlike traditional membrane kits, LDO sensor caps represent a higher-value consumable. Market pricing typically places them in the hundreds of US dollars per unit range.

This creates an important engineering reality:

The main operational cost of LDO dissolved oxygen probes is concentrated in the sensor cap, not in the probe body.

Therefore, during:

  • Instrument procurement
  • Maintenance planning
  • Project bidding
  • Second-hand equipment evaluation

the remaining sensor cap lifetime must be treated as a critical parameter.


10. Common Misdiagnoses in the Field

In service and resale environments, this message is often incorrectly interpreted as:

  • Probe failure
  • Instrument motherboard defects
  • Software malfunction
  • Optical module damage

Such misinterpretations frequently lead to unnecessary disassembly or replacement of functional hardware.

The correct diagnostic conclusion is always:

Consumable lifetime expiration, not electronic failure.


11. Implications for Service Engineers and Equipment Resellers

For technical service teams and secondary-market suppliers, the “0 days remaining” message provides immediate insight into the true maintenance status of a dissolved oxygen system.

An instrument showing this message should be classified as:

“Operational, but requiring consumable replacement before certified use.”

Failure to communicate this condition to end users may result in incorrect pricing, unexpected operating costs, or post-sale disputes.


12. Design Perspective: Why Manufacturers Use Lifetime-Managed Sensor Caps

The LDO approach delivers clear advantages:

  • No oxygen consumption
  • Reduced flow dependency
  • Lower drift compared to electrochemical electrodes
  • Simplified routine maintenance

However, these advantages require:

  • Precisely formulated luminescent materials
  • Strict optical stability control
  • Integrated lifetime monitoring

Modern analytical instrumentation increasingly adopts this model: long-life core hardware combined with digitally managed consumables.


13. Conclusion

When a HACH HQ40d analyzer displays:

“O2 Sensor 0 days remaining,”

the engineering meaning is unequivocal:

The luminescent sensor cap on the LDO10101 dissolved oxygen probe has reached the end of its validated service life. The probe itself is not defective. Replacement of the sensor cap, followed by proper calibration, is the correct and complete solution.

This message represents a maintenance requirement, not a hardware failure.

Posted on

Engineering Analysis and Systematic Repair Strategy for “All LEDs Flashing + ISSUE” Condition on Parker 590 Digital DC Drives

Abstract

The Parker 590 Digital DC Drive is a widely used high-performance DC speed controller applied in rolling mills, extrusion lines, wire drawing machines, paper production, printing equipment, and chemical process systems.
A frequently misunderstood fault condition encountered in field service is the following: immediately after power-up, all LEDs on the keypad flash simultaneously, and the display shows “DIGITAL DC DRIVE – ISSUE x.x”. The drive does not enter normal operation or parameter menus.

This condition is often incorrectly treated as a parameter problem, accidental calibration mode, or software issue. In reality, it almost always indicates an internal startup failure of the control system.

This paper provides a system-level engineering explanation of this phenomenon, analyzes its root causes, and proposes a structured troubleshooting and repair methodology suitable for industrial maintenance professionals.


DIGITAL DC DRIVE   ISSUE:7.4

1. System Architecture and Startup Logic of the Parker 590

To correctly understand the “ISSUE + all LEDs flashing” condition, it is essential to first review the internal architecture of the Parker 590.

From a system perspective, a Parker 590 DC drive consists of the following major functional blocks:

  1. Control Power Supply (SMPS)
    Generates regulated low-voltage rails such as +5 V, ±15 V, and +24 V for logic and analog circuits.
  2. Main Control System (MCU/DSP/CPLD)
    Executes firmware responsible for self-tests, parameter management, communications, control algorithms, and protection logic.
  3. Human-Machine Interface (HMI)
    Keypad, LEDs, and LCD module communicating with the main controller.
  4. Power and Firing System
    Gate drive circuits, armature and field control, SCR or transistor trigger boards.
  5. Measurement and Protection Circuits
    Voltage/current sensing, isolation, hardware protection channels.

The normal startup sequence of the Parker 590 is:

  • Control power supply starts
  • Logic voltages stabilize
  • Reset is released
  • Clock oscillation established
  • Boot code executed
  • Internal hardware self-test
  • Parameter memory verification
  • Power section status check
  • Transition to READY/STOP state

If any critical stage fails, the drive will not enter normal operating mode.


2. Engineering Meaning of “All LEDs Flashing + ISSUE”

In Parker 590 terminology, “ISSUE” is not a user fault code (such as overcurrent or overvoltage). It is an internal startup diagnostic indication.

It means:

The drive failed to complete its initialization and self-test sequence and did not reach a valid operational state.

Typical characteristics of this condition include:

  • All keypad LEDs flashing synchronously
  • Display fixed on “ISSUE x.x”
  • Inability to enter standard menus
  • Weak or absent keypad response
  • State remaining unchanged or repeatedly resetting

This is fundamentally a boot or initialization failure, not an application or parameter fault.

At this stage, the controller is not fully running and cannot reliably execute parameter handling, calibration routines, or normal control logic.


DIGITAL DC DRIVE DC 2Q 35A

3. Distinction from Calibration or Engineering Modes

Parker 590 drives do have special engineering or calibration modes that may involve unusual LED behavior. These are sometimes confused with the ISSUE condition.

However, there are decisive differences.

3.1 Characteristics of Calibration / Engineering Modes

  • Clear menu or calibration item displayed
  • Keys respond normally
  • Structured menu navigation
  • No “ISSUE” indication
  • System already fully operational

These modes require the CPU, memory, and power rails to be fully functional.

3.2 Characteristics of Startup Failure Mode

  • Appears immediately at power-up
  • Not triggered intentionally
  • Display shows “ISSUE”
  • No access to normal menus
  • All LEDs flash together
  • Indicates incomplete system initialization

A fundamental maintenance rule for Parker 590 drives is therefore:

If menus are accessible, investigate parameters or calibration.
If menus are inaccessible and ISSUE is displayed, treat it as a hardware startup failure.


4. Root Cause Classification

Based on extensive industrial repair experience, the “ISSUE + all LEDs flashing” condition almost always originates from the internal control system. Root causes fall into three primary categories.


4.1 Control Power Supply Failure (Highest Probability)

This is the most frequent cause.

Typical problems include:

  • Switching power supply not starting
  • One voltage rail missing or undervoltage
  • Excessive ripple or oscillation
  • Power supply unable to sustain load
  • Cyclic startup and collapse (hiccup mode)

Common failed components:

  • PWM controller ICs
  • Startup resistors
  • Secondary rectifier diodes
  • Optocouplers and reference circuits
  • Small electrolytic capacitors

Any instability in the logic supply will continuously reset the CPU, preventing successful initialization.


4.2 Main Control Board or Processor Failure

Examples include:

  • Damaged MCU or DSP
  • Corrupted or inaccessible program memory
  • Clock oscillator failure
  • CPLD/FPGA malfunction
  • Reset or enable circuit faults

Typical causes:

  • Lightning or surge events
  • 24 V misapplied to logic terminals
  • External high-voltage intrusion
  • Severe power disturbances
  • Long-term thermal degradation

In such cases, logic voltages may appear normal, but the controller never executes firmware correctly.


4.3 Internal Load or Subsystem Short Circuit

For example:

  • Shorted gate-drive board
  • Faulty interface or communication modules
  • Analog input/output circuit failure

This category is characterized by:

  • Power supply stable when unloaded
  • Voltage collapses when specific boards are connected
  • Reproducible failure when certain modules are installed

Isolation and staged reconnection are required to identify the defective subsystem.


5. Systematic Engineering Troubleshooting Procedure

A structured troubleshooting process is essential to avoid misdiagnosis.


Step 1 – External Isolation

Disconnect:

  • Armature circuit
  • Field circuit
  • Encoder
  • I/O wiring
  • Communication cables
  • External 24 V sources

Leave only the control power supply.

This excludes external shorts and miswiring.


Step 2 – Comprehensive Power Rail Measurement

Measure and verify:

  • +5 V (critical digital rail)
  • +15 V / –15 V (analog rails)
  • +24 V (if applicable)

Check for:

  • Presence
  • Correct level
  • Stability
  • Ripple and transient behavior

Any abnormality must be corrected before further investigation.


Step 3 – Oscilloscope Verification of Core Signals

Key points include:

  • MCU clock output
  • Reset line behavior
  • 5 V ripple and noise
  • Power-supply feedback signals

Typical faults observed:

  • No clock oscillation
  • Reset permanently asserted
  • Periodic voltage collapse

These directly confirm startup failure mechanisms.


Step 4 – Load Isolation Method

If power instability is suspected:

  • Disconnect control boards
  • Disconnect firing or interface boards
  • Reconnect subsystems sequentially

This identifies which unit overloads the power supply.


Step 5 – Logic Startup Chain Validation

After confirming stable voltages:

  • Verify reset release
  • Confirm clock stability
  • Check memory communication
  • Inspect bus lines for shorts

This differentiates power-supply faults from processor-level failures.


6. Why Recalibration Cannot Solve This Condition

Calibration routines require:

  • A running CPU
  • Accessible parameter memory
  • Stable logic power
  • Functional communication between subsystems

The ISSUE condition explicitly indicates these prerequisites are not satisfied.
Therefore, recalibration is not a valid corrective action.

This fault occurs before the system reaches any state capable of executing calibration or configuration code.


7. Engineering Conclusion and Maintenance Strategy

When a Parker 590 drive exhibits:

  • All LEDs flashing immediately at power-up
  • Display showing “ISSUE”
  • No access to standard menus

It should be formally classified as:

Control system startup failure (boot failure / logic supply fault)

Correct maintenance strategy focuses on:

  • Control power supply integrity
  • Main controller startup chain
  • Internal load and subsystem isolation

Not on parameters, tuning, or external control signals.


8. Final Remarks

The Parker 590 is a robust and highly repairable industrial drive.
The “ISSUE + all LEDs flashing” symptom is not random or obscure; it is a consistent indicator of startup-level failure.

By approaching the problem from a system engineering perspective—centered on power integrity, processor initialization, and internal loading—most drives exhibiting this condition can be diagnosed efficiently and restored successfully.

Posted on

Deep Analysis and Comprehensive Troubleshooting Guide for ALE08 Fault on DPSON DSL200P Servo Drives

Introduction

In the realm of industrial automation, servo drives serve as the critical “muscle” and “brain” of motion control systems, dictating the precision, speed, and stability of machinery. The DPSON DSL200P series, known for its cost-effectiveness and reliability, is widely deployed in packaging machinery, CNC lathes, conveyor systems, and printing equipment. However, like all sophisticated electronic devices, they are susceptible to specific operational faults.

One of the most frequent and disruptive alarms encountered by engineers is ALE08 (Position Deviation Counter Overflow). When this fault occurs, the drive halts the motor abruptly to prevent mechanical damage or motor burnout. If not diagnosed correctly, troubleshooting can be time-consuming, leading to significant production downtime.

ALE 8

This article provides an exhaustive technical analysis of the ALE08 fault. We will dissect the underlying control logic, categorize root causes into mechanical, electrical, and parametric domains, provide a step-by-step diagnostic workflow, analyze real-world case studies, and outline preventive maintenance strategies. This guide is designed for maintenance engineers, system integrators, and automation students seeking a deep understanding of servo dynamics.


I. The Principle of ALE08: Understanding Position Deviation

To effectively troubleshoot ALE08, one must first understand the Closed-Loop Position Control architecture inherent to servo systems.

1. The Control Loop Logic

A servo system operates on a feedback loop:

  1. Command Input: The host controller (PLC or Motion Card) sends a stream of Command Pulses (representing position or speed) to the drive.
  2. Feedback Input: The servo motor’s encoder sends Feedback Pulses back to the drive, reporting the actual rotor position.
  3. Deviation Calculation: The drive’s DSP (Digital Signal Processor) continuously subtracts the Feedback Pulse count from the Command Pulse count. The result is the Position Deviation (or Position Error).
  4. Correction: Using PID (Proportional-Integral-Derivative) algorithms, the drive adjusts the output voltage/current to the motor to minimize this deviation to zero.

2. The Position Deviation Counter

The Position Deviation Counter is a specific register within the drive’s memory (typically a 16-bit or 32-bit signed integer). It acts as a “bucket” that accumulates the difference between where the motor should be and where it is.

The Overflow Mechanism:
Every servo drive has a maximum limit for this counter (e.g., ±32,767 for a 16-bit system). If the motor fails to follow the command—due to being blocked, lack of torque, or signal loss—the deviation value accumulates rapidly. Once this value exceeds the register’s limit, an overflow occurs. The drive interprets this as a critical failure (the system has lost control of the axis) and triggers ALE08, cutting power to the motor (coast stop or decelerated stop) to protect the machinery.


II. Root Cause Analysis: The Three Domains of Failure

Based on field data and the DSL200P technical manual, the causes of ALE08 can be systematically categorized into three primary domains: Mechanical LoadCommand Signal, and Motor/Drive System.

Domain A: Mechanical Load Anomalies (The Most Common Culprit)

This accounts for approximately 60% of ALE08 cases. The issue is not electronic; it is physical. The motor simply cannot generate enough torque to overcome the resistance.

  1. Excessive Load/Jamming:
    • Scenario: A conveyor belt gets stuck on a debris, or a packaging machine hopper gets clogged.
    • Physics: The load torque exceeds the motor’s peak torque (e.g., a 750W motor typically offers ~2.39 N·m rated torque, but the instantaneous load demands 5 N·m). The motor stalls, but the controller keeps sending pulses, causing the deviation counter to max out instantly.
  2. Transmission Component Failure:
    • Ball Screw/Lead Screw: Worn nuts, lack of lubrication, or bent shafts increase friction exponentially.
    • Belt Drive: Belt snapping, severe slippage, or incorrect tension.
    • Bearings: Seized bearings due to contamination or lack of grease.
    • Couplings: Failure of the flexible element (spider) in the coupling, disconnecting the motor from the load mechanically while the encoder still reports “zero movement.”
  3. Foreign Object Intrusion: Metal chips, plastic fragments, or dust entering the screw/nut interface creates a physical barrier.
  4. Misalignment: The motor axis and the load axis are not concentric, creating binding forces (radial load) that the motor bearings cannot handle.

Domain B: Command Pulse Anomalies (The “Confused” Drive)

If the drive receives incorrect instructions, it cannot calculate the deviation correctly, or the deviation accumulates erroneously.

  1. Controller/Source Issues:
    • Frequency Mismatch: The controller outputs pulses at 300kHz, but the DSL200P is rated for a maximum of 200kHz. The drive misses pulses, leading to calculation errors.
    • Electrical Interference (EMI): Noise from nearby VFDs or heavy machinery couples into the pulse line, creating “ghost pulses” or dropping real pulses.
    • Hardware Failure: A blown transistor in the controller’s output module.
  2. Wiring & Connection Faults:
    • Loose Terminals: Oxidation or vibration loosening screws on PUL+, PUL-, or SIGNAL GND.
    • Cable Damage: Broken shielding or shorted cores in the encoder/pulse cable.
    • Grounding Loops: Improper grounding causing reference voltage shifts.
  3. Parameter Mismatches:
    • Electronic Gear Ratio (EGR): If the mechanical reduction is 5:1 but the parameter is set to 1:1, the drive expects the motor to turn 5x faster than it physically can, causing immediate overflow.
    • Pulse Equivalent: Incorrect settings for “pulses per millimeter” lead to scaling errors in the deviation calculation.
    • Signal Type: Controller sends Differential Line Driver (RS422) signals, but the drive is set to NPN/Open Collector mode.

Domain C: Motor and Drive Output Failures (The “Weak” System)

Even with a perfect command and a free mechanical load, the system might fail to execute.

  1. Motor Faults:
    • Winding Short/Open: The motor generates zero torque.
    • Encoder Failure: A dirty code disk or broken cable causes the drive to lose position feedback. The drive thinks the motor isn’t moving (even if it is vibrating) and increases current, eventually triggering an error or overflow as it fights “phantom” resistance.
    • Brake Issues: If the motor has a holding brake that fails to release, the motor cannot turn.
  2. Drive Hardware Faults:
    • IGBT Module Damage: One phase of the inverter is dead, resulting in single-phasing. The motor hums but produces insufficient torque.
    • Output Line Break: The U/V/W power cable to the motor is severed.
    • Current Limit Settings: The “Torque Limit” parameter is set too low (e.g., 20% of rated current), physically preventing the motor from moving a heavy load.
  3. Incorrect Motor Parameters:
    • Auto-Tuning Failure: The drive has not been “tuned” to the specific motor inertia.
    • Mismatched Specs: The drive is configured for a 400W motor, but a 750W motor is attached (or vice versa), leading to current saturation.

DSL200-P5-0R7

III. Systematic Troubleshooting Workflow

Follow this “Outside-In” approach to isolate the fault efficiently. Safety First: Disconnect main power before physical inspection.

Step 1: Mechanical Isolation (The “Hand Test”)

Goal: Determine if the load is physically free.

  1. Power Down: Turn off the main breaker and wait for the drive LEDs to extinguish (capacitors discharge).
  2. Manual Rotation:
    • Direct Drive: Try to turn the motor shaft by hand. It should offer some resistance (magnetic detent) but turn smoothly. If it is locked solid, the motor bearings are seized, or the brake is engaged.
    • Belt/Screw Drive: Disconnect the coupling (if possible) and turn the motor side. Then turn the load side.
      • Motor turns, Load does not: The jam is in the transmission (screw, bearing, gearbox). Inspect for chips or lack of lube.
      • Neither turns: The jam is at the load end (conveyor, axis).
  3. Inspection: Visually check for broken belts, disconnected couplers, or obvious obstructions.

Step 2: Signal Verification (The “Oscilloscope Test”)

Goal: Verify the integrity of the Command Pulses.

  1. Reconnect Power: Keep the motor disconnected (or hold the brake) to prevent movement.
  2. Measure: Connect an oscilloscope to the drive’s PUL+ and PUL- terminals (referenced to SIGNAL GND).
  3. Analyze Waveform:
    • Shape: Look for clean square waves. “Rounded” edges or “stair-stepping” indicates weak drive circuitry or cable capacitance issues. “Spikes” indicate noise.
    • Amplitude:
      • Differential (RS422): Should be ~2V to 5V peak-to-peak.
      • Open Collector (NPN): Should swing from 0V to 24V (or 5V depending on the system).
    • Frequency: Command a move (e.g., 10kHz). Does the scope read 10kHz? If it reads 5kHz or 15kHz, the controller or cabling is faulty.
  4. Check Shielding: Ensure the cable shield is grounded at both ends (Controller and Drive) for high-frequency noise immunity.

Step 3: Parameter & Configuration Audit

Goal: Ensure the “Software” matches the “Hardware”.

Access the DSL200P parameter list (usually via keypad or software). Verify:

  • PA01 (Pulse Type): Matches wiring (Differential vs. Open Collector).
  • PA02 (Electronic Gear Ratio): Numerator/Denominator matches mechanical reduction (e.g., 1/5 for a 5:1 reducer).
  • PA03 (Pulse Equivalent): Correct value for the machine (e.g., 0.001mm/pulse).
  • PA05 (Motor Model): Matches the physical motor tag.
  • PA10 (Torque Limit): Is it set to 100% or higher? (Sometimes set low for safety testing).

Step 4: Electrical Component Testing

Goal: Test the Motor and Drive power stage.

  1. Motor Insulation & Resistance:
    • Use a Megger (insulation tester) to check U/V/W to Ground (should be >100MΩ).
    • Use a multimeter to measure U-V, V-W, W-U resistance. They should be balanced (e.g., all ~1.5Ω). An open circuit (OL) or short circuit (0Ω) indicates burnt windings.
  2. Encoder Check:
    • Rotate the motor shaft by hand slowly.
    • Monitor the diagnostic screen (or use a frequency counter) for A/B/Z phase pulses. They should increment/decrement smoothly without dropping counts.
  3. Drive Output (IGBT):
    • Warning: High Voltage. With power on (no run command), measure DC bus voltage (across P/+ and N/-). It should be ~1.41x the input AC voltage (e.g., 320VDC for 220VAC input).
    • If the DC bus is low or zero, the rectifier bridge is blown.

IV. Case Studies: Real-World Diagnostics

Case 1: The “Invisible” Jam in a Packaging Machine

  • Symptom: Intermittent ALE08 on a sealing bar axis. Manual rotation felt “heavy” but possible.
  • Investigation: Mechanical inspection revealed no broken parts. The ball screw was clean. However, the linear guide rails were covered in hardened glue residue from a previous product run.
  • Resolution: Cleaning the rails and re-greasing solved the issue. The friction coefficient had increased just enough to exceed the motor’s torque margin during high-speed moves.

Case 2: The Ground Loop Interference

  • Symptom: ALE08 occurred only when a large 5kW spindle motor started nearby.
  • Investigation: Oscilloscope revealed massive noise spikes on the pulse line coinciding with the spindle start-up. The pulse cable was routed in the same trunking as the 220V spindle power cable.
  • Resolution: Re-routing the pulse cable 30cm away from the power cable and installing a ferrite ring (magnetic bead) on the pulse line at the drive end eliminated the noise.

Case 3: Incorrect Electronic Gear Ratio

  • Symptom: ALE08 immediately upon starting a “Jog” command, even with the motor unloaded (coupling removed).
  • Investigation: The machine was a direct drive (1:1), but the parameter “Electronic Gear” was set to 2:1 from a previous machine setup. The drive was commanding the motor to move twice as fast as the encoder was reporting, causing instant overflow.
  • Resolution: Resetting the Electronic Gear Ratio to 1:1 cleared the fault.

V. Prevention and Maintenance Strategy

“An ounce of prevention is worth a pound of cure.” To minimize ALE08 occurrences:

  1. Mechanical PM Schedule:
    • Weekly: Lubricate screws and rails.
    • Monthly: Check belt tension and coupler set screws.
    • Quarterly: Clean debris from machine tracks.
  2. Electrical Best Practices:
    • Use shielded twisted-pair cables for encoders and pulses.
    • Ground the shield at both ends (for servo drives, this is usually preferred over single-point grounding to shunt high-frequency noise).
    • Separate power cables (220V/380V) from signal cables (24V/5V).
  3. Parameter Management:
    • Perform a “Backup” of parameters to a USB or PC after every commissioning.
    • Document the mechanical reduction ratios and pulse equivalents physically on the machine.
  4. Operator Training:
    • Train operators to recognize the sound of a “stalling” motor (a loud hum) and to hit the E-Stop immediately rather than resetting the drive repeatedly (which can burn the motor).

VI. Common Pitfalls and Safety Warnings

  1. The “Reset” Trap: Do not simply press “Reset” multiple times. If the mechanical load is jammed, resetting will cause the drive to try to push again, potentially overheating the motor windings or stripping gears. Find the root cause first.
  2. Ignoring the Encoder: A dirty encoder is a silent killer. If the feedback is lost, the drive assumes the motor is stationary and ramps up current to max, often tripping “Overcurrent” (ALE02) before “Overflow” (ALE08), but sometimes causing ALE08 if the error accumulates subtly.
  3. Safety: Always assume the motor can move. Secure the load with blocks or jacks before working under it, even if the drive is off (gravity can move vertical axes).

Conclusion

The ALE08 (Position Deviation Counter Overflow) fault on the DPSON DSL200P is a protective mechanism indicating a loss of synchronization between the commanded position and the actual position. While it signals a stop in production, it prevents catastrophic mechanical failure.

By understanding the closed-loop control logic, systematically isolating the problem into mechanical, signal, and parametric categories, and utilizing tools like oscilloscopes and multimeters, engineers can drastically reduce troubleshooting time. Remember that 70% of ALE08 faults are mechanical (friction/jamming), 20% are wiring/interference, and only 10% are drive/motor hardware failures.

Mastering the diagnosis of ALE08 is not just about fixing a single error code; it is about mastering the dynamics of motion control. With the guidelines provided in this article, maintenance personnel can transform from reactive “part changers” into proactive system diagnosticians, ensuring higher uptime and reliability for industrial automation systems.

Posted on

Diagnosis and Optimization of Err81 Fault in Inovance MD500 Series Inverter for Air Compressor Applications

1. Introduction

In the field of modern industrial automation, inverters (Variable Frequency Drives, VFDs) serve as core equipment for motor control and have been widely applied in air compressor systems to achieve energy savings, precise control, and system protection. The Inovance MD500 series inverter is renowned for its high performance, modular design, and rich custom functions, making it particularly suitable for high-power loads such as 315kW air compressors. However, in practical operation, the occurrence of fault codes like Err81 often leads to system shutdowns, affecting production efficiency. Err81 belongs to the user-defined fault category, and its specific triggering mechanism depends on system programming and external signal input. This article deeply analyzes the causes, diagnostic methods, and troubleshooting strategies of the Err81 fault from a technical perspective, and explores optimization paths in the air compressor application scenario. Through structured analysis, it provides practical guidance to help engineers improve system reliability and maintenance efficiency.

As a core equipment for industrial air supply, air compressors have variable frequency control requirements including pressure stability, load matching, and fault protection. The diagnosis of the Err81 fault is not only about fixing the problem but also an opportunity to optimize the entire system. Based on the MD500 series manual, technical practices, and combined with the characteristics of air compressors, this article constructs a complete technical framework to ensure rigorous logic and sufficient data support.

ERR81

2. Fundamentals of Inverter Technology

Inverters achieve speed regulation by changing the frequency and voltage of the motor’s power supply. Their core principle is based on Pulse Width Modulation (PWM) technology, which converts direct current (DC) into alternating current (AC) with variable frequency. The MD500 series adopts a vector control algorithm, supporting Sensorless Vector Control (SVC) and Voltage/Frequency Control (V/F Control), and is applicable to both asynchronous and synchronous motors.

In terms of technical parameters, the MD500T315G model has a three-phase AC input of 380-480V, an output power of 315kW, a current of 585A, and supports a frequency range of 50/60Hz. This series has a built-in PID controller for closed-loop regulation, such as the pressure control of air compressors. The inverter’s fault system is divided into standard faults (Err01-Err79) and user-defined faults (Err80-Err89). The latter allows custom triggering conditions through Digital Inputs (DI), virtual I/O, or expansion cards to achieve specific application protection.

The Electromagnetic Compatibility (EMC) design of the inverter complies with the IEC 61800-3 standard, ensuring anti-interference in industrial environments. The control modes include open-loop and closed-loop, with an overload capacity of 150% rated current for 60 seconds, suitable for the intermittent load of air compressors. Understanding these fundamentals helps analyze Err81: as User-Defined Fault 2, it is usually activated by external logic signals, such as sensor abnormalities or PLC commands.

3. Overview of Air Compressor Systems

Air compressor systems mainly include screw-type, piston-type, and centrifugal-type, among which screw-type compressors most commonly adopt variable frequency control to achieve variable speed operation and energy optimization. System working principle: The motor drives the compressor rotor to compress air to the set pressure, and maintains stability through an unloading valve and a cooling system. After the inverter is involved, the speed can be adjusted according to load requirements, avoiding energy waste from constant-speed operation. Statistics show that variable frequency control can save 20%-40% of electrical energy.

In MD500 applications, the inverter is connected to the motor, pressure sensor, and control PLC. Typical configuration: DI terminals receive pressure switch signals, AI terminals input 4-20mA pressure feedback, and DO terminals output operating status. Most faults of air compressors originate from pressure fluctuations, oil temperature abnormalities, or mechanical wear, which can be mapped to Err81 through user-defined faults. For example, high-pressure protection can be programmed as DI function 45 (User-Defined Fault 2), which is triggered when the pressure exceeds the threshold.

System integration also involves Modbus RTU or Profinet communication to ensure synchronization between the inverter and the upper computer. The dynamic load characteristics of air compressors require the inverter to have fast response, such as the torque boost function (parameter F1-01) of the MD500, which can reach 200% starting torque, suitable for the start-up phase of the compressor.

MD500T315G

4. Introduction to Inovance MD500 Series Inverters

The MD500 series is a high-end general-purpose inverter from Inovance, designed for medium and high-voltage loads, supporting a power range of 0.4kW to 500kW. The MD500T315G model is optimized for heavy-duty applications, with a built-in braking unit and DC reactor to reduce harmonic interference. Key features include:

  • Modular Structure: The control board and power board are separated for easy maintenance. Green terminal blocks support quick wiring, such as the control interface shown in the photo.
  • Parameter Grouping: Group F contains basic parameters, and Group A contains advanced extensions. User-defined faults are configured through Group A7, with A7-00 enabling the programmable card.
  • Display and Operation: The LED keypad displays frequency, current, and voltage, supporting PRG/ENTER navigation. The QUICK key provides quick access to commonly used parameters.
  • Protection Mechanism: Built-in overcurrent, overvoltage, and undervoltage protection. User-defined faults Err80-Err89 allow expansion of 10 types of protection, with Err81 corresponding to the second user-defined fault.

In air compressors, the MD500 integrates PID regulation (Group F). The pressure setpoint is set through A0-03, and the feedback source is AI1. Communication expansion cards (such as MD38PC1) support custom logic, and Err81 can be triggered by an external PLC to monitor oil level or temperature.

The series manual emphasizes that the diagnosis of user-defined faults such as Err81 requires checking the monitoring parameters in Group U0, such as U0-45 which records the DI status at the time of the fault. This provides a data basis for subsequent analysis.

5. Detailed Explanation of Err81 Fault

Err81 is User-Defined Fault 2 of the MD500 series. The code range Err80-Err89 corresponds to user-defined protection mechanisms. According to the manual, Err81 is not a hardware fault but a software-programmable event. It is usually triggered in the following ways:

  • DI Terminal Input: Parameters in Group F4 set DI1-DI10 to function 45 (User-Defined Fault 2). Err81 is triggered when the DI is closed (high level).
  • Virtual I/O: Parameters in Group A1 simulate input signals for scenarios without physical connections.
  • Expansion Card Logic: Parameter A7-09 sets the fault code to 81, which is activated when the program in the card detects an abnormality.
  • Communication Trigger: Write 81 to Modbus address 0x7000 for remote triggering.

Common causes of Err81 in air compressor applications:

  • Sensor Abnormality: Faults in the pressure sensor cause abnormal DI signals. For example, when the pressure exceeds 10bar, the high-pressure switch activates the DI.
  • Load Mismatch: Under the unloading state of the compressor, excessively low speed causes torque abnormalities, triggering custom logic through PID deviation.
  • External Interlock: Safety door opening or emergency stop signals are mapped to Err81 via the PLC.
  • Incorrect Parameter Configuration: A7-09 is mistakenly set to 81, or F4-00 functions are repeatedly defined.

When a fault occurs, the inverter stops output, the relay operates, and the keypad displays “Err81”. The manual indicates that the automatic reset of Err81 is controlled by F9-09, with a default of 0 times and a delay of F9-11 seconds.

Compared to Err80 (User-Defined Fault 1), Err81 allows for more granular protection, such as distinguishing between high-pressure and low-temperature faults. This enhances the safety of air compressors but increases diagnostic complexity.

6. Fault Diagnosis Methods

Diagnosing Err81 requires a systematic approach, combining the manual and tools. The steps are as follows:

  1. Preliminary Observation: Record parameters at the time of the fault. Press PRG to enter U0-62 to confirm code 81, and check U0-45 for current, voltage, and DI status (bit representation, with binary bit 1 indicating activation).
  2. Historical Record Analysis: F9-14 to F9-44 store recent faults, including timestamps (based on the internal clock). Compare the occurrence patterns of multiple Err81 faults to identify periodic issues such as daily peak loads.
  3. Parameter Check: Navigate to Group A7 to verify if A7-00 enables the expansion card; check DI functions in Group F4, and if set to 45, track the external signal source. In air compressors, check if F1-00 PID is enabled and the pressure setting in Group A6.
  4. Physical Inspection: After power-off, check the green terminal connections (as shown in the photo with multiple terminals) and measure the DI voltage with a multimeter (typically 24VDC). Inspect the sensor: compare the pressure gauge reading with the AI feedback; a deviation >5% indicates a fault.
  5. Simulation Test: Temporarily disable Err81 (set relevant F4 parameters to 0) and operate the compressor for observation. If normal, the problem lies in the custom logic; if the fault persists, check the motor insulation (megohmmeter >5MΩ).
  6. Advanced Diagnosis: Use Inovance debugging software to connect to the RS485 port and read the complete log. Analyze waveforms: current harmonics >5% indicate power supply issues.

In air compressor scenarios, diagnosis also includes system pressure curves: monitor with a data logger; abnormal speed-pressure relationships indicate the need for PID parameter adjustment (gain F1-02).

7. Fault Troubleshooting Cases

Assume an air compression plant uses the MD500T315G to drive a 315kW screw compressor, experiencing Err81. Diagnostic process:

  • Step 1: U0-45 shows DI3 activation, current is normal.
  • Step 2: Historical records indicate occurrences every morning, coinciding with pressure peaks.
  • Step 3: F4-02=45, DI3 is connected to the high-pressure switch.

Troubleshooting: Replace the switch, clean the filter, and pressure stabilizes. Normal operation resumes after reset.

Another case: Err81 triggered by communication. The PLC writes 81 when monitoring oil temperature >60°C. Troubleshooting: Optimize the cooling fan and adjust the threshold to 65°C.

These cases emphasize that troubleshooting Err81 requires combining mechanical and electrical aspects, with an average repair time of <2 hours.

8. Preventive Measures and Optimization Strategies

The focus of preventing Err81 lies in configuration and maintenance:

  • Parameter Optimization: Set F9-09=3 for automatic reset to reduce downtime. Enable PID parameter auto-tuning (F1-28=1).
  • Regular Maintenance: Check terminal tightness monthly and calibrate sensors. The replacement cycle of air compressor oil filters is <2000 hours.
  • Redundant Design: Add backup DI to avoid single-point failures.
  • Software Upgrade: Update the MD500 firmware to support more custom logic.

Optimization strategies: Integrate IoT modules to monitor DI status in real-time and predict Err81 through cloud platforms. Energy-saving optimization: Dynamically adjust speed with a target COP >6.0.

9. Application of Advanced Technologies

In the future, AI algorithms can analyze Err81 logs to predict faults, such as using machine learning models (SVM classification of DI patterns). Blockchain ensures that parameter configurations are tamper-proof. 5G communication enables remote diagnosis, reducing on-site intervention.

In air compressors, digital twin simulation systems can pre-test the impact of Err81.

10. Conclusion

The diagnosis of the Err81 fault reflects the flexibility of the MD500 inverter, which can be efficiently resolved through systematic methods. In air compressor applications, combining mechanical optimization improves overall performance. Continuous technological iteration will further reduce fault rates and promote industrial intelligence.

Posted on

Analysis and Handling of E0020 Contactor Fault in WISCO South E-CONVERT 5 Series Inverter

Introduction

In the field of modern industrial automation, inverters, as the core equipment for motor control, play a crucial role in ensuring production safety and improving equipment utilization. The E-CONVERT 5 series inverter launched by WISCO South (Wuhan) Automation Co., Ltd. has gained widespread market recognition for its high performance, high reliability, and rich functionality. However, during actual operation, the E0020 contactor fault, as a relatively common type of fault, poses a threat to the normal operation of the equipment. This article will provide a detailed analysis of the meaning, causes, diagnostic methods, and handling measures of the E0020 fault, aiming to assist technicians in quickly locating problems and restoring normal equipment operation.

E0020 FAULT
filter: 0; fileterIntensity: 0.0; filterMask: 0; hdrForward: 0; highlight: true; brp_mask:0;
brp_del_th:null;
brp_del_sen:null;
delta:null;
module: photo;hw-remosaic: false;touch: (-1.0, -1.0);sceneMode: 8;cct_value: 0;AI_Scene: (-1, -1);aec_lux: 0.0;aec_lux_index: 0;HdrStatus: auto;albedo: ;confidence: ;motionLevel: -1;weatherinfo: null;temperature: 28;

I. Overview of E0020 Fault

1.1 Fault Definition

The E0020 fault code in the WISCO South E-CONVERT 5 series inverter represents a contactor fault. When the inverter detects that the contactor fails to engage normally or exhibits abnormalities during startup or operation, it triggers this fault code, causing the inverter to stop working and display corresponding fault information.

1.2 Fault Impact

As a key connecting component between the inverter and the motor, the contactor’s normal operation is vital for the motor’s startup, operation, and shutdown. Once a contactor fault occurs, it will directly affect motor control, potentially leading to production line shutdowns, equipment damage, or even safety accidents.

II. Causes of E0020 Fault

2.1 Contactor Faults

  • Contact Wear or Adhesion: After prolonged operation, the contacts of the contactor may become worn or adhered due to arc erosion, resulting in poor contact or an inability to disconnect.
  • Coil Faults: The contactor coil may be damaged due to voltage fluctuations, overheating, etc., leading to an inability to engage or maintain engagement.
  • Mechanical Faults: The internal mechanical structure of the contactor (such as springs, armatures, etc.) may experience wear, deformation, etc., causing sluggish action or seizure.

2.2 Control Circuit Issues

  • Abnormal Control Signals: The control signals output by the inverter may prevent the contactor from engaging normally due to line faults, interference, etc.
  • Incorrect Parameter Settings: Parameters within the inverter related to contactor control (such as engagement time, release time, etc.) may be set improperly, causing abnormal contactor action.
  • Program Errors: The inverter’s control program may contain logical errors or bugs, leading to incorrect or unsent contactor control commands.

2.3 Power Supply Problems

  • Unstable Power Supply Voltage: Excessive fluctuations in the power supply voltage may result in insufficient or excessive voltage at the contactor coil, affecting its normal operation.
  • Power Supply Phase Loss: The absence of any phase in a three-phase power supply will prevent the contactor from engaging or maintaining engagement.

2.4 Environmental Factors

  • High Temperature: Excessively high operating temperatures in the inverter’s environment may accelerate the aging of internal components in the contactor, degrading performance.
  • High Humidity: High humidity environments may cause condensation, short circuits, etc., inside the contactor.
  • Dust Pollution: Dust entering the contactor may affect the quality of contact between the contacts, leading to poor contact.

III. Diagnostic Methods for E0020 Fault

3.1 Visual Inspection

  • Observe the appearance of the contactor to check for damage, deformation, burning, etc.
  • Inspect the connecting wires to confirm they are not loose, detached, or damaged.

3.2 Electrical Measurement

  • Use a multimeter to measure the voltage across the contactor coil to confirm whether the voltage is normal and stable.
  • In a de-energized state, use a multimeter to measure the resistance value of the contactor contacts to confirm whether the contacts are in good contact.

3.3 Control Signal Inspection

  • Inspect the control signal lines to confirm they are intact and free from short circuits or open circuits.
  • Use an oscilloscope to observe the waveform of the control signal to confirm whether the signal is stable and meets the inverter’s requirements.

3.4 Parameter and Program Inspection

  • Verify the parameter settings within the inverter related to contactor control to confirm they are correct and error-free.
  • If possible, debug and inspect the inverter’s control program to confirm the correctness of the program logic.

3.5 Environmental Inspection

  • Confirm whether the inverter’s operating environment meets requirements, including temperature, humidity, dust, etc.
  • Clean the inverter and contactor to remove dust and dirt.
EC551-4AAX-075A

IV. Handling Measures for E0020 Fault

4.1 Replacing the Contactor

  • Confirming the Fault: After completing the above diagnostic steps, if it is confirmed that the contactor itself has a fault and cannot be repaired, promptly replace it with a contactor of the same model and specifications.
  • Replacement Steps:
    • Disconnect the power supply to the inverter and confirm there is no electricity.
    • Remove the faulty contactor and record its wiring method.
    • Install the new contactor and connect the wires according to the original wiring method.
    • Restore the power supply and test whether the contactor operates normally.

4.2 Repairing the Control Circuit

  • Repairing Line Faults: If short circuits or open circuits are found in the control signal lines, promptly repair or replace the lines.
  • Adjusting Parameter Settings: Adjust the parameter settings related to contactor control within the inverter according to the inverter’s manual to ensure the parameters are reasonable and meet actual needs.
  • Repairing Program Errors: If logical errors or bugs are found in the control program, promptly contact the manufacturer or professional personnel for repair.

4.3 Improving Power Supply Quality

  • Stabilizing Power Supply Voltage: Install voltage stabilizers, UPS devices, etc., to stabilize the power supply voltage and reduce the impact of voltage fluctuations on the contactor.
  • Checking for Power Supply Phase Loss: Use a phase sequence meter to check whether the three-phase power supply is missing any phase and promptly address the power supply phase loss issue.

4.4 Optimizing the Operating Environment

  • Controlling Temperature: Install air conditioners, ventilation equipment, etc., to control the operating temperature of the inverter’s environment within a reasonable range.
  • Reducing Humidity: Use dehumidifiers, desiccants, etc., to reduce the humidity of the operating environment and prevent condensation and short circuits.
  • Reducing Dust: Regularly clean the inverter and contactor to reduce the impact of dust pollution on the equipment.

V. Preventive Measures and Routine Maintenance

5.1 Regular Inspection and Maintenance

  • Developing a Maintenance Plan: Formulate a regular maintenance plan based on the equipment’s usage and the manufacturer’s recommendations, including contactor inspection, line tightening, parameter verification, etc.
  • Executing Maintenance Tasks: Regularly perform maintenance tasks according to the maintenance plan to ensure the equipment is in good condition.

5.2 Training and Operating Specifications

  • Training Technicians: Provide professional training to equipment operators to improve their understanding and handling ability of inverter and contactor faults.
  • Developing Operating Specifications: Formulate detailed equipment operating specifications and maintenance procedures to ensure operators follow the specifications for operation and maintenance.

5.3 Spare Parts Management

  • Stocking Spare Parts: Stock necessary spare parts (such as contactors, coils, etc.) based on the equipment’s usage and historical fault records to enable prompt replacement in case of faults.
  • Managing Spare Parts: Establish a spare parts management system to regularly inspect and update spare parts, ensuring they are of reliable quality and sufficient quantity.

VI. Conclusion

The E0020 contactor fault is a relatively common type of fault during the operation of the WISCO South E-CONVERT 5 series inverter. By thoroughly analyzing the fault causes, adopting scientific diagnostic methods, and implementing effective handling measures, normal equipment operation can be quickly restored, and the impact of faults on production can be reduced. Meanwhile, by formulating preventive measures and strengthening routine maintenance management, the reliability and stability of the equipment can be further improved, creating greater economic and social benefits for enterprises.

Posted on

In-depth Analysis and Engineering-level Solutions for Power Module Unrecognizability and Configuration Download Freeze in SINAMICS S120/S105 Drive Systems

I. Problem Background and Typical Phenomena

During on-site commissioning or maintenance of Siemens SINAMICS S120/S105 multi-axis and single-axis drive systems, the following issues frequently occur:

  • The Control Unit (CU, such as CU310/CU320/CU_S_105) can be online normally.
  • Performing a factory reset and configuration download on the CU alone proceeds normally, but when a Power Module (PM) is added, the download process gets stuck at 90% – 98%.
  • STARTER/Startdrive reports errors, such as “Error occurred while downloading”, “Quantity structure is not permitted”, and “Units/structure inconsistency”.
  • In the parameter interface, the rated power of the PM is displayed as 0.00 kW, and almost all parameters are zero.
  • In the Topology → Actual view, only the CU is visible, and no Power Module can be seen.
  • Fault codes like Fault 7800, 1951/1651/30020 related to structure and synchronization repeatedly appear in the fault buffer.
    Field engineers often repeatedly attempt operations such as factory resets, rebuilding projects, reinstalling software, repeated uploads/downloads, and changing project versions, but the phenomena remain unchanged. About 90% of such cases are misdiagnosed as “parameter problems” or “software problems”, when in fact they are hardware-level disconnection faults.
F.07810 FAULT

II. Understanding the Problem Essence from the System Architecture

SINAMICS S120/S105 is a distributed drive system, with its core composed of three types of units:

  • CU (Control Unit): Responsible for computation, control, communication, and parameter management.
  • PM (Power Module): Responsible for rectification, DC bus operation, inversion, and power output. It contains an independent control board, EEPROM, and communication interface.
  • Motor modules/encoders/expansion modules
    The CU and PM communicate via the DRIVE-CLiQ digital bus at high speed in real-time. When the system is normal, after the PM is powered on, its internal logic power supply starts, the nameplate data in the EEPROM is read, the PM “registers” on the bus, the CU scans the bus to establish the actual topology, reads the PM’s hardware information, and Starter allows parameter downloads based on the real hardware structure. “Topology recognition” is a prerequisite for all parameter configuration and downloads.
SIMENS STARTER CONFIGURATION

III. Why a “Download Stuck at 98%” is Almost Never a Software Problem

The general sequence of the SINAMICS download process is as follows: establishing online communication, verifying the CU, verifying the project structure, verifying topology consistency, writing CU parameters, writing PM parameters, writing drive data sets, synchronizing the structure, and completing the process. When “the CU can be downloaded normally, but the process gets stuck at 90 – 98% after adding the PM”, it indicates that communication, software, the CU, and the project files are normal, and the failure occurs during the stage of writing/synchronizing Power Module data. If, at the same time, no PM is visible in Topology → Actual and the PM rated power is 0.00 kW, it means the CU has not detected the Power Module at the physical layer, and the “download failure” is due to the system waiting for a non-existent hardware node.

Fault code 7800, fault value 0x0  on STARTER

IV. Key Criterion: Topology Structure is More Important than Fault Codes

In the SINAMICS system, the topology view is the most crucial factor for judging such problems.

  • Normal state: In Topology → Actual, at least the CU and PM (with order number, serial number, and type) should be visible. Even if the PM parameters are lost or the EEPROM is abnormal, it will be displayed as an Unknown module or Faulty module.
  • Current case: The topology scan is completed, and the log shows that uploading the actual topology is finished, but only the CU is present in the result, with no Power Module node. This is the strongest evidence indicating that at the DRIVE-CLiQ physical layer, the PM does not exist.

V. The True Meanings of Fault 7800/Structure Inconsistency/0 kW

These prompts are “result-type faults”:

  • Fault 7800: Its essence is that there is a module in the project, but it is not present on the actual bus.
  • Power unit rated power = 0.00 kW: The CU has not read any nameplate data from the PM, indicating that the EEPROM is not responding or the control board is not powered on, not that “parameters have not been written”, but that “the device does not exist”.
  • Quantity structure not permitted: It means that the current actual system structure does not allow writing the project structure.
An error occurs when downloading data from STARTER to S120.

VI. Factors That Can Be Excluded

When the CU is online normally and the PM does not enter the topology, the following factors can be directly excluded:

  • Software version issues
  • Project file issues
  • Parameter setting issues
  • Incomplete factory resets
  • Incorrect commissioning sequence
  • User operation errors

VII. Definable Root Cause Ranges (Sorted by Probability)

When the PM does not enter the topology, there are only five types of root causes in engineering terms:

  • Internal logic power supply damage of the PM (highest probability): The 24V → 5V/3.3V/1.2V power supply fails to oscillate, the control board is not powered on, the LED does not light up or behaves abnormally, and the PM physically exists but is “electronically dead”.
  • Control board damage of the PM: The MCU does not start, the clock fails to oscillate, the reset circuit is abnormal, and the DRIVE-CLiQ chip does not work.
  • Severe damage to the PM’s EEPROM/Flash: The program area is damaged, the nameplate area is unreadable, and the module cannot complete self-startup.
  • Hardware damage to the DRIVE-CLiQ interface: The PHY chip is damaged, the isolator is damaged, the interface is damaged by ESD, and the CU cannot detect the node on the bus.
  • Complete lack of auxiliary power supply for the PM: The internal auxiliary power supply is damaged, the control board has no power, which is equivalent to the module not being powered on.

VIII. Standard Engineering-level Diagnostic Path

When “download stuck at 98% + no PM in topology” occurs, the only correct diagnostic route is at the hardware layer.

  • Step 1: Observe the PM’s status, check if there are any LEDs, whether there are any reactions when powered on, and whether there is initialization flashing.
  • Step 2: Detect the PM’s control power supply. If maintenance conditions permit, measure the 24V on the PM’s control board and the DC/DC outputs (5V/3.3V/1.2V).
  • Step 3: Rule out external communication problems by replacing the DRIVE-CLiQ cable and interface and conducting a separate CU ↔ PM connection test.
  • Step 4: Perform cross-validation by connecting a known normal PM to this CU or connecting this PM to a known normal CU.

IX. Engineering Conclusions and Handling Strategies

After confirming that the PM does not enter the topology, the system engineering conclusion is a hardware-level fault of the Power Module. There are two technical routes:

  • Board-level repair: Suitable for situations where there is electronic repair capability, power supply analysis capability, and chip-level maintenance conditions. Focus on checking the auxiliary power supply, EEPROM, control MCU, and DRIVE-CLiQ PHY.
  • Module replacement: Suitable for on-site emergency repairs, situations without maintenance conditions, and when key equipment is shut down. Directly replace the PM with the same model, and the problem will disappear.

X. Common Misconceptions Among Engineering Personnel

MisconceptionActual Situation
Constantly changing parametersThere is no device at the physical layer
Repeatedly performing factory resetsIneffective for disconnected modules
Reinstalling StarterUnrelated to hardware
Believing it is a “system malfunction”Actually, it is PM electronic failure
Thinking the error prompt indicates “illegal parameters”Actually, it means the structure does not exist

XI. Final Conclusion

When in the SINAMICS system, the CU is normal, the PM download always fails, the PM parameters are zero, and no PM is present in the topology, it can be directly concluded that this is a hardware-level disconnection or failure fault of the Power Module, not a commissioning, software, or engineering problem, but a repair or replacement problem.

XII. Practical Value for Maintenance Companies

For maintenance-oriented companies, such cases are of great significance:

  • They can be quickly (qualitatively determined) to avoid ineffective debugging.
  • They can professionally persuade customers to enter the maintenance phase.
  • They can serve as typical “PM control board damage” maintenance cases.
  • They can help form a standard testing process.
  • They can be used as a basis for quotation and technical explanations.

XIII. One-sentence Summary

In the SINAMICS system, as long as the Power Module does not enter the topology, all download and parameter problems are illusions. The real problem lies only in the hardware.

Posted on

Analysis of the Reasons Why ABB EL3020 Infrared Analyzer Cannot Enter Manual Zero/Span Calibration and Engineering Solutions

I. Problem Background and On-site Phenomena

ABB EL3020 infrared gas analyzers are widely used in industrial flue gas analysis, process gas monitoring, and environmental online monitoring systems for the continuous measurement of gases such as CO, CO₂, SO₂, and NOx. They feature both automatic and manual calibration functions. During on-site operation and maintenance, it is common to encounter a situation where, despite having introduced zero gas and span calibration gas in preparation for manual calibration, when accessing the “Manual Calibration” menu, the instrument interface displays the message “ATTENTION: Autocalibration is running!”. At this point, the zero and span calibration menus cannot be accessed, and the buttons cannot be used to select calibration items. The instrument appears to be “stuck” on the calibration interface, leading customers to mistakenly assume it is a system crash, panel failure, or software anomaly. In reality, this is due to the normal operation of the EL3020’s internal calibration logic.

 Autocalibration is running
EL3020

II. Overview of the EL3020 Calibration System

The EL3020 belongs to the ABB EasyLine/EL3000 series, and its calibration modes are divided into two categories: automatic calibration and manual calibration, with the system design following an exclusion principle.

1. Automatic Calibration

  • Characteristics: It can be executed periodically at set times (e.g., once a day or once a week), triggered by external signals (such as from a PLC, digital input (DI), or Modbus), or initiated automatically after power-on. It automatically completes zero and span calibrations and controls the switching of calibration gases using solenoid valves.
  • Purpose: To ensure the long-term stable operation of the analyzer without human intervention, preventing measurement errors caused by optical drift and environmental changes.

2. Manual Calibration

  • Usage: It is used for initial installation and commissioning, after replacing components such as the optical module, for calibration gas comparison, post-repair calibration, and abnormal correction.
  • Operation: It is carried out by engineers on-site and requires human confirmation of zero gas, span gas, and stabilization time, among other factors.

3. Exclusion Principle

During automatic calibration, the manual calibration function is forcibly locked by the system to prevent the simultaneous writing of calibration parameters by automatic and manual processes, interference with the calibration process by human actions, and measurement inaccuracies caused by parameter confusion.

III. Meaning of the “Autocalibration is running” Status

When the EL3020 displays “Autocalibration is running”, it does not necessarily mean that the device is actively switching solenoid valves to introduce calibration gases. Instead, it indicates that the system’s automatic calibration process is in an incomplete state, which may result from the following situations:

1. Automatic Calibration is Actually in Progress

For example, when the instrument has just been powered on, when it has reached the scheduled time for automatic calibration, or when an external PLC has just triggered a calibration signal. At this time, the instrument is undergoing processes such as gas circuit switching, sensor stabilization, zero-point collection, span collection, data calculation, and storage. Manual calibration is locked until these processes are completed.

2. Automatic Calibration was Interrupted, and the Status was Not Reset (Most Common)

During the calibration process, sudden power outages, insufficient calibration gas pressure, gas circuit blockages or leaks, abnormal optical module signals, premature termination by operators, or abnormal external control signals can cause the automatic calibration process to be incomplete. As a result, the system’s “calibration status bit” remains in the “running” state, and the menu is locked.

3. The Preconditions for Automatic Calibration Are Not Met for an Extended Period

If the sensor signal remains unstable for a long time, the temperature or light intensity does not reach the stability threshold, the zero gas or span gas concentration is not within a reasonable range, or the flow rate is abnormal, the automatic calibration process will continue to wait for these conditions to be met, and the status will remain “running”.

Physical internal structure diagram of EL3020

IV. System Design Reasons

From the perspective of analyzer system safety, it is a reasonable design to lock manual calibration when automatic calibration is not completed. Writing parameters during automatic calibration while manual writing occurs can lead to EEPROM data conflicts. Forcing a span calibration before zero-point collection is completed can cause serious proportional errors. An incomplete automatic calibration indicates that the current parameters have unknown credibility. Forcibly opening the manual entry point can easily result in “the more adjustments, the more errors” situations. Therefore, the EL3020 adopts a “status lock” mechanism, and manual calibration will always be unavailable as long as the automatic calibration status is not cleared.

V. On-site Solutions

Engineering handling should follow the principle of “from software to hardware, from simple to complex”.

✅ Solution 1: Wait for the Automatic Calibration to Complete (Preferred)
When the device has just been powered on or an automatic calibration has just been triggered, ensure a normal supply of zero gas and span gas, and maintain stable flow, pressure, and temperature. Observe whether the status ends on its own. After the automatic calibration process is fully completed, the system will automatically release the manual calibration menu. This solution is suitable for newly commissioned instruments, normal periodic calibrations, and warm-up stages.

✅ Solution 2: Attempt to Abort the Automatic Calibration in the Menu
Some EL3000 series models support options such as “Abort Calibration” or “Stop Auto Calibration”. If such options are available in the menu, you can try to terminate the automatic process to make the system exit the “running” state. This solution is suitable for situations where the automatic calibration is obviously stuck, there is a history of human triggering, and you do not want to restart the device.

✅ Solution 3: Power Off and Restart (Most Common and Effective)
If the automatic calibration status cannot end on its own, stop the measurement, turn off the gas supply, and power off the instrument for at least 30 seconds. Then, power it back on, wait for the system to fully start up, and do not trigger the automatic calibration. Directly access the manual calibration menu. This solution is suitable for situations where the automatic calibration is abnormally interrupted, the menu is permanently locked, or the status is clearly abnormal.

✅ Solution 4: Eliminate the Root Cause of the Inability to Complete Automatic Calibration
If the device repeatedly enters the “Autocalibration is running” state and cannot end, you need to investigate the root cause. Focus on checking whether the zero gas is truly zero, whether the span gas concentration is correct, whether the gas circuit is blocked, whether the solenoid valves are functioning, whether the flow rate is stable, whether the sensor signal is within a reasonable range, and whether there are external signals continuously triggering calibration. Otherwise, even after a restart, the device may enter automatic calibration again and get stuck.

VI. Engineering Experience Summary

In the EL3020 and the entire EL3000 series, the inability to enter manual calibration is almost never due to a broken panel and rarely a true software fault. In most cases, it is caused by the “automatic calibration status not being cleared”. The handling logic is not about “how to access it” but rather figuring out why the system believes that automatic calibration has not ended, why automatic calibration cannot be completed normally, and how to make the automatic process end correctly or be reset.

VII. Summary

Currently, the instrument is in the automatic calibration state. According to ABB’s design logic, the system will forcibly lock the manual zero and span calibration menus until the automatic calibration is completed. This is not a fault but a protection mechanism. You need to first allow the automatic calibration to complete or clear the automatic calibration status through a restart before performing manual calibration.

VIII. Conclusion

The “Autocalibration is running” message on the EL3020 reflects the instrument’s internal calibration status management mechanism. Correctly understanding it helps engineering personnel quickly determine the nature of the problem, avoid盲目 (blindly) disassembling the instrument or mistakenly assuming damage to the main board, improve on-site fault handling efficiency, and reduce the secondary risks caused by misoperations. The key to solving the problem lies in understanding “why the automatic calibration has not ended”.

Posted on

Fanuc αi Series CNC System Servo Watchdog Alarm and Communication Fault Diagnosis and Maintenance Guide

1. Introduction

The Fanuc αi series CNC system, as the core control platform for modern computer numerical control (CNC) machine tools, plays a crucial role in precision machining and automated production. This series integrates advanced servo amplifiers, pulse encoders, and fiber-optic communication technologies to ensure high-precision, high-speed axis motion control. However, system failures are inevitable during actual operation, with servo watchdog alarms (SYS ALM 426 SERVO WATCH DOG ALARM) and spindle servo amplifier alarms (ALM 124) being common issues. These faults often lead to system shutdowns, impacting production efficiency.

According to Fanuc’s official data, such alarms mostly stem from communication interruptions, hardware damage, or external interference. If not promptly diagnosed, they may trigger a chain reaction, such as axis runaway or motor overload. Based on the Fanuc αi series manuals (e.g., B-65282EN) and practical maintenance experience, this article systematically elaborates on the principles, causes, diagnostic methods, and maintenance strategies for these faults, aiming to provide comprehensive guidance for technicians. Through in-depth analysis, we will uncover the root causes of the faults and propose optimization measures to enhance system reliability and maintenance efficiency.

The Fanuc αi series servo system employs a serial communication architecture, including the FSSB (FANUC Serial Servo Bus) fiber-optic bus for data exchange between the CNC controller and servo amplifiers. This design improves anti-interference capabilities but introduces specific vulnerabilities, such as the physical integrity of fiber-optic cables. The ALM 426 alarm essentially triggers the system’s monitoring mechanism to prevent servo runaway caused by microprocessor hang-ups, while ALM 124 directly points to serial data transmission abnormalities in the spindle amplifier. Such faults account for 15%-20% of servo-related issues in global CNC applications, particularly in machine tools operating under high loads or in harsh environments. Understanding the triggering logic of these alarms is crucial for quickly restoring production. This article will commence with fault phenomena and progressively unfold the full diagnostic and maintenance process, ensuring technical depth and practicality.

sys_alm426 servo watch dog alarm
servo card

2. Fault Phenomena and Alarm Code Interpretation

2.1 Description of SYS ALM 426 SERVO WATCH DOG ALARM

When the Fanuc αi series CNC system is powered on or during operation, if the screen displays “SYS ALM 426 SERVO WATCH DOG ALARM,” accompanied by diagnostic information such as the program counter (PROGRAM COUNTER), access address (ACCESS ADDRESS), and access data (ACCESS DATA), along with a prompt stating “THE SYSTEM ALARM HAS OCCURRED, THE SYSTEM HAS STOPPED,” it indicates that the system has entered a protective state. This alarm typically halts all axis movements and locks the CNC interface, preventing the execution of any commands.

From a hardware perspective, this is a system-level error involving the monitoring timer on the axis control card (Axis Control Card). The watchdog mechanism is a hardware/software-combined fault detector that monitors the CPU’s execution state by periodically resetting a timer. If the CPU fails to reset the timer within the specified time (e.g., due to a dead loop, memory error, or interrupt loss), the timer overflows, triggering the alarm.

Specifically for the αi series, diagnostic data such as the access address 010000802H often points to RAM parity errors (Parity Error) or pulse encoder feedback interruptions. The system log may display a timestamp, such as 2026/01/06 07:33:35, recording the moment of fault occurrence. This not only facilitates traceability but also allows correlation with environmental factors, such as power fluctuations or electromagnetic interference. In multi-axis systems, ALM 426 may only affect specific axes, but due to the global nature of the watchdog, it often results in a complete system blackout (Black Screen of Death). Compared to other Fanuc series (e.g., the 0i series), the αi series’ watchdog is more sensitive to serial bus stability because it utilizes high-speed fiber-optic communication, where even minor delays can be amplified into timeout errors.

2.2 Description of ALM 124 Spindle Servo Amplifier Alarm

The servo amplifier (e.g., aiSP 26 model, A06B-6114-H026#H580) displays “ALM 124” (or abbreviated as 124), indicating a serial communication error in the spindle module. This alarm typically occurs during power-on self-tests or warm-up cycles and is often accompanied by a联动 (linked) triggering of ALM 426 on the system side. The amplifier panel LED displays “124,” with the status indicator showing ERR (Error) instead of the normal STAT (Status).

In principle, ALM 124 detects abnormalities in serial data transmission between the CNC and the spindle amplifier, including data parity failures, frame losses, or timeouts. The Fanuc αi series spindle amplifiers use LSI (Large Scale Integration) chips to handle serial communication, and any abnormalities in the ROM (Read-Only Memory) or fiber-optic interface will trigger this alarm.

Unlike other amplifier alarms (e.g., ALM 1 for internal fan stop), 124 focuses more on communication layer issues. In real-world scenarios, even replacing the amplifier may not resolve the alarm if the root cause remains unaddressed. This reflects the systemic nature of the fault: spindle communication interruptions feed back to the CNC, inducing watchdog timeouts. According to Fanuc manual B-65285EN, subcodes of ALM 124 may include d2 (Serial Data Error) or d3 (Data Transfer Error), further refining problem localization.

These alarms exhibit strong linkage: ALM 124 acts as the trigger source, amplifying into the system-level ALM 426. Understanding the hierarchical structure of the alarm codes helps prioritize the investigation of peripheral components rather than blindly replacing core hardware.

ALM 124 ERR 
A06B-6141-H026#H580

3. Fault Cause Analysis

3.1 Hardware-Related Causes

Hardware failures are the primary诱因 (contributing factors) for such alarms, accounting for approximately 60% of cases. Firstly, issues with fiber-optic cables (Optical Fiber Cable, such as COP10A/B) are the most common. These cables are responsible for signal transmission via the FSSB bus, and loose connections, fractures, excessive bending (minimum bending radius > 50 mm), or end-face contamination can lead to signal attenuation or reflection, triggering serial communication errors. Fanuc stipulates that the insertion loss of fiber-optic cables should be < 1 dB, and any damage exceeding this value can trigger ALM 124. In harsh workshop environments, dust, oil, or mechanical vibrations further accelerate cable degradation.

Secondly, failures in the pulse encoder (Pulsecoder) or sensors on the spindle motor side are crucial. The encoder provides position feedback, and if there is an A/B phase shift, no pulse output, or serial data abnormalities (e.g., SP0132 error), the feedback loop is interrupted, leading to watchdog timeouts. Noise interference (Noise Interference) is another key factor: electromagnetic noise transmitted from power lines or nearby equipment can interfere with serial signals. Fanuc diagnostic numbers DGN 356/357 can monitor noise counts, and if the count exceeds 1000, it indicates excessively high environmental noise.

RAM parity errors on the axis control card are a direct cause of ALM 426. This card integrates the CPU and memory, and if radiation or aging causes bit flips, parity failures trigger the alarm. Additionally, damage to internal modules in the amplifier, such as the IPM (Intelligent Power Module) or ROM, can indirectly affect communication. Power supply issues cannot be overlooked: a low DC link voltage (< 300 V) or improper sequencing (CNC powering on before the amplifier) can induce initial communication failures.

3.2 Software and Parameter Configuration Causes

At the software level, parameter mismatches are a common issue. For example, incorrect settings for parameters 2557 (Amplifier Groups) or 3716#0 (Spindle Serial Output) can lead to incompatible communication protocols. If parameters are not reinitialized after replacing an amplifier, old configurations may conflict, triggering ALM 124. Improper backup of Fanuc system parameters (e.g., during battery replacement with a power interruption) can result in lost calibrations, further exacerbating faults.

Furthermore, inconsistent firmware versions are problematic: the ROM version of the αi series amplifier must match that of the CNC, and improper upgrades can lead to serial data format errors and alarms. Noise countermeasure parameters (e.g., filtering thresholds) that are not optimized can also indirectly cause timeouts. In multi-axis synchronous control, incorrect program commands (e.g., moving a slave axis) can induce watchdog alarms.

3.3 External Environment and Operational Factors

External factors include overheating, vibration, and contamination. Activation of the amplifier’s thermal switch (Thermal Switch) can interrupt communication, while high workshop humidity may lead to cable corrosion. Operational missteps, such as excessive pulling during cable installation or failure to adhere to the minimum bending radius, can also pose hidden risks. Fanuc emphasizes that fiber-optic cable handling requires specialized tools to avoid fingerprint contamination on end faces.

Globally, power fluctuations (e.g., unstable power grids) account for 10% of the causes, particularly in developing countries. Environments that do not meet electromagnetic compatibility (EMC) standards can amplify noise interference. Comprehensive analysis reveals that these causes often intersect: a loose cable may trigger a chain reaction leading to RAM errors.

4. Diagnostic Process

4.1 Preliminary Inspection Steps

Diagnosis begins with safely powering off the system: turn off the main power supply and wait 5-10 minutes for discharge. Visually inspect all cables: check if the fiber-optic COP10A/B cables are securely connected, free from bends or damage. Use a flashlight to test the fiber-optic cables: shine light into one end and observe the intensity at the other end; if dim, it indicates excessive attenuation. Clean the connector end faces using a lint-free cloth and isopropyl alcohol, avoiding cotton swab fibers.

After powering on, record the complete alarm log, including timestamps and access addresses. Enter MDI mode and press the diagnostic key to view DGN parameters: check DGN 356/357 for noise and DGN 409 to verify servo status. If noise levels are high, isolate high-power equipment. Perform a cable swap test: move the suspect cable to another axis; if the alarm shifts, confirm the cable fault.

4.2 Advanced Diagnostic Methods

Use Fanuc SERVO GUIDE software to analyze signal waveforms: connect a laptop and monitor the pulse encoder output. If the A/B phase shift exceeds 5%, replace the encoder. Use an oscilloscope to measure the DC link voltage, ensuring it falls within the 283-339 V range. Check the amplifier fuses (FU2) and polarity: a short circuit in the CXA2A/B cable can directly trigger ALM 124.

For ALM 426, inspect the axis control card: remove the card board and check for burn marks on the RAM chips. If a parity error occurs, use diagnostic tools to clear the registers, but if it recurs, replace the card board. Noise troubleshooting includes adding shielding covers and improving grounding (< 0.1 Ω resistance). In complex cases, refer to Fanuc manual B-65280EN to perform automatic parameter initialization.

Diagnosis should proceed layer by layer: start with peripherals (cables, power supply) and then move to core components (board cards, ROM). The average diagnostic time is 2-4 hours, depending on tool availability.

5. Maintenance Methods

5.1 Component Replacement and Repair

If cable faults are identified, replace them with original Fanuc fiber-optic cables (A66L-6001 series), ensuring the connection torque is 3.5-4.5 Nm. After replacing an amplifier (e.g., aiSP 26), verify that the serial number matches and reset the parameters. If the encoder is damaged, replace the entire motor assembly to avoid calibration loss from disassembly.

For RAM errors, replace the axis control card (A20B-3300 series) and transfer backup parameters. ROM damage requires professional burning or replacement of the amplifier PCB. For power supply issues, replace the rectifier module and ensure the AC input voltage is within the 283-339 V range.

5.2 Parameter Adjustment and Software Optimization

Enter parameter mode (press PROG + RESET) and modify relevant parameters: set parameter 4657 to match the amplifier group. For noise countermeasures, adjust filtering parameters (e.g., enable noise suppression with 2200#4). Upgrade the firmware using Fanuc tools to ensure version compatibility. Backup parameters using a CF card monthly.

5.3 Preventive Maintenance Strategies

Regular maintenance is key: inspect cable integrity monthly and clean connectors quarterly. Monitor temperatures below 50°C and avoid overloading. Implement EMC measures: separate control lines from power lines by > 30 cm. Train operators on proper cable handling to avoid pulling. Fanuc recommends annual professional audits using thermal imaging cameras to detect hot spots. Establish a maintenance log according to ISO 9001 standards to track fault patterns.

6. Case Studies

6.1 Case Study 1: Linked Alarms Triggered by Cable Fault

On a Doosan machine tool, ALM 426 and 124 appeared upon power-on. Initial inspection revealed excessive bending of the fiber-optic cable, causing a 30% signal attenuation. Replacing the cable resolved the alarms. Lesson learned: Adhere to bending radius specifications during installation.

6.2 Case Study 2: Persistent Fault Due to Noise Interference

After replacing the amplifier, the alarm recurred. Diagnosis showed a noise count > 5000. Adding shielding and improving grounding resolved the issue. Analysis: Nearby welding machines were interfering with the serial signals.

6.3 Case Study 3: Software Issue from Parameter Mismatch

After installing a new amplifier, ALM 124 appeared. Checking revealed that parameter 3716#0 was not set; adjusting it resolved the issue. Emphasis: Hardware replacement must be accompanied by software configuration.

These cases are sourced from real forum discussions, highlighting the systematic nature of diagnosis.

7. Conclusion

Diagnosing and maintaining servo watchdog alarms and communication faults in the Fanuc αi series require a multi-dimensional analysis of hardware, software, and environmental factors. Through the detailed principle interpretations, cause analyses, diagnostic processes, and maintenance methods presented in this article, technicians can efficiently address such issues and reduce downtime. In the future, with the integration of IoT, predictive maintenance will further lower fault rates. Adhering to best practices ensures long-term stable operation of the system.

Posted on

In-depth Analysis and Troubleshooting Strategies for Siemens SINAMICS S120 Drive Fault F07810: Power Unit EEPROM Lacks Rated Data

I. Introduction

The Siemens SINAMICS S120 series drives, as representatives of high-performance, modular frequency converters, are widely used in the field of industrial automation. However, the fault F07810 – “Drive: Power unit EEPROM without rated data” has become a common issue affecting the stable operation of the system. This article provides an in-depth analysis of the causes, diagnostic methods, solutions, and preventive strategies for this fault, aiming to offer comprehensive technical guidance to engineers.

F.07810 fault

II. Overview and Architecture of the SINAMICS S120 Drive System

  • Modular Design: The S120 system consists of a control unit (CU), power modules (PM), sensor modules (SM), and auxiliary components. It supports single-axis and multi-axis applications, with a power range covering from 0.12 kW to 1200 kW.
  • DRIVE-CLiQ Communication: This high-speed serial interface enables seamless communication between modules and supports plug-and-play functionality, although there is a potential risk of communication interruptions.
  • Role of EEPROM: It stores the rated data of the power unit (such as power, current, and voltage parameters), which is the basis for the drive’s self-check and parameterization. Data loss will trigger the F07810 fault.

III. Detailed Analysis of Fault F07810

Causes of the Fault

  • EEPROM Hardware Failure: Chip damage, aging, or environmental factors (such as overheating or voltage spikes) can lead to data loss.
  • Data Erasure or Corruption: Power interruptions, electromagnetic interference, or failed firmware upgrades can cause data errors.
  • Module Incompatibility: When replacing a power module, if the matching data is not pre-loaded or the code number does not match, this fault may occur.
  • Software Parameter Issues: Incorrect parameter settings or checksum errors.
  • External Factors: Unstable power supply, poor grounding, or damaged cables.

Symptoms of the Fault

  • The operation panel displays the F07810 code, and the drive cannot enable pulses.
  • The system log records relevant alarms. In multi-axis configurations, only specific axes are affected.
  • Diagnostic Parameters: By using the STARTER software to view parameters p0205 to r0209, if invalid values are displayed, it confirms the absence of EEPROM data.

IV. Diagnostic Methods

  • Preliminary Inspection: Confirm the fault code and timestamp, and check the historical alarms.
  • Power Supply and Connection Verification: Check the stability of the power supply and the connections of the DRIVE-CLiQ cables.
  • Software Diagnosis: Use the STARTER software to read the fault buffer and verify the EEPROM parameters.
  • Hardware Testing: Check the appearance of the power module and the voltage at the EEPROM pins.
  • Cross-Verification: Test with a spare module to confirm the source of the fault.
  • Advanced Tools: Run an EEPROM integrity check and record the diagnostic process.

V. Solutions

  • Immediate Confirmation: Press the ACK key on the operation panel or confirm the fault through software.
  • Power Restart: Completely power off and then restart the system to attempt self-recovery.
  • Parameter Reset: Reset to factory settings and reload the project file.
  • EEPROM Reprogramming: Use service tools to write the rated data (authorization required).
  • Module Replacement: Replace the power unit, and the system will automatically recognize the EEPROM data.
  • Contact Support: Seek Siemens remote diagnosis or on-site service for difficult problems.
6SL3040-0PA01-0AA0

VI. Preventive Strategies

  • Design Optimization: Select modules that are resistant to environmental factors and ensure good grounding and shielding.
  • Regular Maintenance: Check the EEPROM parameters and firmware version every six months.
  • Backup Management: Regularly back up project files and test compatibility before upgrading firmware.
  • Environmental Control: Maintain a cabinet temperature below 40°C and a humidity below 80%, and install an uninterruptible power supply (UPS).
  • Training and Documentation: Strengthen engineer training and establish standard operating procedures (SOPs).

VII. Common Related Faults and Their Extensions

  • F07800: Power unit missing. Resolve by reconnecting the DRIVE-CLiQ.
  • F07815: Power unit code number mismatch. Verify the serial number and then replace it.
  • F30005: Overcurrent. Check the motor data and parameter consistency.
  • A07810: Warning-level version, often appears before F-level faults.

VIII. Case Studies

  • Case 1: A machine tool factory experienced voltage spikes due to lightning strikes, triggering the F07810 fault. After replacing the power module and installing a UPS, the fault rate significantly decreased.
  • Case 2: A printing press frequently upgraded its firmware, leading to EEPROM fatigue. By implementing a backup strategy, zero faults were achieved.

IX. Conclusion

Although the F07810 fault is common, by having an in-depth understanding of the S120 architecture and the role of the EEPROM, combined with systematic diagnostic methods and preventive strategies, problems can be efficiently solved and the stable operation of the system can be ensured. In the future, AI-assisted diagnosis will further simplify the fault handling process, and engineers need to continuously learn to adapt to technological evolution.