Abstract
Laser particle size analyzers are widely used in fields such as materials science, powder technology, biopharmaceuticals, and mineral processing. Their measurement accuracy and repeatability are key indicators for evaluating equipment performance. The Anton Paar PSA 1090 LD, as a high-precision wet laser particle size analyzer, may encounter typical abnormalities such as “slow drainage, low flow rate, system blockage, poor measurement repeatability, and large particle size deviation” during long-term use. Based on actual fault cases of a user’s equipment, this study conducts a systematic analysis from multiple dimensions including the light path, flow path, circulation pump, dispersion cell, and drainage channel, and proposes technical cause determination methods and engineering maintenance steps. This article aims to provide a complete set of fault diagnosis methods and scientific maintenance paths for third-party laboratories, after-sales engineers, and equipment users, helping to improve instrument reliability and service life.

1. Introduction
Laser particle size analyzers play an irreplaceable role in the field of powder and particle material characterization. With the rapid development of materials science and nanotechnology, the requirements for the accuracy, stability, and repeatability of particle size testing continue to increase. The Anton Paar PSA 1090 LD, as an internationally recognized laser particle size analyzer, has core advantages such as high light path stability, good dispersion effect, and high system automation. However, even high-end equipment may still encounter typical problems such as “slow drainage, blockage, poor repeatability, and large particle size deviation” during long-term operation or improper maintenance.
Based on real-world usage cases, this article, from the perspective of third-party laboratory engineers, systematically analyzes the root causes of such faults and provides immediately implementable diagnostic methods, aiming to provide high-value references for relevant practitioners.
2. Working Principle and System Composition of the PSA 1090 LD
To understand why the equipment exhibits abnormalities, it is necessary to first understand its internal structure and operating mechanism.
2.1 Introduction to the Wet Dispersion System
The PSA 1090 LD uses a wet dispersion method, where the liquid is driven by a circulation pump to form a continuous flow between the sample cell and the water tank. The water flow undertakes three tasks:
- Transporting sample particles
- Ensuring uniform dispersion of particles
- Providing a stable light path environment
The stability of the flow rate determines whether the sample can uniformly pass through the light beam and whether the measurement can be precise.

2.2 Structure of the Light Path System
The laser is emitted from the transmitting end, passes through the sample in the sample cell, and the scattered light is collected by the detector. If the light path is affected, it will lead to significant data deviations.
Light path window contamination may cause:
- Unstable scattered light intensity
- Increased data noise
- Abnormal oscillation of the particle size curve
This is an important factor contributing to measurement deviations.
2.3 Importance of the Circulation System and Fluid Dynamics
The circulation system consists of:
- Suction hose
- Circulation pump
- Flow cell (sample cell)
- Drainage channel
An increase in resistance at any position will lead to:
- Decreased water flow
- Inability to discharge bubbles
- Accumulation of particles in the cell
- Unstable test curves
Actual cases show that fluid dynamic problems are the main source of abnormalities in the PSA series.
3. Fault Manifestations and Initial Symptoms
According to feedback from the user’s site and video footage, the equipment exhibited typical system fault characteristics.
3.1 Slow Drainage and Insufficient Flow Rate
This is the most intuitive abnormal phenomenon. A normal device should be able to complete drainage quickly, but in this case:
- The drainage speed is significantly reduced
- The water flow is interrupted or intermittent
- There is a noticeable sense of resistance
This indicates partial blockage within the circulation system.
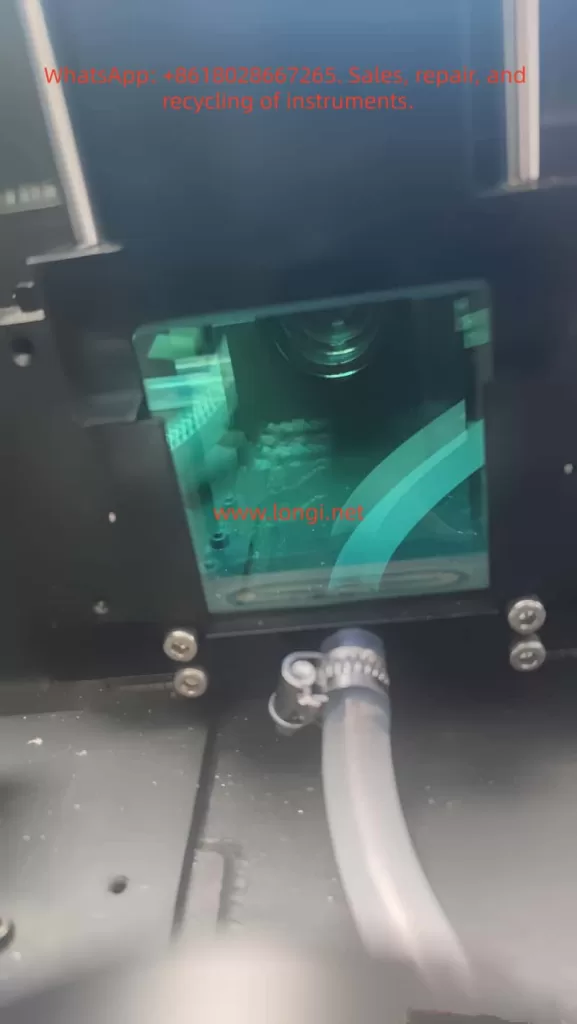
3.2 Particle Deposition and Flocculation in the Sample Cell
From the photos of the sample cell window, it can be seen that:
- There is a large amount of sediment at the bottom
- There are flocculent impurities
- The light path channel is not clean
This directly affects measurement accuracy.

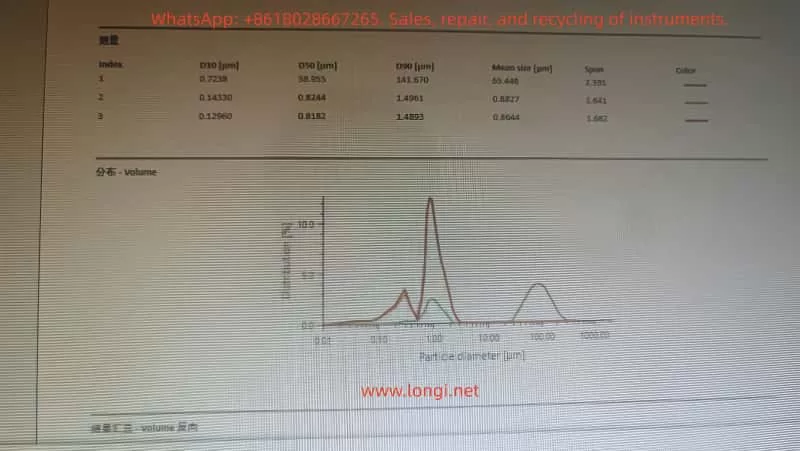
3.3 Huge Deviations in Multiple Measurement Results
For example:
- D50 changes from 0.8 µm to 58 µm (a jump of 70 times)
- The shapes of the three curves are completely different
This phenomenon is definitely not due to sample problems but rather:
- Uneven flow rate
- Incomplete dispersion of aggregates
- Laser signal fluctuations
These cause systematic deviations.
3.4 Bubble Retention and Discontinuous Fluid Flow
The video shows the presence of:
- A large number of bubbles in the liquid
- Interruptions and jumps in the liquid flow
- Inability of the water body to continuously flow through the sample cell
This directly leads to a sharp increase in optical signal noise.
4. Systematic Analysis of Fault Causes
Based on the fault manifestations, the main abnormal sources involved in this case are as follows.
4.1 Blockage in the Dispersion Cell and Flow Cell
The bottom of the sample cell and the drainage outlet are the most prone to blockage. Long-term accumulation of:
- Microparticles
- Scale
- Sediment
- Organic film
will narrow the fluid channel.
Results:
- Insufficient flow rate
- Discontinuous signals
- Jittering of the particle size curve
4.2 Blockage in the Drainage Channel (Core Cause in This Case)
The drainage channel is narrow, and even a small amount of sediment can significantly affect the flow rate. In this case, the obvious slowdown in drainage indicates severe blockage in the channel.
4.3 Insufficient Suction or Excessive Load of the Circulation Pump
The circulation pump is not damaged but rather:
- The resistance in the pathway has increased
- It is difficult to form sufficient flow
- The pump idles, is sluggish, or has fluctuating water output
This leads to abnormalities in the entire system.
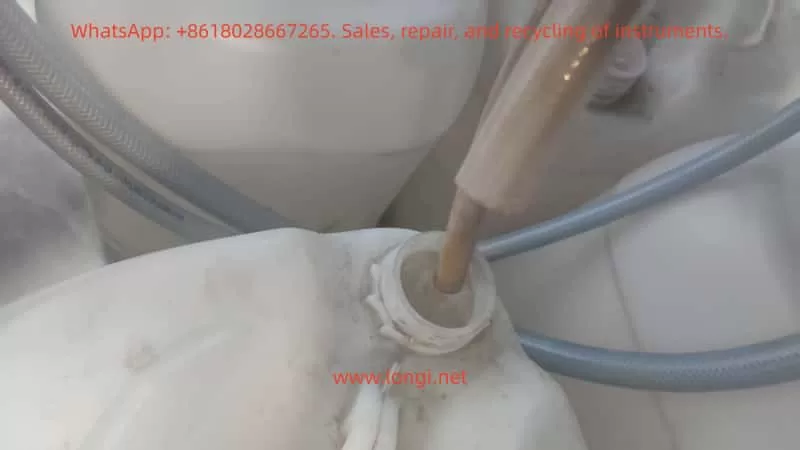
4.4 Aging of the Water Inlet Hose and Formation of Biofilm
The hose in this case has shown:
- Yellowing
- Rough inner walls
- Increased flow resistance
Biofilm or sediment reduces the water absorption efficiency.

4.5 Light Path Window Contamination and Optical Signal Attenuation
Deposits on the window will:
- Change the incident light intensity
- Cause abnormal scattering
- Trigger abnormal peaks in particle size
- Deform the distribution curve
This is significantly present in this case.
4.6 Software Parameter Factors
Although parameters such as refractive index and dispersion mode can also affect the results, they will not cause mechanical problems such as “slow drainage” and can be excluded.
5. Engineering Diagnostic Steps
The following diagnostic process can be used by third-party laboratories to judge the performance of the PSA series wet systems.
5.1 Flow Observation Method
Normal: Continuous flow
Abnormal: Flow interruption, slowness, repeated appearance of bubbles
In this case, the flow rate is severely insufficient.
5.2 Blank Baseline Stability Judgment
A stable signal during blank testing indicates a normal light path; fluctuations suggest light path or fluid abnormalities.
In this case, the baseline noise is significantly increased.
5.3 Evaluation of Ultrasonic Dispersion Effectiveness
If particles still aggregate after ultrasonic activation, it indicates:
- Insufficient flow rate
- Inability to carry away aggregates
rather than a fault in the ultrasonic device itself.
5.4 Inspection of the Optical Window of the Sample Cell
The presence of:
- Mildew spots
- Scale
- Contamination points
may lead to unstable data.
5.5 Drainage Speed Test
The slower the drainage speed, the more it indicates:
- Blockage in the flow channel
- Adherents on the pipe walls
- Excessive system resistance
In this case, the drainage speed has significantly decreased.
5.6 Judgment of Circulation Pump Performance
If the pump can operate normally but the flow rate is insufficient, it is mostly due to excessive resistance, and the pump may not necessarily be damaged.
6. System Maintenance and Recovery Plan (Engineer Level)
The following are the most effective maintenance steps for the PSA series.
6.1 Cleaning the Flow Path: Circulation with 1% NaOH Solution
Steps:
- Add 1% NaOH solution to the water tank
- Operate at the maximum flow rate for 10–15 minutes
- Then rinse with a large amount of pure water for 10 minutes
- If there is an ultrasonic function, activate it for collaborative cleaning
Functions:
- Dissolve sediment
- Remove biofilm
- Clean the flow channel
6.2 Reverse Flushing of the Sample Cell (Key Step)
Using a 50–100 mL syringe:
- Unplug the drainage hose
- Aim the syringe at the drainage outlet
- Inject water backward into the sample cell
It is normal to flush out black or yellow sediment. This is the most effective unclogging method for the PSA series.
6.3 Replacement of the Water Inlet Hose and Drainage Pipe
Aging hoses cause poor water absorption. In this case, the pipes are obviously aged and need to be completely replaced with new ones.
6.4 Cleaning Method for the Light Path Window
Use:
- 70–99% IPA
- Fiber-free cotton swabs
Gently wipe the contaminated areas and avoid scratching with hard objects.
6.5 Standard Process for Eliminating Bubbles
- Operate at the maximum circulation
- Tilt the instrument by 20–30 degrees
- Discharge the liquid multiple times
- Continuously observe the changes in bubbles inside the sample cell
6.6 Final Calibration and Repeatability Verification
Test:
- Three repeatability curves
- Stability of D10, D50, and D90
- Baseline noise level
After recovery, the curves should have a high degree of overlap.
7. Case Study: Correspondence between Abnormal Data and Real Causes
In this case, typical “data distortion caused by unstable system flow rate” is observed.
7.1 Abnormal Shoulder Peaks in the Particle Size Distribution Curve
Shoulder peaks indicate that the particles are not uniformly dispersed, which is a false peak caused by unstable flow.
7.2 Direct Correlation between D50 Jumps and Flow Rate Problems
Insufficient flow rate will lead to:
- Deposition of large particles, resulting in false large particle peaks
- Uneven concentration, causing jumps
This is completely consistent with this case.
7.3 Reasons for Different Shapes of Three Measurement Curves
- Interruption of water flow
- Bubbles passing through the light path
- Fluctuations in sample concentration
Not due to the sample itself.
8. Preventive Maintenance Strategies and Recommendations
To prevent similar faults from occurring again, the following maintenance system should be established:
8.1 Lifespan Management of Pipelines
It is recommended to replace hoses every 6–12 months.
8.2 Flow Path Cleaning Plan
Recommendations:
- Clean with pure water once a week
- Perform NaOH circulation once a month
- Conduct reverse flushing once a quarter
8.3 Light Path Maintenance Cycle
Check the light path window every 1–2 months and immediately remove any scale if present.
8.4 Water Quality and Environment
Must use:
- Deionized water (electrical conductivity < 10 μS/cm)
- Clean sample cups
- Avoid dust entering the water tank
9. Conclusion
This case fully demonstrates that when the Anton Paar PSA 1090 LD exhibits faults such as “slow drainage, blockage, and large particle size deviation,” the root causes are mostly a combination of fluid dynamic abnormalities, light path contamination, and aging pipelines. Through systematic diagnosis and engineering maintenance, the equipment performance can be fully restored.
Key insights include:
- The flow rate is the primary factor affecting the measurement accuracy of wet methods
- The drainage channel and sample cell are the most important cleaning points
- Light path window contamination can sharply reduce measurement repeatability
- Pipeline aging can lead to potential resistance problems
- Ultrasonication and flow rate must work in tandem to ensure sufficient dispersion
For third-party laboratories and engineers, establishing standardized maintenance procedures is a necessary measure to ensure the long-term stable operation of instruments.
