1. Introduction
Polarimeters are widely used analytical instruments in the food, pharmaceutical, and chemical industries. Their operation is based on the optical rotation of plane-polarized light when it passes through optically active substances. Starch, a fundamental carbohydrate in agricultural and food processing, plays a crucial role in quality control, formulation, and trade evaluation.
Compared with chemical titration or enzymatic assays, the polarimetric method offers advantages such as simplicity, high precision, and good repeatability — making it a preferred technique in many grain and food laboratories.
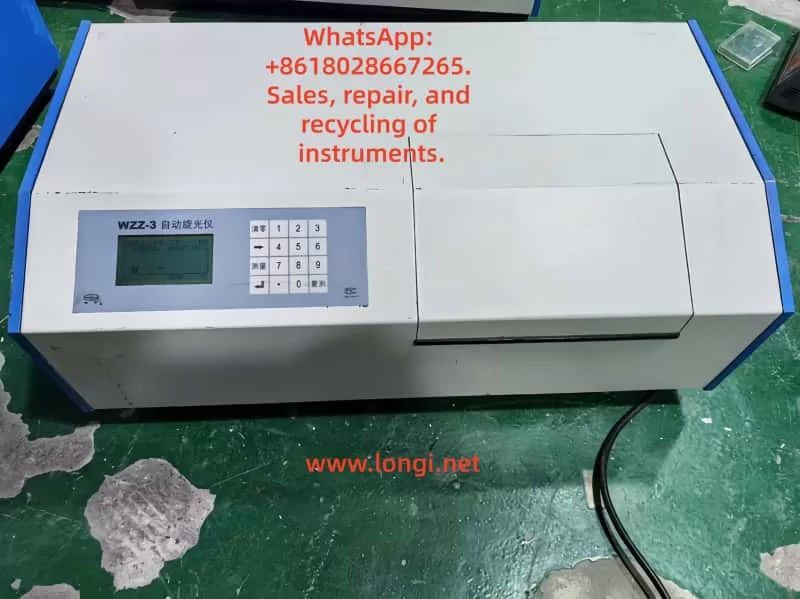
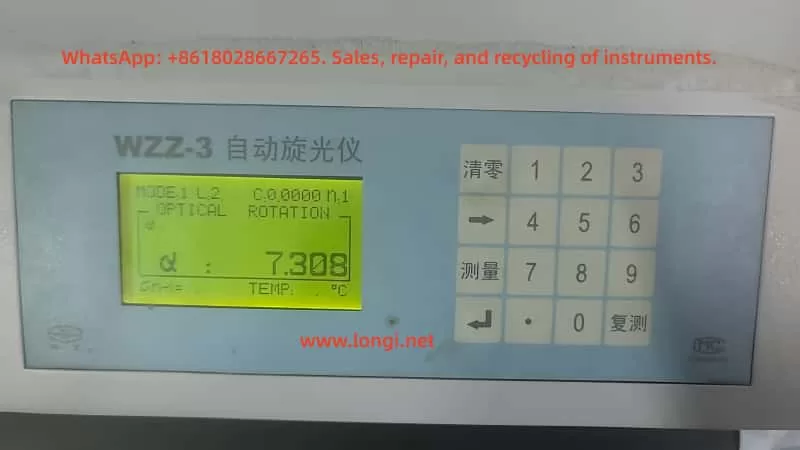
The WZZ-3 Automatic Polarimeter is one of the most commonly used models in domestic laboratories. It provides automatic calculation, digital display, and multiple measurement modes, and is frequently employed in starch, sugar, and pharmaceutical analyses.
However, in shared laboratory environments with multiple users, problems such as slow measurement response, unstable readings, and inconsistent zero points often occur. These issues reduce measurement efficiency and reliability.
This paper presents a systematic technical discussion on the WZZ-3 polarimeter’s performance in crude starch content measurement, analyzing its optical principles, operational settings, sample preparation, common errors, and optimization strategies, to improve measurement speed and precision for third-party laboratories.

2. Working Principle and Structure of the WZZ-3 Polarimeter
2.1 Optical Measurement Principle
The fundamental principle of polarimetry states that when plane-polarized light passes through an optically active substance, the plane of polarization rotates by an angle α, known as the angle of optical rotation.
The relationship among the angle of rotation, specific rotation, concentration, and path length is expressed by:
[
\alpha = [\alpha]_{T}^{\lambda} \cdot l \cdot c
]
Where:
- ([\alpha]_{T}^{\lambda}) — specific rotation at wavelength λ and temperature T
- (l) — optical path length (dm)
- (c) — concentration of the solution (g/mL)
The WZZ-3 employs monochromatic light at 589.44 nm (sodium D-line). The light passes sequentially through a polarizer, sample tube, and analyzer. The instrument’s microprocessor system then detects the angle change using a photoelectric detector and automatically calculates and displays the result digitally.
2.2 System Composition
| Module | Function |
|---|---|
| Light Source | Sodium lamp or high-brightness LED for stable monochromatic light |
| Polarization System | Generates and analyzes plane-polarized light |
| Sample Compartment | Holds 100 mm or 200 mm sample tubes; sealed against dust and moisture |
| Photoelectric Detection | Converts light signal changes into electrical data |
| Control & Display Unit | Microcontroller computes α, [α], concentration, or sugar degree |
| Keypad and LCD | Allows mode selection, numeric input, and measurement display |
The internal control logic performs automatic compensation, temperature correction (if enabled), and digital averaging, ensuring stable readings even under fluctuating light conditions.
3. Principle and Workflow of Crude Starch Determination
3.1 Measurement Principle
Crude starch samples, after proper liquefaction and clarification, display a distinct right-handed optical rotation. The optical rotation angle (α) is directly proportional to the starch concentration.
By measuring α and applying a standard curve or calculation formula, the starch content can be determined precisely. The clarity and stability of the solution directly affect both response speed and measurement accuracy.
3.2 Sample Preparation Procedure
- Gelatinization and Enzymatic Hydrolysis
Mix the sample with distilled water and heat to 85–90 °C until completely gelatinized.
Add α-amylase for liquefaction and then glucoamylase for saccharification at 55–60 °C until the solution becomes clear. - Clarification and Filtration
Add Carrez I and II reagents to remove proteins and impurities. After standing or centrifugation, filter the supernatant through a 0.45 µm membrane. - Temperature Equilibration and Dilution
Cool the filtrate to 20 °C, ensuring the same temperature as the instrument environment. Dilute to the calibration mark. - Measurement
- Use distilled water as a blank for zeroing.
- Fill the tube completely (preferably 100 mm optical path) and remove all air bubbles.
- Record the optical rotation α.
- If the rotation angle exceeds the measurable range, shorten the path or dilute the sample.

4. Common Problems and Causes of Slow Response in WZZ-3
During routine use, several factors can cause the WZZ-3 polarimeter to exhibit delayed readings or unstable results.
4.1 Misconfigured Instrument Parameters
When multiple operators use the same instrument, settings are frequently modified unintentionally.
Typical parameter issues include:
| Setting | Correct Value | Incorrect Setting & Effect |
|---|---|---|
| Measurement Mode | Optical Rotation | Changed to “Sugar” or “Concentration” — causes unnecessary calculation delay |
| Averaging Count (N) | 1 | Set to 6 or higher — multiple averaging cycles delay output |
| Time Constant / Filter | Short / Off | Set to “Long” — slow signal processing |
| Temperature Control | Off / 20 °C | Left “On” — instrument waits for thermal stability |
| Tube Length (L) | Actual tube length (1 dm or 2 dm) | Mismatch — optical signal weakens, measurement extended |
These misconfigurations are the most frequent cause of slow response.
4.2 Low Transmittance of Sample Solution
If the sample is cloudy or contains suspended solids, the transmitted light intensity decreases. The system compensates by extending the integration time to improve the signal-to-noise ratio, resulting in a sluggish display.
When transmittance drops below 10%, the detector may fail to lock onto the signal.
4.3 Temperature Gradient or Condensation
A temperature difference between the sample and the optical system can cause condensation or fogging on the sample tube surface, scattering the light path.
The displayed value drifts gradually until equilibrium is reached, appearing as “slow convergence.”
4.4 Aging Light Source or Contaminated Optics
Sodium lamps or optical windows degrade over time, lowering light intensity and forcing the system to prolong measurement cycles.
Symptoms include delayed zeroing, dim display, or low-intensity readings even with clear samples.
4.5 Communication and Software Averaging
If connected to a PC with data logging enabled (e.g., 5 s sampling intervals or moving average), both display and response speed are limited by software settings. This is often mistaken for hardware delay.
5. Standardized Parameter Settings and Optimization Strategy
5.1 Recommended Standard Configuration
| Parameter | Recommended Setting | Note |
|---|---|---|
| Measurement Mode | Optical Rotation | Direct α measurement |
| Tube Length | Match actual tube (1 dm or 2 dm) | Prevent calculation mismatch |
| Averaging Count (N) | 1 | Fastest response |
| Filter / Smoothing | Off | Real-time display |
| Time Constant | Short or Auto | Minimizes integration time |
| Temperature Control | Off | For room-temperature samples |
| Wavelength | 589.44 nm | Sodium D-line |
| Output Mode | Continuous / Real-time | Avoid print delay |
| Gain | Auto | Optimal signal balance |
These baseline parameters restore the instrument’s “instant response” behavior.
5.2 Operational Workflow
- Blank Calibration
- Fill the tube with distilled water.
- Press “Zero.” The display should return to 0.000° within seconds.
- If slow, inspect optical or parameter issues.
- Sample Measurement
- Load the prepared starch solution.
- The optical rotation should stabilize within 3–5 seconds.
- Larger delays indicate improper sample or configuration.
- Data Recording
- Take three consecutive readings.
- Acceptable repeatability: standard deviation < 0.01°.
- Calculate starch concentration via calibration curve.
- Post-Measurement Maintenance
- Rinse the tube with distilled water.
- Perform “factory reset” weekly.
- Inspect lamp intensity and optical cleanliness quarterly.
6. Laboratory Management Under Multi-User Conditions
When multiple technicians share the same WZZ-3 polarimeter, management and configuration control are crucial to maintaining consistency.
6.1 Establish a “Standard Mode Lock”
Some models support saving user profiles. Save the optimal configuration as “Standard Mode” for automatic startup recall.
If unavailable, post a laminated parameter checklist near the instrument.
6.2 Access Control and Permissions
Lock or password-protect “System Settings.”
Only administrators may adjust system parameters, while general users perform only zeroing and measurement.
6.3 Routine Calibration and Verification
- Use a standard sucrose solution (26 g/100 mL, α = +13.333° per 100 mm) weekly to verify precision.
- If the response exceeds 10 s or deviates beyond tolerance, inspect light intensity and alignment.
6.4 Operation Log and Traceability
Maintain a Polarimeter Usage Log recording:
- Operator name
- Mode and settings
- Sample ID
- Response time and remarks
This allows quick identification of anomalies and operator training needs.
6.5 Staff Training and Certification
Regularly train all users on:
- Correct zeroing and measurement steps
- Prohibited actions (e.g., altering integration constants)
- Reporting of slow or unstable readings
Such standardization minimizes human error and prolongs equipment life.
7. Case Study: Diagnosing Slow Measurement Response
A food processing laboratory reported a sudden increase in measurement time — from 3 s to 15–30 s per sample.
Investigation Findings:
- Mode = Optical Rotation (correct).
- Averaging Count (N) = 6; “Smoothing” = ON.
- Sample solution slightly turbid and contained micro-bubbles.
- Temperature control enabled but sample not equilibrated.
Corrective Measures:
- Reset N to 1 and disable smoothing.
- Filter and degas the sample solution.
- Turn off temperature control or match temperature to ambient.
Result:
Response time returned to 4 s, with excellent repeatability.
Conclusion:
Measurement delay often stems from combined human and sample factors. Once parameters and preparation are standardized, the WZZ-3 performs rapidly and reliably.
8. Maintenance and Long-Term Stability
Long-term accuracy requires regular optical and mechanical maintenance.
| Maintenance Item | Frequency | Description |
|---|---|---|
| Optical Window Cleaning | Monthly | Wipe with lint-free cloth and anhydrous ethanol |
| Light Source Inspection | Every 1,000 h | Replace aging sodium lamp |
| Environmental Conditions | Always | Keep in stable 20 ± 2 °C lab with minimal vibration |
| Power Supply | Always | Use independent voltage stabilizer |
| Calibration | Semi-annually | Verify with standard sucrose solution |
By adhering to this preventive maintenance schedule, the WZZ-3 maintains long-term reliability and reproducibility.
9. Discussion and Recommendations
The WZZ-3 polarimeter’s digital architecture provides high precision but is sensitive to user settings and sample clarity.
Slow responses, unstable zeroing, or delayed results are rarely caused by hardware faults — they are almost always traceable to:
- Averaging or smoothing functions enabled;
- Temperature stabilization waiting loop;
- Cloudy or bubble-containing samples;
- Aging optical components.
To prevent recurrence:
- Always restore “fast response” configuration before measurement.
- Use filtered, degassed, and temperature-equilibrated samples.
- Regularly calibrate with sucrose standards.
- Document all measurements and configuration changes.
Proper user discipline, combined with parameter locking and preventive maintenance, ensures the WZZ-3’s continued performance.
10. Conclusion
The WZZ-3 Automatic Polarimeter is a reliable and efficient instrument for crude starch content analysis when properly configured and maintained.
In multi-user laboratories, incorrect parameter settings — especially averaging, smoothing, and temperature control — are the primary causes of slow or unstable readings.
By implementing the following practices:
- Standardize instrument settings,
- Match optical path length to actual sample tubes,
- Maintain sample clarity and temperature equilibrium,
- Enforce configuration management and operator training,
laboratories can restore fast, accurate, and reproducible measurement performance.
Furthermore, establishing a calibration and documentation system ensures long-term stability and compliance with analytical quality standards.
