Posted on

Why Laurell Spin Coater Shows “Need Vacuum” Even When the Sample is Held Securely – A Complete Troubleshooting Guide

1. Introduction

Spin coaters are critical tools in microfabrication, material science, and semiconductor laboratories. They rely on high-speed rotation to uniformly spread photoresists or other coating materials onto wafers, glass slides, or substrates. One of the most commonly used systems in this category is the Laurell Technologies spin coater series.

A built-in safety interlock system ensures that the sample does not fly off during rotation. This is achieved by using a vacuum chuck, which secures the wafer or substrate via suction. If the machine does not detect a valid vacuum signal, it will refuse to start the spin cycle and display the warning message:
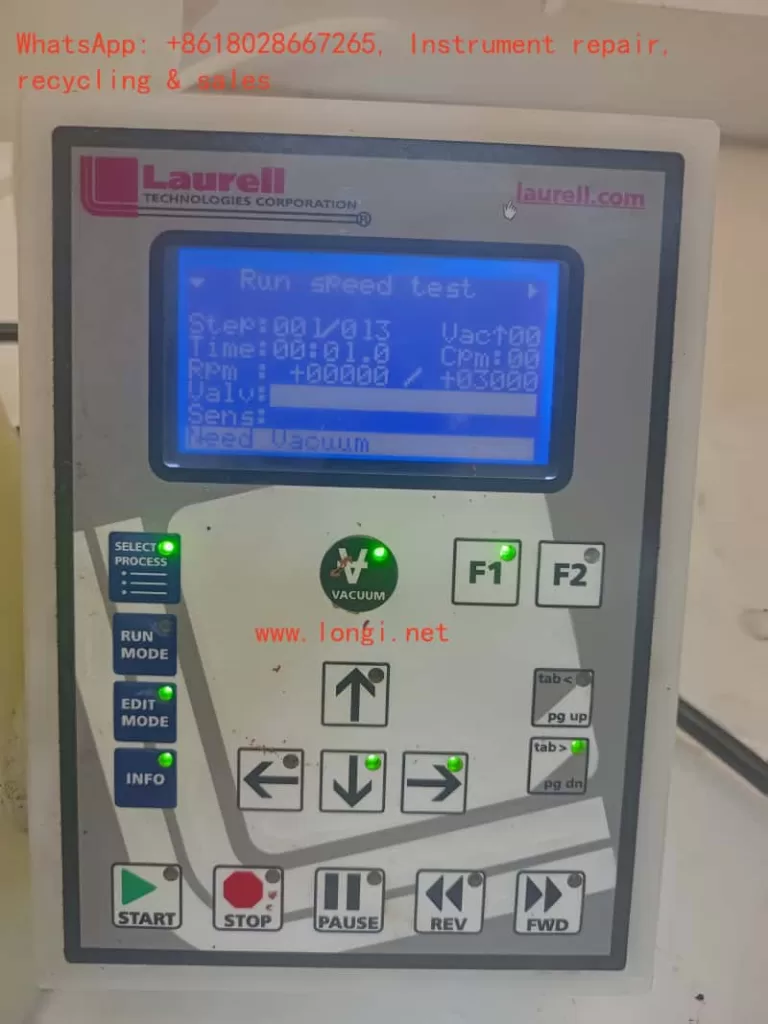
“Need Vacuum”

This safety feature prevents dangerous accidents and sample loss. However, in some situations, operators may encounter a scenario where:

  • The sample is firmly held by the vacuum chuck, indicating that the vacuum suction is working.
  • But the controller display still shows “Need Vacuum”, and the motor will not rotate.

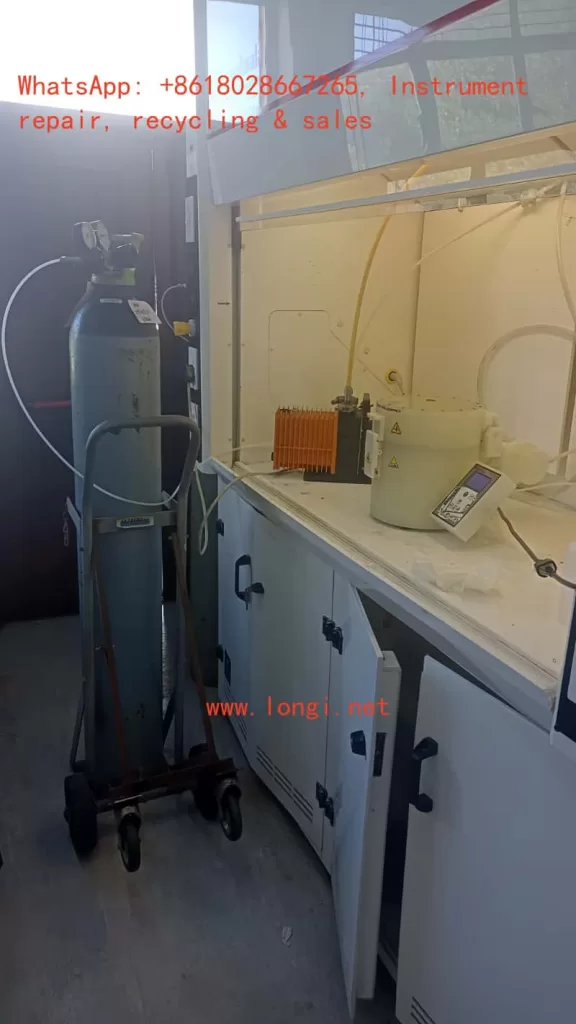
This contradiction is exactly the case observed by the customer in South Africa, as shown in the photos and video evidence provided.

In this article, we will thoroughly analyze the issue, explain why it happens, and provide a structured troubleshooting guide for engineers, technicians, and laboratory users.


2. How the Vacuum Interlock Works in Laurell Spin Coaters

To understand the problem, one must first understand the design of the vacuum interlock system:
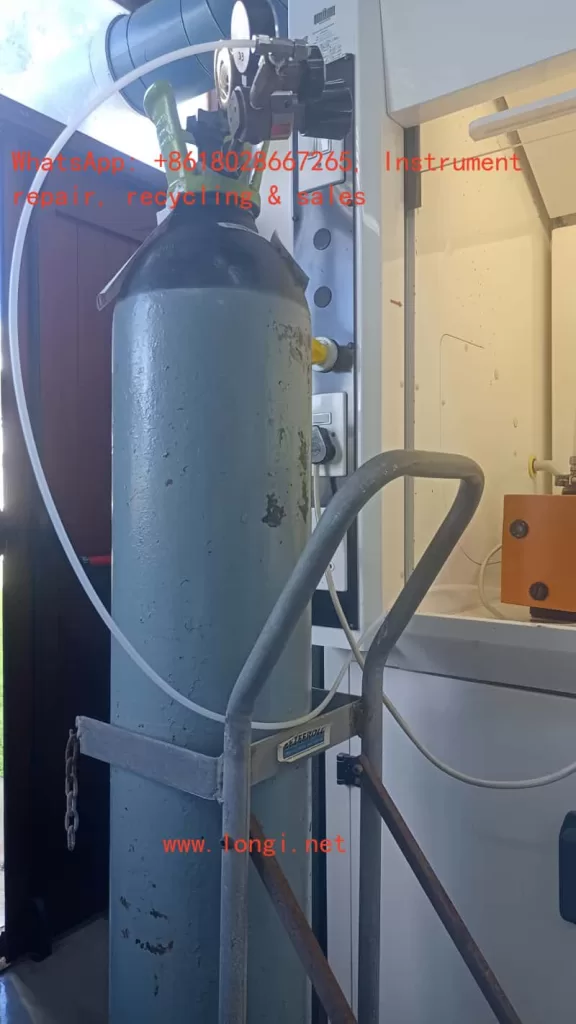
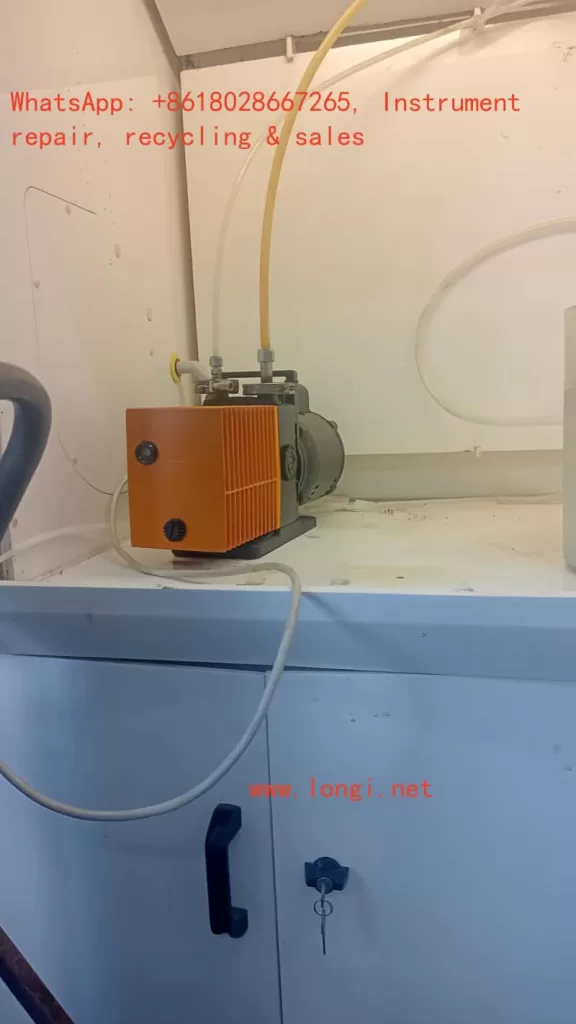
  1. Vacuum Source
    • Usually provided by an external vacuum pump.
    • In some labs, a central vacuum line is available.
    • The pump draws negative pressure through tubing connected to the spin coater chuck.
  2. Vacuum Chuck
    • A flat plate with small holes that holds the sample by suction.
    • When the pump is active, the wafer is tightly fixed to the chuck surface.
  3. Vacuum Sensor or Switch
    • Located inside the spin coater.
    • Detects whether the vacuum level is sufficient for safe operation.
    • Sends a signal (ON/OFF or analog voltage) to the controller board.
  4. Controller Logic
    • If the vacuum sensor indicates “No Vacuum,” the motor remains locked.
    • If vacuum is detected, the program is allowed to start spinning.

Thus, the machine requires both physical vacuum suction AND a valid signal from the sensor.


3. Symptom Observed by the Customer

From the photos and video provided, the following facts were established:

  • The sample (a square substrate) is securely attached to the chuck during vacuum operation.
  • The vacuum pump and tubing system are operational, as suction is clearly holding the substrate.
  • Despite this, the Laurell controller display shows “Need Vacuum” and the spin motor does not activate.
  • The operator is stuck at Step 00 in the spin program, unable to proceed further.

This mismatch between actual vacuum state and controller feedback is the root cause of the complaint.


4. Possible Causes of the Problem

4.1 Vacuum Sensor Malfunction

  • The vacuum sensor inside the coater may have failed.
  • Even though negative pressure exists, the sensor does not detect or report it.
  • Sensors can fail due to aging, contamination, or internal electrical faults.

4.2 Wiring or Connection Issues

  • The electrical signal from the sensor to the main control board may be interrupted.
  • Loose connectors, broken wires, or corrosion can cause signal loss.
  • A perfectly working vacuum will not be recognized if the signal path is broken.

4.3 Blocked or Misrouted Sensor Line

  • In some Laurell models, the sensor has its own dedicated small tubing.
  • If this line is blocked, pinched, or not connected to the correct port, the sensor will not see the vacuum.
  • Meanwhile, the chuck still holds the wafer properly.

4.4 Controller I/O Board Failure

  • The sensor might be functional, but the control board input channel is defective.
  • The vacuum detection signal never registers in the system.

4.5 Incorrect Parameter or Setup Configuration

  • Laurell systems allow configuration of Vacuum Interlock settings.
  • If the interlock is mistakenly disabled or misconfigured, the machine logic can behave unexpectedly.
  • For example, the controller might be waiting for a different signal threshold than what the sensor provides.

5. Evidence from the Video

The customer’s video shows:

  • At the beginning, the wafer is firmly attached to the vacuum chuck.
  • The operator gently touches or shakes it, and it stays in place.
  • This proves that vacuum suction is indeed active.
  • However, the spin coater does not proceed with rotation, confirming that the problem lies in signal recognition, not actual suction.

This video evidence eliminates issues like:

  • Faulty vacuum pump.
  • Leaking tubing.
  • Improper wafer placement.

Therefore, the focus must shift to detection, feedback, and controller logic.


6. Step-by-Step Troubleshooting Guide

Step 1: Confirm Vacuum Pump Operation

  • Ensure the pump is turned on.
  • Measure vacuum level at the pump output with a gauge (should meet Laurell’s specifications).

Step 2: Verify Chuck Suction

  • Place a sample or even a flat piece of glass.
  • If it is firmly held, the vacuum path from pump → tubing → chuck is confirmed.

Step 3: Inspect Sensor Tubing (if applicable)

  • Some models use a separate small tube leading to the vacuum sensor.
  • Make sure it is not disconnected, clogged, or leaking.

Step 4: Check Sensor Signal

  • Disconnect the electrical connector from the sensor.
  • Measure output with a multimeter when vacuum is applied.
  • If the signal does not change, the sensor is defective.

Step 5: Test Wiring Integrity

  • Use continuity testing on the wiring harness from sensor to controller.
  • Repair or replace cables if broken.

Step 6: Bypass/Short Test (For Verification Only)

  • Short the sensor signal input to simulate “vacuum present.”
  • If the machine starts spinning, the controller is fine but the sensor or wiring is faulty.

Step 7: Check Controller Settings

  • Access the system configuration menu.
  • Verify that Vacuum Interlock is enabled and thresholds are correct.
  • If necessary, temporarily disable interlock for diagnostic purposes (not recommended for normal operation).

Step 8: Controller Board Diagnosis

  • If sensor and wiring are confirmed good, the controller input board may be defective.
  • Replacement or repair of the I/O board is required.

7. Practical Recommendations

  • Replace the vacuum sensor if it shows no electrical response under suction.
  • Check and secure wiring connectors to eliminate intermittent signals.
  • Clean the sensor line to remove possible blockages.
  • Review the configuration in the Laurell menu to ensure interlock is properly set.
  • Contact Laurell service if controller hardware is suspected faulty.

8. Why This Problem Matters

This situation highlights an important principle in equipment maintenance:

  • Mechanical performance does not guarantee electrical recognition.
  • Even though the vacuum holds the wafer physically, the safety system relies on an independent electrical or pneumatic feedback mechanism.
  • If the feedback loop is broken, the machine assumes unsafe conditions and refuses to operate.

Such protective interlocks are common in high-speed rotating machinery, where user safety must always be prioritized.


9. Conclusion

The South African customer’s Laurell spin coater issue is a textbook case where vacuum is physically present, but the system still displays “Need Vacuum.”

  • The video clearly shows that the wafer is tightly held, ruling out pump or chuck problems.
  • Therefore, the most probable causes are vacuum sensor failure, wiring disconnection, or controller input malfunction.
  • A systematic troubleshooting procedure should start from confirming sensor response, checking wiring, and reviewing interlock settings, before finally suspecting controller board faults.

Ultimately, the problem is not the vacuum itself, but the failure of the machine to recognize and accept the vacuum signal.

By following the structured troubleshooting flowcharts and step-by-step guide, laboratory staff can isolate the fault, repair it effectively, and restore the spin coater to full working condition.


Posted on

Causes of Poor Repeatability in Bingham Viscosity Measurements of Automotive PVC Sealing Adhesives and Troubleshooting Strategies for Rheometers


Introduction

In the automotive industry, PVC sealing adhesives are widely used for seam sealing, underbody protection, and surface finishing. Their typical formulation includes polyvinyl chloride (PVC), plasticizers such as diisononyl phthalate (DINP), inorganic fillers like nano calcium carbonate, and thixotropic agents such as fumed silica. These materials exhibit strong thixotropy and yield stress behavior, which are critical for application performance: they must flow easily during application but quickly recover structure to maintain thickness and stability afterward.

anton paar mcr 52

Rheological testing, particularly the determination of Bingham parameters (yield stress τ₀ and plastic viscosity ηp), is a key method for evaluating flowability and stability of such adhesives. However, in practice, it is common to encounter the problem that repeated tests on the same PVC adhesive sample yield very different Bingham viscosity values. In some cases, customers suspect that the rheometer itself may be faulty.

This article systematically analyzes the main causes of poor repeatability, including sample-related issues, operator and method-related factors, and potential instrument malfunctions. Based on the Anton Paar MCR 52 rheometer, it also provides a structured diagnostic and troubleshooting framework.


I. Bingham Viscosity and Its Testing Features

1. The Bingham Model

The Bingham plastic model is a classical rheological model used to describe fluids with yield stress: τ=τ0+ηp⋅γ˙\tau = \tau_0 + \eta_p \cdot \dot{\gamma}

where:

  • τ = shear stress
  • τ₀ = yield stress
  • ηp = Bingham (plastic) viscosity
  • γ̇ = shear rate

The model assumes that materials will not flow until shear stress exceeds τ₀, and above this threshold the flow curve is approximately linear. For PVC adhesives, this model is widely applied to describe their application-stage viscosity and yield properties.

2. Testing Considerations

  • Only the linear region of the flow curve should be used for regression.
  • Pre-shear and rest conditions must be standardized to ensure consistent structural history.
  • Strict temperature control and evaporation prevention are required for repeatability.

II. Common Causes of Poor Repeatability in Bingham Viscosity

The variability of results can arise from four categories: sample, operator, method, and instrument.

1. Sample-Related Issues

  • Formulation inhomogeneity: uneven dispersion of fillers or thixotropic agents between batches.
  • Bubbles and inclusions: entrapped air leads to noisy stress responses.
  • Evaporation and skin formation: solvents volatilize during testing, increasing viscosity over time.
  • Thixotropic rebuilding: variations in rest time cause different recovery levels of structure.

2. Operator-Related Issues

  • Loading technique: inconsistent trimming or sample coverage affects shear field.
  • Geometry handling: inaccurate gap, nonzero normal force, or loose clamping.
  • Temperature equilibration: insufficient time before testing.
  • Pre-shear conditions: inconsistent shear strength or rest period.

3. Methodological Issues

  • Regression region: including nonlinear low-shear regions distorts ηp.
  • Mode differences: mixing CSR (controlled shear rate) and CSS (controlled shear stress) methods.
  • Wall slip: smooth plates cause the sample to slip at the surface, lowering viscosity readings and increasing scatter.

4. Instrument-Related Issues

  • Torque transducer drift: unstable baseline, noisy low-shear data.
  • Air-bearing or gas supply issues: unstable rotation, periodic noise.
  • Temperature control errors: set vs. actual sample temperature mismatch, viscosity drifts with time.
  • Normal force sensor faults: incorrect gap and shear field.
  • Mechanical eccentricity: loose or misaligned geometries.
  • Software compensation disabled: compliance/inertia corrections not applied.

III. Challenges Specific to PVC Adhesives

PVC adhesives for automotive applications present several specific difficulties:

  1. Strong thixotropy: rapid breakdown under shear and fast structural recovery on rest, highly sensitive to pre-shear and rest history.
  2. Wall slip tendency: filler- and silica-rich pastes often slip on smooth plates, producing low and inconsistent viscosity readings.
  3. Evaporation and skinning: solvent/plasticizer volatilization leads to viscosity increase during tests.
  4. Wide nonlinear region: low-shear region dominated by rebuilding effects, unsuitable for Bingham regression.

anton paar mcr 52

IV. Recommended SOP for PVC Adhesive Testing

To achieve consistent Bingham viscosity results, the following SOP is recommended:

1. Geometry

  • Prefer vane-in-cup (V-20 + CC27) or serrated parallel plates (PP25/SR) to reduce wall slip.

2. Temperature Control

  • Test at 23.0 ± 0.1 °C or as specified.
  • Allow 8–10 min equilibration after loading.
  • Use solvent trap/evaporation ring; seal edges with petroleum jelly.

3. Sample Loading & Pre-Shear

  • Load slowly, avoid entrapping bubbles, trim consistently.
  • Pre-shear: 50 s⁻¹ × 60 s → rest 180 s under solvent trap.

4. Measurement Program

  • CSR loop: 0.1 → 100 → 0.1 s⁻¹ (logarithmic stepping).
  • Dwell: 20–30 s per point or steady-state criterion.
  • Discard first loop; fit second loop linear region (10–100 s⁻¹).

5. Data Processing

  • Report τ₀ and ηp with R² ≥ 0.98.
  • Document regression range and hysteresis.

6. Quality Control

  • Target repeatability: CV ≤ 5% for ηp (≤8% for highly thixotropic samples).
  • Use standard oils or internal control samples daily.

V. How to Verify If the Instrument Is Faulty

When customers suspect a rheometer malfunction, simple tests with Newtonian fluids can clarify:

  1. Zero-drift check
  • Run empty for 10–15 min; torque baseline should remain stable.
  1. Standard oil repeatability
  • Load the same Newtonian oil three times independently.
  • Target: viscosity CV ≤ 2%, R² ≥ 0.99.
  1. Temperature step test
  • Measure at 23 °C and 25 °C; viscosity should change smoothly and predictably.
  1. Geometry swap
  • Compare results using PP25/SR and CC27; Newtonian viscosity should agree within ±2%.
  1. Air supply check
  • Confirm correct pressure, dryness, and filter condition for the air bearing.

If the standard oil also shows poor repeatability, then instrument malfunction is likely. Probable causes include:

  • Torque transducer failure/drift.
  • Air-bearing instability.
  • Temperature control faults.
  • Normal force or gap detection errors.
  • Disabled compliance/inertia compensation.

VI. Communication Guidelines with Customers

  1. Eliminate sample and method factors first: the thixotropy, volatility, and wall slip of PVC adhesives are usually the dominant causes of poor repeatability.
  2. Verify instrument health with standard oils: if oil results are consistent, the instrument is healthy and SOP must be optimized; if not, escalate to service.
  3. Provide an evidence package: standard oil data, zero-point stability logs, temperature records, air supply parameters, geometry and gap information, and compensation settings.

Conclusion

Automotive PVC sealing adhesives are complex materials with strong thixotropic and yield stress behavior. In rheological testing, poor repeatability of Bingham viscosity can be attributed to sample properties, operator inconsistencies, methodological flaws, or instrument faults.

By applying a standardized SOP—including vane or serrated geometry, strict temperature control, controlled pre-shear and rest times, and regression limited to the linear region—repeatability can be significantly improved.

To determine whether the instrument is at fault, repeatability checks with Newtonian standard oils provide the most objective method. If results remain unstable with standard oils, instrument issues such as torque transducer drift, air-bearing instability, or temperature control errors should be suspected.

Ultimately, distinguishing between sample/method effects and instrument faults is essential for efficient troubleshooting and effective communication with customers.


Posted on

The Role of Micro Bead Filling in Explosion-Proof Displays and Options for Substitution

Introduction

In hazardous environments such as coal mines, petrochemical plants, chemical processing facilities, and oil & gas fields, conventional electronic displays cannot be directly applied. This is because LCD panels and their driver circuits may generate sparks, arcs, or heat during operation, which could ignite surrounding flammable gases or dust. Therefore, specialized explosion-proof displays compliant with ATEX / IECEx standards must be used. These devices feature special designs in their housings, sealing methods, heat dissipation, and internal structures.

During the repair of a customer’s explosion-proof display, the author discovered something unusual: apart from the LCD module and driver board, the interior was filled with a large quantity of uniform, tiny plastic beads—enough to collect half a bowl after disassembly. At first, the purpose of these beads was unclear, and some speculated that they might be desiccants. However, further investigation revealed that these microbeads play a crucial role in the explosion-proof design. This article explores their functional mechanism, possible material types, and alternative options.


I. Basic Requirements of Explosion-Proof Displays

1. Explosion-Proof Standards

According to the IEC 60079 series of international standards, explosion-proof electrical equipment must prevent the following hazards:

  • Arc and spark leakage: Switching elements, relays, or LCD driver ICs may generate sparks.
  • Hot surfaces: LED backlight drivers or power modules may heat up.
  • Internal explosions: If components burn or fail, flames must not propagate outside the enclosure.

Common protection methods include Flameproof (Ex d), Intrinsic Safety (Ex i), Increased Safety (Ex e), and Powder Filling (Ex q)—the method most relevant to this discussion.

2. The Principle of Ex q Powder Filling

Ex q protection involves filling the enclosure with fine particles or powder so that no free air cavities remain inside. Any arcs, sparks, or flames are effectively blocked from propagation. Typical fillers include quartz sand, glass microbeads, or flame-retardant polymer beads.

Advantages include:

  • Friction between particles dissipates energy and prevents flame spread.
  • The filler provides thermal insulation, slowing heat transfer.
  • Properly selected materials are non-flammable and ensure safety.

II. Observations During Repair

Upon disassembly, it was noted that all housing seams were sealed with adhesive. Inside, the cavity was densely packed with white, spherical beads of about 0.5–1 mm diameter, lightweight and smooth.

Initial suspicion that these might be silica gel desiccants was soon dismissed:

  • The sheer volume was far beyond what moisture control would require.
  • Desiccant beads are typically porous and often color-indicating (blue/orange).
  • Their primary purpose is moisture absorption, not shock absorption or flame suppression.

Thus, these were confirmed not to be desiccants but rather specialized filler beads for explosion-proof applications.


III. Likely Material Types

By comparing common industrial fillers, the beads are most likely one of the following:

1. EPS / EPE Foam Beads

  • Appearance: White, lightweight, uniform diameter.
  • Advantages: Excellent energy absorption, cushioning, and vibration damping; inexpensive.
  • Limitations: Low heat resistance unless treated with flame retardants.

2. Hollow Glass Microspheres

  • Appearance: Transparent or white, smooth spherical particles, 100–500 μm typical size.
  • Advantages: High-temperature resistance, non-flammable, chemically stable.
  • Limitations: More expensive, fragile.

3. Expanded Perlite Granules (Glassy Beads)

  • Appearance: Irregular, porous mineral-based particles.
  • Advantages: Fireproof, high-temperature resistant, widely used in construction insulation.
  • Limitations: Dust generation, irregular shapes, not suitable for close contact with electronics.

Based on their smooth spherical shape, uniform size, and dense packing, the filler in this display is more consistent with flame-retardant EPS/EPE beads or hollow glass microspheres, rather than perlite-based construction materials.


IV. Functional Mechanism of Beads in Explosion-Proof Displays

1. Energy Absorption

In the event of arcs, short circuits, or small internal explosions, the beads absorb shock energy through inter-particle friction, preventing flame penetration.

2. Elimination of Cavities

By filling every space inside the enclosure, no free air volume remains, reducing the risk of flammable gases accumulating.

3. Thermal Insulation and Flame Retardancy

The filler layer weakens heat conduction. Even if some circuits generate heat, it is not quickly transferred to the housing. Flame-retardant treated beads will not sustain burning.

4. Shock and Vibration Damping

Explosion-proof displays are often installed in environments subject to mechanical vibration. The filler beads protect LCD panels and circuits by cushioning against long-term vibration.


V. Can “Glassy Perlite Beads” Be Used as a Substitute?

Products such as glassy perlite beads (expanded perlite) are commonly sold for construction insulation. While fireproof, they are not suitable substitutes in this context because:

  • Irregular shapes make them pack poorly, leaving gaps.
  • High dust levels may contaminate electronic boards.
  • Low mechanical resilience means they crumble under vibration and do not cushion effectively.

Thus, glassy perlite beads are not recommended as replacements for the original filler.


VI. Suitable Substitutes and Purchasing Advice

1. Flame-Retardant EPS Beads

  • Recommended size: 1–3 mm diameter.
  • Advantages: Lightweight, easy to fill, cost-effective.
  • Requirement: Must meet certified flame-retardant grades (e.g., UL94 V-0 or B1).

2. Hollow Glass Microspheres

  • Recommended size: 100–500 μm diameter.
  • Advantages: High-temperature resistance, non-flammable, smooth surface.
  • Suitable for higher-spec safety environments.

3. Procurement Channels

  • Chinese e-commerce: Search for “阻燃EPS微珠” or “中空玻璃微珠”
  • International suppliers: Brands such as Storopack and SpexLite offer filler beads with technical documentation.
  • Explosion-proof equipment distributors: Some suppliers provide certified filler material specifically for Ex q applications.

VII. Conclusion

The beads observed inside the explosion-proof display are not desiccants but specialized filler materials that comply with the Ex q powder filling principle (IEC 60079-5). Their functions include absorbing energy, eliminating cavities, insulating against heat, and damping vibration.

Based on observed characteristics, they are most likely flame-retardant EPS/EPE foam beads or hollow glass microspheres, not perlite-based construction fillers. For repairs or replacement, it is critical to choose certified, flame-retardant, low-dust spherical beads, typically 1–3 mm in diameter, to ensure compliance with explosion-proof safety standards.

This choice directly affects not only the reliability of the equipment but also intrinsic safety in hazardous environments. Therefore, service personnel must reference relevant standards and confirm flame-retardant certification when selecting replacement materials.


Posted on

ABB EL3020 (Uras26) CO₂ Analyzer: Calibration Principles, Common Failures, and On-site Troubleshooting

1. Introduction

The ABB EL3020 (equipped with the Uras26 infrared module) is a high-precision, multi-component gas analyzer widely used in chemical, metallurgy, power, and environmental sectors for continuous CO₂, CO, CH₄, and other gas measurements.
To ensure measurement accuracy and long-term stability, Zero Point Calibration and Span Calibration must be performed regularly. However, during field calibration, engineers often encounter “Calibration Rejected,” “Half Span Shift,” or complete lockout after a failed attempt, preventing further calibration and impacting operation.

This article explains the calibration principle, common causes of failure, error phenomena, troubleshooting steps, and recovery methods. It is based on real field cases, providing engineers with actionable, field-ready solutions.


2. Calibration Principles of the EL3020 (Uras26)

2.1 Zero Point Calibration

The purpose of zero point calibration is to eliminate background interference signals from the optical system and sensors when no target gas is present, aligning the measurement curve to zero.

  • Condition: Introduce zero gas without the target component (e.g., high-purity nitrogen or zero air).
  • Requirement: Gas purity must be adequate (CO₂ < 0.1 ppm for a 0–5 ppm range), the sampling path fully flushed, and readings stable.

2.2 Span Calibration

Span calibration adjusts the analyzer’s sensitivity near the full scale so that the measured value matches the standard gas concentration.

  • Condition: Introduce certified calibration gas with a known concentration (e.g., 3 ppm CO₂).
  • Requirement: Gas concentration must be accurate and stable, and match the value configured in the analyzer.

2.3 Calibration Protection Mechanism

To prevent operator errors from causing measurement drift:

  • If the current reading deviates too far from the expected zero/span value, the analyzer will display a “Span Shift” or “Half Span Error” warning.
  • In some firmware versions, a failed calibration triggers an automatic calibration lock, requiring reset/unlock before retrying.

3. Common Calibration Issues and Root Causes

3.1 “Half Span Error” Warning

Causes:

  1. Incorrect calibration gas concentration (zero gas contains CO₂ or span gas concentration mismatch).
  2. Residual sample gas in the line or insufficient flushing time.
  3. Abnormal flow rate (too low/high or unstable).
  4. Analyzer not stabilized (insufficient warm-up or optical drift).

Recommendations:

  • Verify calibration gas concentration and label match.
  • Flush for ≥5–10 minutes before calibration.
  • Adjust flow rate to recommended value (e.g., 60 L/h).
  • Warm up for ≥30 minutes before calibration.

3.2 Zero Calibration Rejection

Causes:

  • Current reading outside acceptable zero range (e.g., <0.1 ppm for a 0–5 ppm range).
  • Calibration lock active after a failed attempt.
  • Menu access restricted (requires service password).

Recommendations:

  1. Confirm zero gas purity (CO₂ < 0.1 ppm).
  2. Extend flushing until reading stabilizes.
  3. Check service menu for Calibration Reset option.
  4. If locked, perform unlock/reset before retrying.

3.3 Lockout After One Failed Calibration

Causes:

  • Firmware protection: Logs the failure and blocks further calibration until cleared.
  • Data integrity protection: Prevents repeated incorrect calibrations from accumulating drift.

Unlock Methods:

  • Menu Reset: Service → Calibration Reset.
  • Power cycle + Zero gas flush.
  • Factory Calibration Restore (use with caution – overwrites all current calibration data).
  • Serial Command Unlock via ABB EL3020 Service Tool (CALRESET command).

4. Field Troubleshooting and Operating Steps

4.1 Pre-Calibration Checklist

  1. Gas Verification
    • Confirm gas label matches instrument settings.
    • Use ≥99.999% high-purity nitrogen or equivalent zero gas.
  2. Flow and Gas Path
    • Check flowmeter reading matches recommended spec.
    • Inspect for leaks and verify valve positions.
  3. Warm-up and Stability
    • Warm up for 30–60 minutes.
    • Flush for 5–10 minutes after switching gases.

4.2 Calibration Execution

  1. Press the wrench icon on the right-hand side of the display to enter Maintenance Menu.
  2. Select Manual Calibration.
  3. Choose Zero Point or Span depending on the operation.
  4. Wait for the reading to stabilize before pressing OK.
  5. Verify reading changes after calibration completes.

4.3 After Calibration Failure

  1. Verify gas source → Flush → Retry.
  2. If still failing → Service Menu → Calibration Reset.
  3. If no reset option → Power cycle with zero gas flushing.
  4. If lock persists → Use service software via serial port to send CALRESET.

5. Case Study: CO₂ Zero Point Calibration Failure

Scenario:

  • Instrument: ABB EL3020 (0–5 ppm CO₂ range).
  • Zero gas: 99.999% high-purity nitrogen.
  • Flow rate: 60 L/h.
  • Issue: Zero point calibration triggers “Half Span Error,” lockout after failure.

Investigation:

  1. Gas purity verified.
  2. Found flushing time was only 2 minutes – insufficient for stability.
  3. Extended flushing to 10 minutes → Reading dropped from 0.35 ppm to 0.05 ppm.
  4. Performed Calibration Reset → Zero point calibration succeeded.

Takeaway:

  • Insufficient flushing time is a common cause.
  • First step after failure: reset/unlock before retry.

6. Button & Icon Functions

  • Left Icon (Envelope/File)
    Data logging and viewing functions. Opens historical records and calibration logs.
  • Right Icon (Wrench)
    Maintenance and calibration access: zero point, span calibration, gas path test, sensor status.

7. Preventive Maintenance Tips

  1. Regularly verify calibration gas purity to avoid contamination.
  2. Flush sampling lines thoroughly before calibration.
  3. Perform zero and span calibration according to manufacturer’s recommended cycle.
  4. Train operators to follow correct calibration procedures to minimize errors.

8. Conclusion

The ABB EL3020 (Uras26) offers stable, reliable high-precision gas analysis when paired with proper gas path management and calibration. Understanding the calibration principle, protection mechanism, and common failure modes enables operators to troubleshoot effectively and reduce downtime.
When calibration fails or lockout occurs, follow the outlined troubleshooting steps—starting from gas source and flow checks to warm-up, flushing, and finally reset/unlock procedures—to quickly restore normal operation.


Posted on

Maintenance Analysis Report on YT‑3300 Smart Positioner Showing “TEST / FULL OUT 7535” Status

I. Overview and Equipment Background

This report addresses the status display of the Rotork YTC YT-3300 RDn 5201S smart valve positioner. The front panel shows the following:

TEST  
FULL OUT  
7535

The YT-3300 series smart positioner is produced by YTC (Young Tech Co., Ltd.), often labeled under the Rotork brand. It is designed for precise valve actuator control using a 4–20 mA input signal. The unit supports automatic calibration, self-diagnostics, manual testing, and performance optimization.


TEST FULL OUT

II. Interpretation of Display Information

1. TEST Mode

The “TEST” message indicates the unit is currently in self-test or calibration mode. This occurs typically during initial power-up, after parameter reset, or when manually triggered.

2. FULL OUT

“FULL OUT” means the actuator has moved to the end of its travel range—either fully open or fully closed—depending on the configured logic.

3. 7535

The number “7535” is not an error code. It usually represents the raw feedback signal from the internal position sensor, such as a potentiometer or encoder, scaled between 0–9999. This value gives the current travel position.


III. Possible Root Causes

The following table summarizes possible causes for this status:

No.Possible CauseDescription
1Power-on self-testAfter powering up or parameter loss, the device automatically initiates self-calibration.
2Manual test triggeredThe test mode may have been manually entered via front-panel buttons.
3Feedback sensor issueA stuck or damaged position sensor can cause the value (7535) to freeze or become invalid.
4Air pressure problemInsufficient or unstable air pressure may prevent the actuator from completing movement.
5Mainboard faultMalfunction of internal controller or microprocessor may lock the unit in test mode.

YT-3300 RDn 5201S

IV. Recommended Inspection and Repair Steps

1. Safety and Initial Checks

  • Disconnect the actuator from live control and ensure safe access.
  • Ensure that air pressure is fully vented to prevent unintended valve motion.
  • Confirm the unit is grounded properly (ground resistance <100 ohms).

2. Check Air Supply

  • Verify pressure gauges show clean, dry air within 0.14–0.7 MPa (1.4–7 bar).
  • Check for blocked air tubing or clogged filters.

3. Exit TEST Mode

  • Press the ESC button repeatedly to try returning to the RUN display.
  • If that fails, power cycle the unit and enter Auto Calibration mode via the front panel.

4. Execute Auto Calibration

  • Set the A/M switch to AUTO.
  • Use the keypad to navigate to “AUTO CAL” or “AUTO2 CAL” and execute.
  • The actuator will automatically stroke to both ends and calibrate zero and full travel points.
  • After successful calibration, the display should return to RUN mode.

5. Verify Position Feedback

If the value “7535” remains static or fails to reflect position changes:

  • Open the lower cover and check wiring to the potentiometer (typically yellow, white, blue wires).
  • Measure the feedback voltage (should range from ~0.5 to 4.5V DC).
  • If no variation is detected with actuator movement, the potentiometer or sensor board may need replacement.

6. Diagnostics and Alarm Monitoring

  • Enter the DIAGNOSTIC menu to check for alarm codes or travel deviation alerts.
  • If high or low limit alarms (e.g., HH ALRM or LL ALRM) are detected, reset as per standard procedures.

7. Functional Test and Tuning

  • After restoring to RUN mode, input varying mA signals and observe feedback value (PV) changes accordingly.
  • If actuator motion is slow or unstable, adjust Dead-Zone, Gain, or Filter settings to fine-tune performance.
  • Conduct partial stroke tests (PST) if available to verify control reliability.

TEST FULL OUT

V. Evaluation and Conclusion

Depending on the inspection and action taken, the following scenarios are possible:

  • If Auto Calibration completes successfully and feedback changes smoothly: No hardware failure is present. The unit was simply in test mode after reset.
  • If TEST mode persists and feedback value remains frozen: The position feedback sensor or its circuit is likely faulty and needs replacement.
  • If actuator fails to move despite calibration attempts: Check for blocked pneumatic valves, damaged tubing, or insufficient pressure.
  • If diagnostic menu shows active alarms: Follow alarm-specific reset instructions.

VI. Summary and Recommendations

  1. Preliminary Conclusion: The current “TEST / FULL OUT 7535” status likely indicates a post-reset auto-test, not a malfunction. However, persistent status or failed calibration points to feedback or hardware problems.
  2. Recommended Actions:
    • First attempt to complete auto calibration;
    • Check wiring, feedback sensor, and air supply;
    • Monitor diagnostic menu for error indicators;
    • Replace faulty components if auto-calibration cannot be completed.
  3. Follow-up Advice:
    • Acquire the official user manual for this specific model;
    • Record all air pressures, input/output values, alarms, and parameter settings during troubleshooting for future analysis;
    • If manual steps do not resolve the issue, contact the manufacturer or authorized support for further diagnostics or part replacement.

Posted on

High-Precision Spin Coater Design: For Nanometer-Scale PLGA Film Deposition on Top of Micropillar Arrays in PDMS Chips

I. Background and Application Needs

In the fields of cell engineering, biomaterials, and drug delivery systems, high-throughput microstructured chip platforms are becoming a key research tool. Especially platforms combining PDMS micropillar array chips with controlled biodegradable thin films (e.g., PLGA) are widely used in:

  1. Single-cell drug delivery and sensitivity evaluation;
  2. Cell-material interface interaction studies (adhesion, migration, differentiation);
  3. Multi-factor high-throughput screening and biomimetic microenvironment construction;
  4. Precise control of nanoscale drug release behavior.
spin coater

These applications often require construction of highly uniform, nanometer-scale (100–300 nm) functional film layers specifically on the tops of the pillars, with PLGA (poly(lactic-co-glycolic acid)) as the typical material due to its biocompatibility, biodegradability, and tunable release properties.

However, traditional planar spin coaters with vacuum suction platforms are not suitable for achieving uniform nanoscale coatings on non-planar structures like micropillars, especially when coating only the pillar tops. This presents a demand for a specially designed spin coater to meet these challenges.


II. Spin Coating Principle Overview

Spin coating is a widely used technique in microelectronics, optics, and biomaterials for the rapid formation of uniform thin films. The basic steps include:

  1. Dropping solution onto a substrate;
  2. Rapid rotation creates centrifugal force spreading the liquid evenly;
  3. Simultaneous solvent evaporation leads to film formation within seconds.

Based on simplified Meyerhofer’s model, film thickness “h” relates to:

h ∝ (c * μ) / ω^{1/2}

Where:

  • c = solution concentration;
  • μ = viscosity;
  • ω = rotation speed (rpm);

By adjusting these parameters, film thicknesses from tens to hundreds of nanometers can be reliably achieved. For pillar-top coating, this must be combined with specialized jigs, non-vacuum mechanisms, and multi-stage programmatic rotation control.


III. Functional Requirements for the Spin Coater

To satisfy the target application, the spin coater must meet the following specifications:

1. Microstructure-Compatible Platform

  • Substrate size: 55 mm × 55 mm PDMS chip;
  • Non-vacuum clamping to prevent microstructure collapse;
  • Compatible with curved/non-planar substrates for optimal pillar-top coating.

2. Precision Rotational Control

  • Speed range: 100–10,000 rpm;
  • Speed resolution: 1 rpm;
  • Acceleration range: 100–10,000 rpm/s;
  • Multi-stage programmable control (min. 10 segments);
  • Each stage must set: speed, time, acceleration.

3. Nanofilm Thickness Control Module

  • Automated dispensing system (micro syringe pump):
    • Volume range: 0.1–10 μL;
    • Precision: ±0.01 μL;
  • Optional heating lid (to improve uniform solvent evaporation);
  • Environmental sealing (for use inside glovebox);
  • Gas inlet for nitrogen or controlled airflow.

4. Software and Feedback Control

  • Color LCD touchscreen for programming and monitoring;
  • Real-time display of speed, time, temp, steps;
  • At least 20 custom program sets storage;
  • USB export of spin data logs;
  • External sensor interfaces (e.g., ellipsometer, IR monitor).

High-precision spin coater in use.

IV. Key Innovation Highlights

  1. Non-vacuum clamping system:
    • Avoids PDMS micropillar collapse;
    • PTFE precision slot clamp secures the chip without central blockage.
  2. Pillar-top coating optimization:
    • Multi-stage program: pre-spread (low speed), main spin (high speed), dry-out (moderate speed);
    • Sample protocol: 300 rpm (10s) → 2000 rpm (30s) → 1000 rpm (20s).
  3. Micro-volume drop dispensing system:
    • Controlled center-drop of PLGA solution (2–5 wt% in DCM);
    • Precision stage and optional laser alignment.
  4. Anti-edge-thickening logic:
    • Delay spin or pre-wet stage to prevent solution migrating to chip edges.
  5. Open programming interface:
    • Supports MATLAB / Python SDK;
    • Integration with AI or bioassay automation platforms.

V. Workflow Example

  1. Deposit 0.5–2 μL PLGA solution at the center of PDMS chip;
  2. Spin program:
    • Step 1: 300 rpm for 10 s (pre-spread);
    • Step 2: 2000 rpm for 30 s (uniform coating);
    • Step 3: 1000 rpm for 20 s (controlled dry);
  3. Optional: N2 gas flow to assist solvent removal;
  4. Post-process: film thickness validated by ellipsometry or AFM.

VI. Implementation and Materials

  • Control system: STM32/ESP32 + encoder + BLDC driver;
  • Syringe pump: stepper-driven microinjection with replaceable tips;
  • Heating lid: PTFE shell + PTC film heater + PID temp control;
  • Housing: CNC-machined aluminum frame + acrylic protective cover;
  • Chip holder: laser-cut PTFE tray, supporting 3–4 mm thick PDMS chips.

VII. Market Benchmarks and Outlook

Comparison with existing devices:

  • Ossila Advanced Spin Coater (UK);
  • Laurell WS-650 series (USA);
  • MTI VTC-100PA (China);

Our design focuses on the niche need for micropillar-top nanofilm coating in biological applications, filling a gap in existing commercial equipment that primarily supports flat wafer processing.

Future development roadmap includes:

  • Multi-solution switching module (e.g., for combinatorial screening);
  • Vision-assisted chip alignment and coating path planning;
  • Closed-loop AI control based on film thickness feedback.

VIII. Conclusion

This design addresses the unmet need for high-precision nanocoating on micropillar arrays in PDMS chips—especially relevant in single-cell drug screening and cell-material interface studies. By integrating multi-stage programmable spin control, non-vacuum platform, microfluidic injection, and programmable environment conditioning, this spin coater provides a complete solution for researchers working on nanoscale PLGA film deposition in structured biological interfaces.

It is expected to contribute significantly to advanced biomedical research, high-throughput drug screening, and future bioMEMS development.

Posted on

Comprehensive User Guide for the ParticleTrack™ G400 Laser Particle Characterization System

The ParticleTrack G400 from Mettler‑Toledo is an advanced in situ particle analysis system based on Focused Beam Reflectance Measurement (FBRM®) technology. It enables real-time, direct measurements of particle size and count in full-concentration processes without the need for sampling or dilution. This comprehensive guide explains the working principle, installation, configuration, calibration, operation, maintenance, troubleshooting, and advanced integration options of the ParticleTrack G400 system. It is designed to support users from first-time setup to expert-level deployment in laboratory or process environments.

ParticleTrack G400

1. Working Principle and Key Advantages

The ParticleTrack G400 uses a rotating 780 nm laser beam focused just beyond the sapphire window of the probe. When the beam intersects a particle or droplet, it reflects back to the detector. The duration of this reflection is converted into a “chord length”, allowing the system to calculate particle size distributions in real time.

Key advantages include:

  • True in-situ analysis without the need for sample extraction or dilution.
  • Wide dynamic range measuring particles from 0.5 µm to 2 000 µm.
  • Real-time monitoring, with updates as frequently as every second.
  • Modular probe design, including interchangeable tips for different reactor volumes.
  • Process-resilient construction, handling temperatures from –80 °C to +90 °C and pressures up to 100 bar.

2. System Components and Safety Considerations

ComponentDescriptionKey Specifications
Base UnitHouses laser, motor, signal processing hardware100–240 VAC, USB, 3.25 kg
FBRM ProbeSensor head for immersion in process streamAvailable in 14 mm / 19 mm diameters
Software (iC FBRM)Interface for configuration, data capture, analyticsWindows-based, OPC UA/DCS compatible

Safety Notes:

  • The system is classified as a Class 1 laser product and is safe under normal operating conditions.
  • Only trained personnel should handle system components.
  • The internal laser module and electronics are not user-serviceable.
  • Always ensure the system is properly grounded and installed indoors.

3. Installation and Probe Positioning

Installation steps:

  1. Hardware setup:
    • Connect the AC power supply and USB cable to the computer.
    • Confirm the “Power” and “HW-Status” LEDs are illuminated steadily.
  2. Process positioning:
    • Install the probe in a location where flow is continuous and representative.
    • The sapphire window should face the flow direction at a 30°–60° angle, ideally 45°, to maximize measurement accuracy and reduce buildup.
  3. Optional air purge:
    • In cold or humid environments, connect clean, dry instrument air at 1 barg during start-up, then reduce to 0.15 SLPM to avoid condensation.

4. Software Operation (iC FBRM 4.4)

4.1 Experiment Setup

  • Open iC FBRM.
  • Select New Experiment.
  • Enter a name, define the data storage path, set the total run duration, and choose a measurement interval (e.g., 1s, 5s, 30s).

4.2 Real-Time Monitoring

  • Color-coded status indicator:
    • Green: Running
    • Yellow: Paused
    • Red: Error
    • Blue: Stopped
  • You can annotate events (e.g., reagent addition) directly onto live trends.

4.3 Data Review & Reporting

  • Use Trend Viewer to monitor D50, counts/sec, and chord counts over time.
  • Distribution Viewer displays real-time and historical chord length distributions.
  • Statistics Viewer shows mean, mode, and percentile summaries.
  • Export data to Word, Excel, PDF, or CSV for documentation or analysis.

5. Calibration and Validation

TaskFrequencyPurpose
Calibration ValidationEvery 3–6 months or after a fallVerifies scan geometry and optical alignment
Chord Selection ModelBefore each new experimentOptimize detection for fine/coarse particles

Validation procedure:

  • Use the Calibration Validation Wizard in iC FBRM.
  • Mount a standard PVC reference sample in a fixed beaker stand.
  • Run validation and compare results to reference data.
  • Acceptable deviation: less than 5%; if more than 10%, clean or inspect optics.

ParticleTrack G400

6. Maintenance and Cleaning

Routine practices:

  • Window cleaning:
    • Wipe using Kimwipes moistened with distilled water, ethanol, or acetone.
    • For stubborn residue, use a fine (0.3 µm) alumina polishing compound.
  • Air purge maintenance:
    • Maintain steady 0.15 SLPM during operation.
    • Shut off only after cool-down to prevent condensation.
  • Preventive Maintenance (PM):
    • Replace probe tip or rotary bearings every 1–2 years depending on use.
    • Keep software updated to enable PM alerts and tracking.
  • Storage:
    • After use, store the probe upright and dry in a protective case.

7. Troubleshooting

IssuePossible CauseAction
Scan Speed Too LowWorn bearings or incorrect configurationReplace bearings; verify probe type in software
No CountsWindow fouled or probe not immersedClean window; check immersion depth
Signal Intensity Too HighReflective particles causing saturationSwitch to Macro CSM or dilute sample
Data Acquisition ErrorUSB or PC performance issueReconnect cable; adjust interval or upgrade PC
Tach Pulse MissingFaulty motor or encoderContact technical support

Note: The internal electronics are not user-repairable. For serious hardware faults, contact Mettler-Toledo for Return Material Authorization (RMA).

8. Extended Capabilities

  • Dual System Operation:
    • You may connect two G400 units to a single computer for simultaneous monitoring.
    • Configure each instrument separately in the software.
  • OPC UA / Modbus Integration:
    • Allows real-time data output to SCADA or DCS systems.
    • Enables feedback control loops for crystallization and particle formation processes.
  • Data Archiving:
    • Integrate with iC Data Center for secure storage of all measurement records in GMP-compliant formats.

9. Best Practices

  • Pre-warm the probe 30 minutes before use.
  • Choose appropriate measurement intervals:
    • 1–5 s during fast transitions (e.g., seeding),
    • 30–60 s during stable phases to reduce file size.
  • Avoid installing probes parallel to vessel walls or facing baffles.
  • Always validate the system before starting critical experiments.
  • Participate in Mettler-Toledo AutoChem training webinars for advanced topics.

10. Conclusion

The ParticleTrack G400 is a powerful and precise tool for monitoring particle dynamics in real time, directly within your process. By following the installation, calibration, and maintenance recommendations provided in this guide, users can achieve high-quality, reproducible measurements that enhance process understanding, control, and optimization. Whether you’re conducting crystallization research, scaling up emulsions, or controlling flocculation, the G400 provides data you can trust.

Posted on

KV-4C-24V-A-+A1 Weighing Display Controller

1. Product Overview

The KV-4C-24V-A-+A1 weighing display controller, developed by RAYTEI, is a high-precision signal display and control instrument designed for use with strain gauge load cells. It is ideal for monitoring and controlling forces such as tension, compression, weight, and pressure in industrial applications.

This controller features rich I/O capabilities, easy parameter configuration, dual-row LED real-time display, and analog/digital outputs. It integrates seamlessly into systems like packaging machines, injection molding, press machines, and testing equipment.


2. Features and Working Principle

2.1 Key Features

  • High Precision: Accuracy up to ±0.02% FS, suitable for demanding industrial measurements.
  • Dual Display Windows: Simultaneously shows current value and peak/valley/setting value.
  • Multiple Units Supported: Supports unit switching between kg, g, N, and t.
  • Multi-output: Includes 2 relay outputs (OUT1, OUT2), analog output (4–20mA, 0–10V, etc.).
  • RS-485 Communication: Supports Modbus protocol for PLC or HMI communication.
  • User-Friendly Panel: 5-key panel for quick access to settings, calibration, peak/valley, and zeroing.
  • Strong EMC Protection: Industrial-grade electromagnetic compatibility, suitable for harsh environments.

2.2 Working Principle

The controller reads analog microvolt signals from a load cell through a strain bridge input. It performs high-resolution A/D conversion and computes the corresponding force value. The system displays real-time values and outputs control signals (digital or analog) based on user-defined parameters like thresholds, peaks, valleys, or calibration settings.


3. Front Panel and Basic Operation

3.1 Indicator Overview

  • IN1: Input signal indicator (e.g., signal from load cell detected)
  • OUT1 / OUT2: Relay output indicators
  • Status LEDs:
    • Zero – Zeroing active
    • Mot – Motion state
    • Peak / Valley – Peak and valley tracking indicators

3.2 Key Functions

ButtonFunction Description
SWITCHSwitch between display modes or menu pages
ZEROTare (zero the current load)
OFTENCommon function key (save, view peaks, etc.)
SET/CALIEnter setup or calibration mode

4. Operating Instructions

4.1 Basic Startup Procedure

  1. Power On → Device performs self-check and version display.
  2. Connect Load Cell → Wire sensor input to IN1, VCC, and GND terminals.
  3. Tare the Scale → Ensure no load is applied, press and hold ZERO to reset to zero.
  4. Set Capacity → Enter SET/CALI to configure rated capacity and calibration points.
  5. Set Thresholds → Define upper/lower limits for OUT1/OUT2 triggers.
  6. Output Test → Apply force/load to verify relay activation or analog output change.
  7. Save Settings → Press and hold OFTEN to store changes.

5. Calibration Methods

5.1 Quick Calibration (CAL1)

Used for simple field calibration:

  1. Remove load → Display reads 0.
  2. Press SET/CALI to enter CAL1.
  3. Confirm zero load point.
  4. Apply full load → Enter expected value.
  5. Confirm and exit.

5.2 Multi-Point Calibration (CAL3)

For non-linear sensors or high-accuracy demand:

  • Supports up to 7 calibration points.
  • Sequentially apply known loads and enter each value.

5.3 Analog Output Calibration (CAL4)

To match analog signal range (4–20mA / 0–10V) with actual force range:

  • Requires digital multimeter to monitor output.
  • Use CAL4 to adjust span and offset precisely.

6. Parameter Settings Overview

Use SWITCH to navigate between function pages (F1 to F9). Below are key groups:

GroupDescription
F1Sampling, filter, unit selection
F2Peak/valley hold settings
F3Upper/lower limit for relay outputs
F4–F6Analog output scaling and mode
F7RS-485 communication settings
F9Password protection, parameter lock

Reminder: Always press OFTEN to save settings before exiting.


7. Maintenance Guidelines

7.1 Regular Calibration

  • Calibrate every 6–12 months for optimal accuracy.
  • Recalibrate if load cell or mounting configuration changes.
  • If analog output drifts, recalibrate using CAL4.

7.2 Cleaning and Handling

  • Clean panel surface with a dry soft cloth. Avoid solvents.
  • Prevent moisture from entering connector ports.
  • Periodically inspect terminal screws and wire condition.

7.3 Common Fault Diagnosis

Error CodeDescription
Err01Upper limit exceeded
Err02Lower limit exceeded
Err03No sensor signal
Err06RS-485 communication failed
Err09Power supply fault

In case of errors, verify power, sensor wiring, configuration, and hardware status.


8. Technical Specifications

SpecificationValue
Power Supply24VDC
Power Consumption≤3W
Accuracy±0.02%FS
Input TypeStrain gauge (±20mV)
OutputRelay × 2, Analog, RS-485
Panel Size107×44mm (cutout 92×44mm)
Mounting TypePanel embedded
Operating Temp-10℃ to +50℃

9. Summary

The KV-4C-24V-A-+A1 weighing controller is a robust, compact, and user-friendly industrial force display solution, featuring excellent accuracy and diverse I/O functionality. It is an ideal choice for automated production lines, force testing systems, press-fit machines, and similar applications.

For detailed Modbus register maps, calibration flowcharts, and electrical schematics, please refer to the official product manual provided by RAYTEI Load Cell Co., Ltd or consult their technical support team.


Posted on

SEW MOVIMOT MM D Series “ERROR 07” Fault Analysis and Solution

1. Meaning of ERROR 07 Fault Code

When the SEW-EURODRIVE MOVIMOT MM D series servo drive displays “ERROR 07,” it indicates “DC link voltage too high.” This fault typically occurs when the DC link voltage exceeds its rated range. According to the manual, the appearance of ERROR 07 can be caused by several factors, including short ramp times, faulty connections between the braking resistor and brake coil, incorrect internal resistance of the brake coil or braking resistor, thermal overload of the braking resistor, and invalid input voltage.

ERROR 7

1.1 Ramp Time Too Short

If the ramp time is set too short, the voltage in the DC link can rise too quickly, triggering the ERROR 07 fault. The ramp time controls the speed at which the drive accelerates. If the ramp time is too short, it can cause excessive current and voltage variations, leading to this fault.

1.2 Faulty Connection Between Brake Coil and Braking Resistor

The braking resistor and brake coil are crucial for controlling the DC link voltage during braking. If there is a poor connection between the brake coil and braking resistor, energy from braking cannot be absorbed effectively, causing the DC link voltage to rise too high and triggering ERROR 07.

1.3 Incorrect Internal Resistance of Brake Coil/Braking Resistor

The internal resistance of the brake coil or braking resistor must be within specific limits to effectively control braking energy. If the resistance deviates from the required value, the braking system will not function properly, and the DC link voltage may increase, causing ERROR 07.

1.4 Thermal Overload of the Braking Resistor

If the braking resistor is undersized or overloaded, it can overheat, leading to excessive DC link voltage. In such cases, the braking resistor must be properly sized to withstand the required braking torque and power without overheating.

1.5 Invalid Voltage Range of Supply Input Voltage

The input voltage to the drive must remain within its specified range. If the input voltage exceeds this range, it can lead to an excessively high DC link voltage. It is essential to verify that the supply voltage is within the permissible range as specified by the drive.

2. Solutions

Depending on the root cause of the ERROR 07 fault, here are the detailed diagnostic steps and solutions:

2.1 Extend the Ramp Time

If the ramp time is too short, you can extend it to allow the voltage to rise more gradually. Increasing the ramp time helps prevent the voltage from increasing too quickly, which could trigger the fault.

Steps:

  • Enter the drive’s configuration menu.
  • Find the ramp time parameter (typically labeled as “Ramp Time”).
  • Increase the ramp time to a value that allows the voltage to rise at a safe rate.
  • Save the settings and restart the drive to check if the fault is resolved.

2.2 Check the Connection Between the Brake Coil and Braking Resistor

If the connection between the braking resistor and brake coil is faulty, check all connection points to ensure they are secure and not loose or disconnected. If there is a problem, repair or replace the connection.

Steps:

  • Turn off the drive and disconnect the power.
  • Inspect the connections between the brake coil and braking resistor for any loose or broken connections.
  • Reconnect any faulty connections to ensure they are secure.
  • Power on the drive and test if the fault is cleared.

2.3 Check and Adjust the Internal Resistance of the Brake Coil/Braking Resistor

The internal resistance of the brake coil and braking resistor should match the required specifications. Use a multimeter to measure the resistance and compare it with the specifications in the drive’s technical manual.

Steps:

  • Use a multimeter to measure the resistance of the brake coil or braking resistor.
  • Compare the measured resistance with the recommended value in the technical data section of the manual.
  • If the resistance is incorrect, replace the brake coil or braking resistor with a new one that meets the specifications.

2.4 Properly Size the Braking Resistor

If the braking resistor is overloaded or improperly sized, it can cause thermal overload and lead to ERROR 07. The braking resistor should be able to absorb the energy produced during braking without overheating. Replace the braking resistor with one of the correct size.

Steps:

  • Calculate the required power and torque for the braking resistor based on the drive’s load.
  • Choose a braking resistor with sufficient power rating to handle the braking energy without overheating.
  • Install the appropriately sized braking resistor and test the drive to confirm the fault is resolved.

2.5 Check the Input Voltage

If the input voltage exceeds the rated range of the drive, it may cause an excessive DC link voltage. Use a multimeter to check that the supply voltage is within the allowable range. If the voltage is too high, consider adjusting the power supply or replacing it with one that provides the correct voltage.

Steps:

  • Use a multimeter to measure the input voltage to the drive.
  • Ensure the voltage is within the rated range specified for the drive (typically 380V to 500V AC).
  • If the input voltage is too high, check the power supply and adjust or replace it as necessary.

MM07D-503

3. Preventive Measures to Avoid ERROR 07

To prevent ERROR 07 from recurring, the following measures can be taken:

3.1 Regularly Check and Maintain the Braking System

Regularly inspect the braking resistor and brake coil for proper connections and resistance values. Ensure that they meet the required specifications to avoid issues with braking performance.

3.2 Optimize Cooling and Ventilation

Ensure the drive is installed in a well-ventilated area to prevent overheating. Regularly clean the drive’s cooling fins and ensure there are no obstructions blocking airflow. Keeping the drive cool will help avoid thermal overload issues.

3.3 Properly Size the Braking Resistor

Always select the correct size of braking resistor based on the load requirements. Ensure the braking resistor can handle the required braking torque and power without overheating.

3.4 Monitor Input Voltage Stability

Monitor the input voltage to ensure it remains within the permissible range. Using a stable power supply that provides consistent voltage within the rated range will help prevent issues with the DC link voltage.


4. Conclusion

The SEW MOVIMOT MM D series servo drive is an essential component in modern automation systems. The ERROR 07 fault, which occurs due to high DC link voltage, can be caused by several factors such as short ramp times, faulty braking system connections, incorrect internal resistance, thermal overload of the braking resistor, or invalid input voltage. By following the diagnostic steps and solutions outlined above, you can effectively address and resolve this issue. Regular maintenance, proper configuration, and careful monitoring of the drive’s operation will ensure long-term reliability and optimal performance.


Posted on

Working Principle and Application Guide of YT-3300 Smart Valve Positioner

The YT-3300 series from Rotork YTC is a high-performance electro-pneumatic smart valve positioner widely applied in industries such as petrochemical, power, pharmaceuticals, and process automation. It receives a 4-20 mA analog current signal from PLC or DCS, processes it through a built-in PID controller, and converts it into a pneumatic signal to precisely drive valve actuators. The unit also supports HART communication and optional feedback output (4-20 mA or digital) for closed-loop control.

This article explains its operating principle, core functions, product features, selection criteria, and usage guidelines in detail.

YT-3300

1. Working Principle

The YT-3300 receives a 4-20 mA signal (HART optional) representing the desired valve position. An internal 12-bit ADC samples the current and compares it to the actual valve position measured by an integrated travel sensor (either a magnetic resistance sensor or potentiometer). The PID controller calculates the necessary correction.

The output is then handled by an internal I/P (current-to-pressure) converter using a nozzle-flapper mechanism and miniature solenoid valves. The result is two precisely controlled pneumatic outputs (OUT1 / OUT2), used to actuate single- or double-acting pneumatic actuators.

The travel sensor’s reading can also be converted to a 4-20 mA signal or a digital communication protocol (e.g., HART, FF, PA) for remote monitoring.


2. Block Diagram (Closed-loop control)

      4-20 mA Input ─┐
                     ▼
  +------------------------------+
  | PID Controller + PWM Driver |
  +------------------------------+
           │            ▲
           ▼            │
  Miniature I/P Valve   │ Travel Sensor
           │            │ (NCS / Potentiometer)
           ▼            │
     OUT1 / OUT2 Pneumatic Output
           │
           ▼
  Pneumatic Actuator (Single/Double)

3. Key Functions

  • Digital PID Control: High-precision positioning within ±0.5% F.S.
  • Auto Calibration: AUTO1 / AUTO2 scan modes for fast commissioning.
  • Split Range Support: 4–12 mA / 12–20 mA assignment.
  • Feedback Options: 4-20 mA feedback (PTM module), mechanical limit switch (LSi), HART/FF/PA digital output.
  • Self-Diagnosis: Error codes such as OVER CUR, RNG ERR, or C ERR displayed on LCD screen.
  • Manual/Auto Switch: Supports bypass operations during maintenance.

4. Product Features

  • Integrated PID + I/P + feedback + diagnostics in one unit.
  • Compatible with both linear and rotary actuators.
  • IP66/NEMA 4X enclosure with explosion-proof or intrinsically safe options.
  • Supports SIL2/3 safety systems.
  • Maintenance-free NCS sensor and remote sensor options for high-temp or vibration zones.

5. Model Selection Guide

Code PositionOptionDescription
1L / RLinear or Rotary Actuator
2S / DSingle or Double Acting
3N / i / A / ENo Explosion / Intrinsically Safe
40 / 2 / F / PNone / HART / FF / PA Communication
51 / 2 / …PTM (Feedback) / LSi (Limit Switch)

Examples:

  • YT-3300RDN1101S: Rotary, double acting, no feedback, no HART.
  • YT-3300LSi-1201S: Linear, single acting, with 4-20 mA feedback + limit switch.

YT-3300 Wiring Block Diagram

6. Installation & Usage

Mechanical:

  • Ensure linkage lever aligns perpendicular at 50% stroke.
  • Use Namur bracket for rotary actuator mounting.

Pneumatics:

  • Use clean, dry air (0.14–0.7 MPa); OUT1 for single-acting, both OUT1/OUT2 for double-acting.

Electrical:

  • IN+ to signal source; IN– to common.
  • PTM feedback must use a separate loop.

Calibration:

  • Hold [MODE] to enter AUTO1.
  • Recalibrate using AUTO2 if positioning errors > 5%.
  • Adjust PID or Deadzone if valve hunts or is sluggish.

7. Common Faults

CodeDescriptionFix
OVER CURInput > 24 mACheck wiring, short circuit
RNG ERRStroke out of rangeRecalibrate or adjust lever
C ERRControl deviation too bigCheck air supply, valve jam

8. Application Scenarios

  • Control valves in chemical reactors
  • LNG valve control under sub-zero conditions
  • SIL-rated ESD valve systems
  • Remote installations requiring non-contact sensors

9. Conclusion

The YT-3300 series combines intelligent PID control, precise I/P conversion, diagnostics, and multiple feedback options into one robust, compact unit. Its flexibility in communication (analog or digital), safety compliance, and rugged design make it a superior choice for modern valve automation.