Posted on

Hach Amtax SC Ammonia Nitrogen Analyzer User Guide

I. Instrument Principle and Features

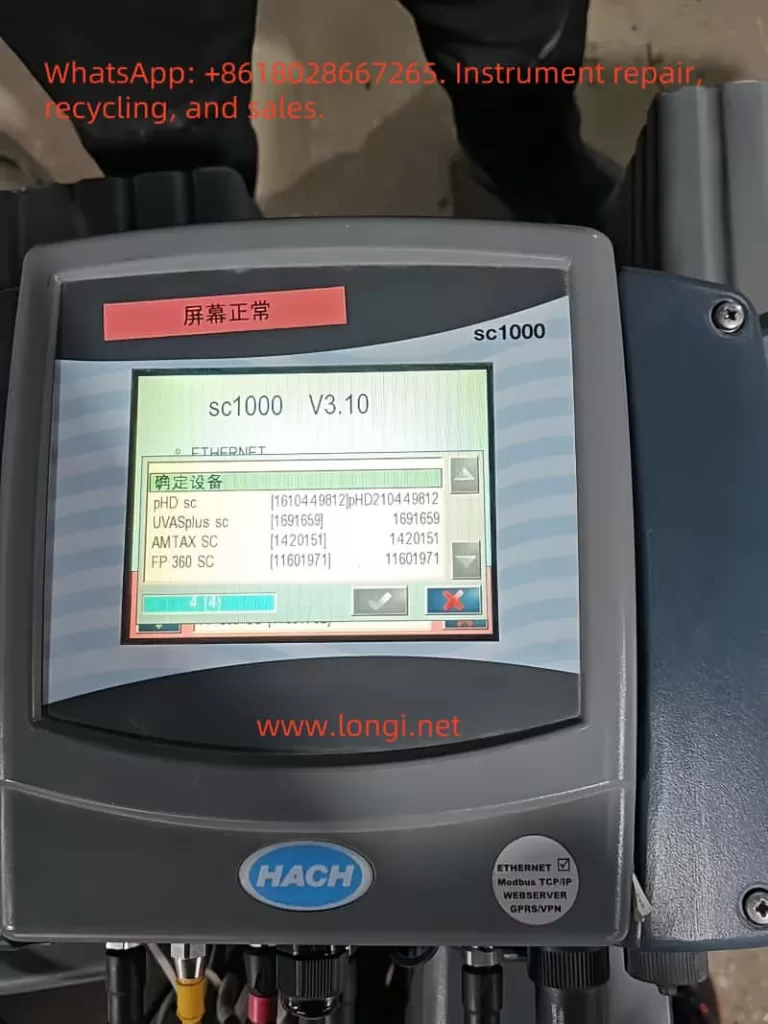
The Hach Amtax SC Ammonia Nitrogen Analyzer is an online analytical device specifically designed for continuous monitoring of ammonium ion concentration in water bodies. It is widely used in wastewater treatment plants, waterworks, surface water monitoring, and industrial process control. Its core measurement principle is the Gas Sensitive Electrode (GSE) method, where a selective electrode reacts with ammonium ions in the sample, and the concentration value is ultimately output in the form of NH₄–N on the controller (sc1000).

Key Technical Features:

  • Wide Measurement Range: Covers three intervals: 0.05–20 mg/L, 1–100 mg/L, and 10–1000 mg/L, allowing flexible application in both low-concentration surface water and high-concentration wastewater scenarios.
  • Fast Response: 90% response time of less than 5 minutes, suitable for real-time monitoring of dynamic water quality.
  • High Precision and Reproducibility: Measurement error is less than ±3% or ±0.05 mg/L (for low ranges), ensuring reliable data.
  • Automation Capabilities: Features automatic calibration, automatic cleaning, and diagnostic functions, significantly reducing manual intervention.
  • Robust Design: Enclosure with an IP55 protection rating and made of UV-resistant ASA/PC material, suitable for harsh outdoor environments.
  • Modular Expandability: Enables data transmission and remote monitoring through the sc1000 controller, supporting single-channel or dual-channel modes.
    Thus, the Amtax SC combines high precision, low maintenance, and strong adaptability, making it a mainstream choice in the field of ammonia nitrogen online monitoring.

II. Installation and Calibration

1. Mechanical Installation

  • Mounting Options: Supports wall mounting, rail mounting, or vertical installation, with wall mounting being the most common. Choose a sturdy, load-bearing wall and ensure smooth routing of surrounding pipes and cables.
  • Weight and Load Requirements: The instrument weighs approximately 31 kg, and the bracket must support a load of ≥160 kg.
  • Installation Environment: Avoid strong vibrations, strong magnetic fields, and direct sunlight. Maintain an ambient temperature range of –20 to 45°C.

2. Electrical Installation

  • Must be performed by qualified personnel to ensure proper grounding and the installation of a residual current device (30 mA RCD).
  • Power is supplied by the sc1000 controller, with voltages of 115V or 230V. The use of 24V controller models is prohibited.
  • All piping and reagent installations must be completed before powering on.

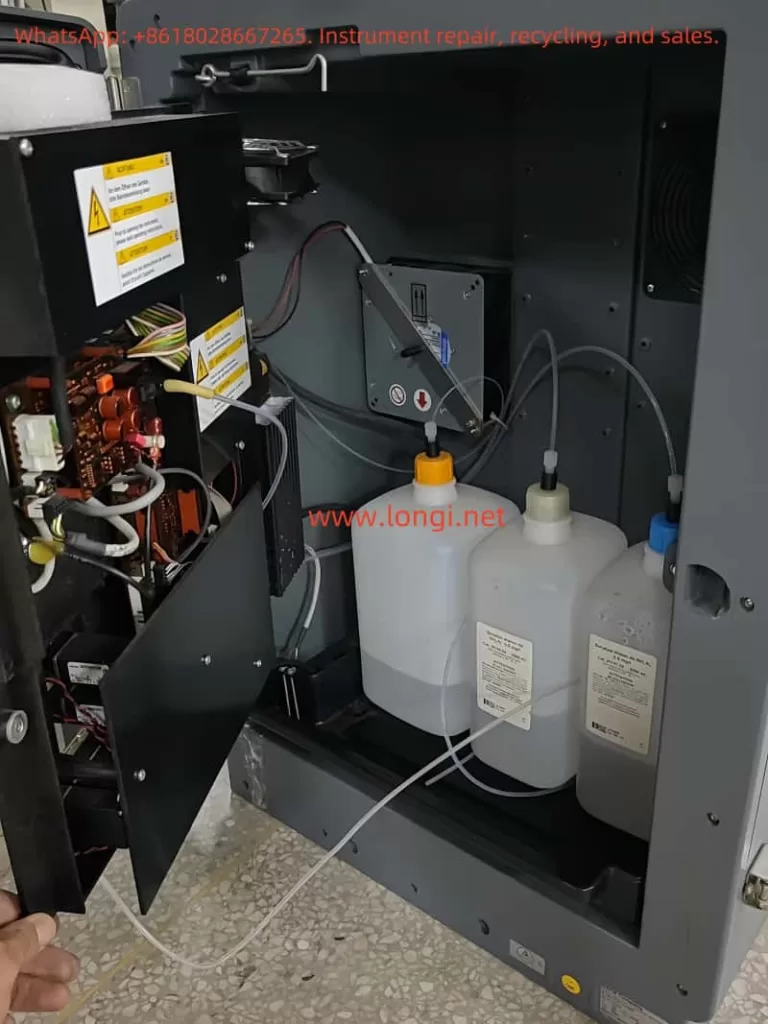
3. Reagent and Electrode Installation

  • Reagent Preparation: Select standard solutions and reagents according to the measurement range. For example, use 1 mg/L and 10 mg/L standard solutions for low ranges, and 50 mg/L and 500 mg/L for high ranges.
  • Electrode Installation: Fill with electrolyte (approximately 11 mL), ensuring no air bubbles remain, and correctly insert the electrode into the electrolysis cell. Replace the membrane cap and electrolyte every 2–3 months.
  • Humidity Sensor: Must be correctly wired to prevent alarms triggered by condensation or liquid leakage.

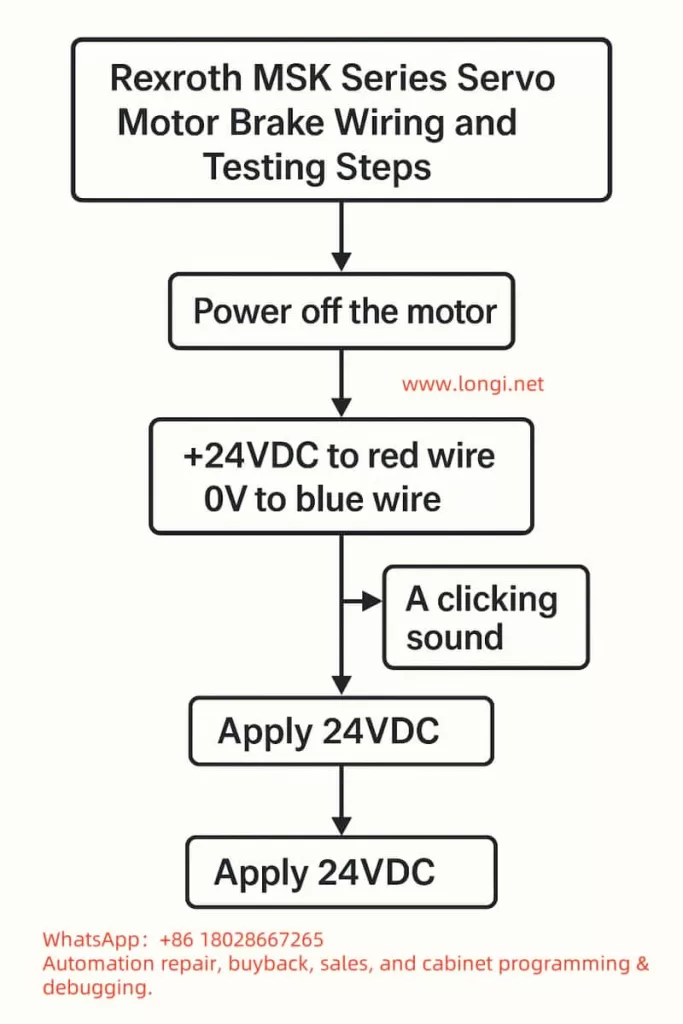
4. Calibration Procedure

  • Calibration modes include automatic calibration and manually triggered calibration.
  • Set the calibration interval (typically once per day or shorter), and the system will automatically switch standard solutions for electrode correction.
  • After calibration, the system records key parameters such as slope, zero point, and standard solution potential to ensure long-term stable operation.

III. Startup and Operation

1. Startup Steps

  • Ensure all installations (piping, electrical, reagents, electrodes) are complete.
  • Connect the analyzer to the sc1000 controller and power on.
  • Initialize the system: Register the Amtax SC and sampling probe in the controller, execute the “Prepump All” function to fill the piping.
  • Allow a warm-up time of approximately 1 hour for the instrument, reagents, and electrodes to reach operating temperature.
  • Enter the sensor setup menu to confirm the measurement range, output units (mg/L or ppm), and measurement interval.

2. Normal Operation

  • LED Indicators: Green indicates normal operation, orange indicates a warning, and red indicates an error.
  • Measurement Interval: Adjustable from 5 to 120 minutes, depending on application requirements.
  • Data Viewing: The sc1000 controller displays real-time values, historical trends, and alarm status, and can upload data to a monitoring system via a bus interface.
  • Cleaning Function: Set up timed automatic cleaning to ensure the photometer, piping, and electrodes remain clean.

IV. Troubleshooting and Maintenance

1. Routine Maintenance

  • Appearance Inspection: Regularly check for damage to pipes and cables, and confirm the absence of leaks or corrosion.
  • Fan Filter: Clean or replace every 6–12 months to ensure proper heat dissipation.
  • Reagents and Electrodes: Replace reagents every 2–3 months, electrode membrane caps and electrolyte every 2–3 months, and electrodes every 1–2 years, as recommended in Table 5.
  • Cleaning Cycle: Depends on water hardness; typically perform automatic cleaning every 1–8 hours.

2. Common Faults and Solutions

  • Low/High Temperature: If the internal temperature falls below 4°C or rises above 57°C, the system enters service mode. Check the heating or cooling fan.
  • Humidity Alarm: Liquid detected in the collection tray; locate and repair the leak source.
  • Abnormal Electrode Slope: Check the membrane and electrolyte, replace the standard solution; if the issue persists, replace the electrode.
  • Weak Photometer Signal: Trigger cleaning; if unresolved, manually clean or contact a service technician.

3. Long-Term Shutdown and Storage

  • Flush the instrument with distilled water in a circulation mode to empty the pipes and reagent bottles.
  • Remove the electrode, clean it, and reinstall it in the electrolysis cell, keeping it moist during storage.
  • Install transport locks and store in a dry, frost-free environment.

4. Professional Repairs

  • Certain components (such as pumps, compressors, and main circuit boards) must be replaced by the manufacturer or authorized service personnel. Typical service lives: pumps 1–2 years, compressors 2 years, all covered under warranty.

V. Conclusion

The Hach Amtax SC Ammonia Nitrogen Analyzer is a stable and highly automated online monitoring device. It features a scientific principle, clear installation requirements, a straightforward operation process, and comprehensive maintenance methods. By strictly adhering to the user manual and this guide, users can ensure the long-term stable operation of the device, providing reliable data support for water quality monitoring and wastewater treatment process control. Correct installation, regular calibration, and maintenance are key to ensuring the instrument’s long-term stable operation. Users should strictly follow the safety specifications in the operation manual, regularly replace reagents and electrodes, and promptly address fault alarms to ensure measurement accuracy and extend the instrument’s service life.

Posted on

Analysis and Solutions for AS180 VFD Communication Fault Er.43: A Case Study in a Three-Pump Water Supply Control System

1. Introduction

Variable Frequency Drives (VFDs) play an increasingly critical role in water supply, HVAC, and industrial automation. Beyond simple motor speed control, VFDs are now deeply integrated into supervisory systems, exchanging data with PLCs and HMIs to enable centralized control and monitoring.

ER.43

However, in real-world operation, communication faults are not uncommon. In particular, when multiple drives are connected in a network, a single issue can sometimes cause a complete loss of communication across all devices, leading to system downtime.

This article examines a case involving three AS180 series VFDs manufactured by STEP Electric in a water supply system. The drives simultaneously reported Er.43 communication fault codes, and the HMI displayed “Communicating…”. By analyzing the fault mechanism and field conditions, we summarize the causes, provide structured troubleshooting steps, and present practical solutions.


as180 4T0011

2. Fault Description

2.1 System Overview

The system consists of three 11 kW AS180 VFDs, each driving a water pump. The VFDs are connected to a PLC and an HMI, forming an intelligent constant-pressure water supply system. Both the run command and frequency reference for the drives are configured to be received via the RS-485 communication interface, using the Modbus-RTU protocol.

2.2 Fault Symptoms

During operation, all three VFDs displayed “Er.43” on their front panels simultaneously. The HMI screen froze with the message “Communicating…”, while the PLC could no longer read current, frequency, or pressure data from the drives. This effectively disabled automatic control of the pumps.

2.3 Manual Interpretation

According to the AS180 manual, fault code 43 is defined as:

  • Communication fault – No communication data received within the specified time window.

This indicates that the VFDs did not detect any polling signal from the master device (PLC/HMI) during the configured timeout period, thus triggering communication loss protection.


iASTAR

3. Root Cause Analysis

The simultaneous occurrence of Er.43 alarms across all three VFDs suggests that the problem was not isolated to an individual drive. Instead, the issue likely originated from the master device or the RS-485 bus. The potential causes can be categorized as follows:

3.1 Master Device Failure

If the PLC or HMI fails to transmit Modbus queries, the drives will all report a communication fault. Possible reasons include:

  • PLC/HMI power supply failure or reset;
  • Serial communication module failure or gateway malfunction (RS-232/485 converter);
  • Software/program crash, leaving the serial port idle.

3.2 RS-485 Physical Layer Issues

The RS-485 bus is inherently sensitive to wiring quality and terminations. Typical physical-layer issues include:

  • Open circuit or miswiring of A/B lines;
  • Reversed polarity (A and B swapped);
  • Multiple or missing termination resistors, causing reflections;
  • Absence of bias resistors, leaving the bus floating;
  • Poor shielding or proximity to high-voltage cables, leading to EMI.

3.3 Parameter Configuration Errors

If the drives and master are not configured with consistent communication parameters, the entire system may fail:

  • Inconsistent baud rate, parity, or stop bits;
  • Duplicate station addresses causing response conflicts;
  • VFD command channel not set to “communication reference.”

3.4 Electromagnetic Interference

In pump rooms or industrial sites, large motors and contactors switch frequently, generating strong electromagnetic noise. If RS-485 wiring runs parallel to power cables without proper shielding, frame loss or CRC errors can occur, leading to timeouts and Er.43 alarms.


The communication fails in the variable frequency water supply system.
1000077

4. Structured Troubleshooting Steps

Based on experience, the following step-by-step troubleshooting process is recommended:

Step 1: Verify Master Device Status

  • Check that PLC/HMI power supplies are stable;
  • Observe communication LED indicators on the PLC serial port or gateway;
  • If necessary, reboot the PLC/HMI and check whether VFD alarms clear;
  • If the master does not transmit at all, the problem lies upstream.

Step 2: Inspect Wiring Integrity

  • Use a multimeter to check continuity of A/B lines;
  • Verify there is no short circuit to ground;
  • Confirm polarity is correct (A to A, B to B);
  • Ensure terminals are properly tightened.

Step 3: Check Communication Parameters

  • Each VFD must have a unique station address (e.g., 1, 2, 3);
  • Baud rate, parity, and stop bits must match the PLC settings;
  • Run and frequency command channels must be set to “communication.”

Step 4: Adjust Timeout Settings

  • Parameter P94.19 (communication timeout) can be temporarily increased from the default 2 seconds to 5–10 seconds to reduce nuisance trips during debugging;
  • Parameter P94.18 (communication loss protection) should remain enabled for system safety.

Step 5: Mitigate Interference

  • Use shielded twisted-pair cable for RS-485 wiring;
  • Connect the shield to ground at one end only;
  • Keep communication wiring at least 30 cm away from power cables;
  • Route communication lines separately whenever possible.

Step 6: Isolate and Test Individually

  • Disconnect two VFDs, leaving only one connected to the master;
  • Verify stable communication with a single device;
  • Reconnect drives one by one to determine if issues are related to wiring topology or specific devices.

5. Case Study Findings

During on-site troubleshooting of this specific case, the following observations were made:

  • All three drives had consistent parameters, with station numbers 1, 2, and 3;
  • RS-485 cabling was intact, but termination resistors were mistakenly installed on all three drives, rather than only at the two ends of the bus;
  • The PLC serial module was intermittently freezing in the noisy environment, causing polling to stop;
  • The HMI simply displayed “Communicating…” while awaiting PLC responses.

Corrective Actions Taken

  1. Removed redundant termination resistors, leaving only one at each end of the RS-485 bus (120 Ω each);
  2. Added bias resistors (1 kΩ pull-up/pull-down) to stabilize the bus idle state;
  3. Improved shielding and grounding of the communication line;
  4. Replaced the PLC serial port module and implemented a watchdog function in software.

Outcome

After implementing these measures, the three drives resumed stable communication. The Er.43 alarms disappeared, and the water supply system returned to normal automatic operation.


6. Lessons Learned and Best Practices

From this case, several important lessons can be drawn:

  1. Simultaneous alarms across all drives usually point to the master device or the RS-485 backbone, rather than the drives themselves.
  2. Follow RS-485 wiring standards strictly. Proper termination, biasing, and shielding are essential for stable communication.
  3. Tune communication protection parameters wisely. Extending the timeout can reduce nuisance trips during debugging, but should be optimized during commissioning.
  4. EMI is a real threat. In pump rooms and industrial settings, interference must be mitigated through careful routing and shielding.
  5. Equip maintenance teams with RS-485 analyzers. These tools can quickly identify whether polling frames are transmitted and whether responses are correct, greatly accelerating troubleshooting.

7. Conclusion

The AS180 VFD is widely applied in water supply and industrial systems, but communication reliability is crucial for its proper operation. The Er.43 communication fault is not typically caused by defects in the VFD itself, but by issues in the RS-485 bus or master station.

By applying a systematic troubleshooting approach—from verifying the master, inspecting wiring, checking parameters, to mitigating interference—engineers can quickly locate and resolve the root cause.

This case study demonstrates that once proper RS-485 wiring practices were restored and the PLC module replaced, the system regained full stability.

For operators and maintenance engineers, this provides both a reference case and a practical methodology to handle similar faults effectively in the future.


Posted on

Troubleshooting Guide for Raycus RFL-P50QB Fiber Laser

1. Introduction

Raycus is one of the leading manufacturers of fiber lasers in China. Its RFL-P series pulsed fiber lasers are widely used in metal marking, welding, cutting, and surface cleaning.

From the nameplate you provided:

  • Model: RFL-P50QB
  • Output Power: 500W
  • Power Supply: 24VDC / Max. 14A
  • Structure: Main laser unit + fiber delivery cable + laser output head

In practice, common problems with this equipment are mainly related to power supply, fiber, cooling system, control signals, and the laser module.


2. Common Fault Symptoms

  1. No laser output at all
    • Fans running, but no laser beam emitted.
  2. Significant power drop
    • Originally 500W, now only 100–200W, insufficient for welding or cutting.
  3. Unstable output
    • Power fluctuates, beam spot unstable.
  4. Alarm indicators or error codes
    • Typical errors: over-temperature, fiber fault, module error.
  5. Output head contamination or damage
    • Lens blackened, spot distorted or doubled.

3. Troubleshooting Process

Step 1: Power Supply Check

  • Measure the input voltage:
    • Rated requirement: 24VDC, max 14A.
    • Use a multimeter; voltage must remain within 23.5–24.5V.
    • If voltage is too low, the laser cannot start or will output weak power.
  • Check power source:
    • Ensure power supply capacity is sufficient.
    • Tighten loose wiring to avoid overheating.

👉 Key point: Low voltage → no output; ripple noise → unstable laser.


Step 2: Control Signal Check

  • Enable signal:
    • The laser requires an enable signal from external control (CNC / PLC / marking card).
    • Verify connectors are not loose or oxidized.
  • PWM / analog signal:
    • Power control is typically via PWM or 0–10V input.
    • Use oscilloscope or multimeter to confirm correct waveforms.

👉 Key point: Missing signals → no laser; noisy signals → unstable output.


Step 3: Cooling System Check

  • Water chiller:
    • RFL-P50QB requires water cooling.
    • Confirm chiller is running, water temperature at 25 ±1 °C.
    • Ensure no bubbles in the pipeline.
  • Fans:
    • From your photo, the fan intake is dusty. Clean it.
    • Weak airflow → overheating alarm.

👉 Key point: Poor cooling → overheating shutdown.


Step 4: Fiber & Output Head Check

  • Fiber condition:
    • Look for bends, dents, or crushing.
    • Severe bending increases loss or causes permanent damage.
  • Output head (QBH collimator):
    • Inspect lens for black marks or burn spots.
    • Clean with isopropyl alcohol (IPA) and lint-free wipes.
  • Coupling condition:
    • Loose coupling → spot distortion.

👉 Key point: Dirty fiber head → reduced power; damaged fiber → no beam.


Step 5: Laser Module Check

  • Drive current:
    • If power is normal but no light, module failure is possible.
    • Requires factory repair.
  • Power measurement:
    • Use a power meter to test actual output.
    • If significantly lower than rated, the module is aging.

👉 Key point: Aged module → weak power; burnt module → no laser.


4. Common Faults & Solutions

SymptomLikely CauseSolution
No outputPower supply fault / no enable signalCheck 24V supply, verify control input
Power dropDirty fiber head / module agingClean fiber, replace module
Unstable beamPower ripple / cooling issueReplace power source, fix chiller
AlarmOverheat / fiber alarmCheck cooling system, fiber endface
Distorted spotBurnt output lensReplace or repair output head

5. Maintenance Guidelines

  1. Keep air vents clean – blow dust with compressed air.
  2. Replace cooling water regularly – use deionized water or dedicated coolant, change every 3 months.
  3. Clean fiber connectors – use 99% IPA alcohol and lint-free swabs.
  4. Avoid frequent plugging/unplugging of fiber heads.
  5. Stable power supply – use a UPS or voltage stabilizer.

6. Conclusion

The Raycus RFL-P50QB fiber laser is a robust industrial device, but it depends on stable power, proper cooling, clean fiber optics, and correct control signals to function.

From your photos and video, the most likely issues are:

  • Dust-clogged fan → overheating
  • Dirty or burnt fiber output head → power drop
  • Cooling water issues → overheat alarms

👉 Recommended sequence:

  1. Check power input.
  2. Verify cooling system.
  3. Clean fan and fiber head.
  4. Measure output with power meter.
  5. If still faulty → send to manufacturer.

Posted on

Return & Refund Policy

Return & Refund Policy

Thank you for shopping with Guangdong Longi Electromechanical Technology Co., Ltd.
We value your trust and want to ensure you are fully satisfied with your purchase.


1. Return Period

  • You may request a return within 14 days from the date of delivery.
  • To be eligible, the product must be unused, in the same condition as you received it, and in the original packaging (if applicable).

2. Non-Returnable Items

  • Customized or specially-ordered products.
  • Products damaged due to improper use or installation by the customer.
  • Items without a valid proof of purchase (invoice or order number).

3. Return Procedure

  • To initiate a return, please contact us at:
    📧 Email: [your email]
    📞 Phone: 17328677649
    📍 Address: Building J14, No.409 Tianyuan Road, Tianhe District, Guangzhou, China
  • Once your request is approved, we will provide instructions for shipping the item back to us.
  • Customers are responsible for return shipping costs unless the product is defective or incorrectly supplied.

4. Refunds

  • After receiving and inspecting the returned item, we will notify you of the approval or rejection of your refund.
  • If approved, your refund will be processed within 7–10 business days, and a credit will automatically be applied to your original payment method.

5. Exchanges

  • We only replace items if they are defective or damaged.
  • If you need an exchange, please contact us within the return period.

6. Contact Us

For any questions regarding returns or refunds, please contact our customer service:

Guangdong Longi Electromechanical Technology Co., Ltd.
📧 Email: 298893811@qq.com
📞 Phone: 17328677649
📍 Address: Building J14, No.409 Tianyuan Road, Tianhe District, Guangzhou, China


Posted on

Vacon NXP Series Inverter F2 Overvoltage Fault Analysis and Solutions

Introduction

In the field of modern industrial automation, variable frequency drives (VFDs) serve as the core equipment for motor control, widely used in systems such as fans, pumps, elevators, and cranes. By adjusting the output frequency and voltage, they achieve precise speed regulation, energy savings, reduced consumption, and soft starting functions. The Vacon NXP series inverters are renowned for their high performance, modular design, and reliable control algorithms, making them particularly suitable for high-power and high-dynamic response applications. However, in actual operation, inverter faults are inevitable, and the F2 overvoltage fault is one of the common issues. This fault typically arises from system energy feedback or power supply fluctuations, causing the DC-link voltage to exceed the safety threshold and trigger protective tripping. If not addressed promptly, it can not only interrupt production but also potentially damage hardware components.

This article, based on the official manuals and technical documents of the Vacon NXP series inverters, combined with practical engineering experience, provides an in-depth analysis of the meaning, causes, diagnostic methods, and solutions for the F2 overvoltage fault. It aims to offer practical guidance for engineers and technicians to optimize system configurations and reduce fault occurrence rates. The discussion starts from basic principles and unfolds step by step, ensuring rigorous logic and clear structure. It should be noted that the Vacon brand has now been integrated into the Danfoss Group, so related support resources can refer to the Danfoss official channels.

F2 Overvoltage

Inverter Basics and Overvoltage Principles

To understand the F2 fault, it is essential to review the basic working principles of the inverter. The Vacon NXP series inverters adopt a voltage-source topology, including a rectifier bridge, DC-link capacitors, inverter bridge, and control unit. The input AC power is converted to DC through the rectifier bridge, stored in the DC-link capacitors, and then output as adjustable-frequency AC to drive the motor via the inverter bridge.

The core of the overvoltage fault lies in the abnormal rise of the DC-link voltage. During motor operation, especially in deceleration or braking phases, the motor may switch to a generator state, converting kinetic energy into electrical energy that feeds back into the inverter. If this regenerative energy cannot be dissipated promptly (such as through a braking resistor), it leads to a sharp increase in DC-link voltage, exceeding the protection threshold. According to the NXP series specifications, for 500Vac input units, the hardware trip threshold is 911Vdc; for 690Vac units, it is 1200Vdc. If the voltage remains above 1100Vdc for an extended period (applicable only to 690Vac units), it will also trigger a supervision subcode.

Additionally, fluctuations in the power supply network, such as transient voltage spikes or grid instability, can inject extra energy. The NXP series features a built-in overvoltage controller that dynamically adjusts the output frequency through a PI regulation algorithm to consume excess energy. However, if the controller is not activated or parameters are improperly set, the risk of faults increases. Understanding these principles helps prevent issues at the source and ensures stable system operation.

Meaning of F2 Overvoltage Fault and Subcode Interpretation

The F2 fault appears on the NXP inverter’s display as “F2 Overvoltage,” often accompanied by subcodes such as S1 (hardware trip), S2 (no power unit data), or S3 (overvoltage supervision, for 690Vac units only). These subcodes provide detailed diagnostic information:

  • S1: Hardware Trip. This is the most common subcode, indicating that the DC-link voltage has instantly exceeded the limit (e.g., 911Vdc for 500Vac units). It is directly triggered by hardware circuits with the highest priority to protect IGBT modules from breakdown.
  • S2: No Power Unit Data. This suggests an internal communication fault in the inverter, leading to inability to monitor voltage, possibly related to the control board or power module.
  • S3: Overvoltage Supervision. Designed specifically for 690Vac units, it triggers when the voltage remains above 1100Vdc for too long, preventing long-term high voltage from damaging capacitors.

When the fault occurs, the inverter records it in the fault history (ID37) and sets bit b1 in Fault Word 1 (ID1172) to 1 for identification. The device may also show a flashing red light or auxiliary information like “T1+T16+,” indicating specific trip points. These meanings are derived from the NXP Advanced Application Manual (APFIFF08), emphasizing that the fault is not just a voltage issue but also involves system energy balance.

In practical scenarios, the F2 fault interrupts motor operation, leading to production halts. If automatic retry (Auto Reset) is not set, manual reset is required. Understanding the subcodes helps quickly pinpoint the root cause and avoid blind troubleshooting.

Possible Cause Analysis

The causes of the F2 overvoltage fault are diverse and can be divided into internal and external factors. Based on the manual and engineering practice, the main causes are as follows:

  1. Deceleration Time Too Short. High-inertia loads (such as fans or elevators) generate significant regenerative energy during rapid deceleration, which cannot be absorbed by the DC-link capacitors, leading to voltage surges. This is the most common cause in industrial applications, accounting for over 40% of faults.
  2. Power Supply Network Issues. Input voltage fluctuations, harmonic interference, or grid spikes directly elevate the DC-link voltage. For example, when the supply voltage exceeds the rated value by 10%, the risk increases significantly. Multiple engineers have reported similar faults due to unstable grids in forum discussions.
  3. Braking System Failure. The brake chopper or external braking resistor is not enabled, damaged, or has insufficient capacity, failing to dissipate energy. The NXP series supports built-in or external choppers; if parameter P2.6.5.3 is set to 0 (disabled), faults are prone to occur.
  4. Load Characteristic Anomalies. Motor grounding faults, excessively long cables causing parasitic capacitance, or insulation issues in high-altitude environments can induce voltage spikes.
  5. Improper Parameter Settings. The overvoltage controller (P2.6.5.1) is not activated, or the reference voltage selection (P2.6.5.2) does not match the system (e.g., selecting the wrong high-voltage mode without a chopper).
  6. Hardware Aging. After long-term operation, the DC-link capacitor capacity degrades, unable to buffer voltage fluctuations. The Danfoss manual warns that 690Vac units operating above 1100Vdc for extended periods accelerate component aging.

These causes often interact; for instance, rapid deceleration combined with supply spikes amplifies the risk. Analysis should incorporate on-site data, such as monitoring unfiltered DC voltage (ID44) using NCDrive software.

Diagnostic Methods

Diagnosing the F2 fault requires systematic steps, ensuring safe operation (power off before inspection). The recommended process is as follows:

  1. Initial Check. View the display for fault codes and subcodes, and record the history log (V1.24.13). Use a multimeter to measure input voltage, ensuring it is within 380-500Vac (or 525-690Vac).
  2. Voltage Monitoring. Connect an oscilloscope or NCDrive to observe the DC-link voltage curve (V1.23.3). If spikes appear during deceleration, confirm regenerative energy issues.
  3. Parameter Verification. Enter the parameter menu to check P2.6.5.1 (overvoltage controller, default 1), P2.6.5.3 (chopper mode), and deceleration time (P2.1.4). If automatic retry (P2.16.5) is set to 0, consider enabling it to test transient faults.
  4. Hardware Inspection. Disconnect power and check braking resistor connections, resistance values (matching manual specifications), and chopper status. In test mode (P2.6.5.3=1), observe if F12 (chopper fault) is triggered.
  5. Load Testing. Run the inverter unloaded; if no fault occurs, the issue is on the load side; otherwise, check the power supply or internal boards.
  6. Advanced Tools. Use Danfoss-provided fault simulation parameters (P2.7.5, B01=+2 to simulate F2) to reproduce the issue. Export *.trn and *.par files for support team analysis.

The diagnostic process emphasizes data-driven approaches to avoid arbitrary adjustments. Video tutorials show that most faults can be located within 30 minutes.

VACON NXP

Solutions and Parameter Setting Guide

For the F2 fault, the manual offers multi-level solutions, from simple adjustments to hardware upgrades.

  1. Adjust Deceleration Time. Increase P2.1.4 (Decel Time) from the default by 20-50% and test gradually. Combine with P2.16.3 (Start Function=2, according to stop function) to optimize start/stop logic.
  2. Enable Overvoltage Controller. Set P2.6.5.1 to 1 (no ramp, P-type control) or 2 (with ramp, PI-type). Reference voltage selection (P2.6.5.2) based on chopper status: 0=high voltage (no chopper), 1=normal voltage, 2=chopper level (e.g., 844Vdc for 500Vac units).
  3. Configure Braking System. Activate P2.6.5.3 to 1 (used during running) or 3 (used during stop/running). Install an external braking resistor, ensuring capacity matches load inertia. Set to 4 for testing (no test running).
  4. Power Supply Optimization. Add input filters or voltage stabilizers to suppress spikes. For regenerative applications, consider an active front-end unit (AFE ARFIFF02) to feed energy back to the grid.
  5. Automatic Retry Mechanism. Set P2.16.5 (number of tries after overvoltage trip) to 1-10, combined with P2.16.1 (wait time=0.5s) and P2.16.2 (trial time=0.1s), to handle transient faults.
  6. Closed-Loop Settings. In closed-loop control mode, adjust P2.6.5.9.1 (overvoltage reference=118%, e.g., 1099Vdc for 690Vac) and PI gains (Kp, Ki) for fine voltage regulation.

During implementation, back up parameters first, modify step by step, and monitor. The manual stresses that parameter changes require a device restart to take effect.

Case Studies

Suppose a fan system uses an NXP inverter to drive a 5kW motor, frequently experiencing F2 S1 faults. Diagnosis shows a deceleration time of 2s with DC voltage peaking at 950Vdc. Solution: Extend deceleration to 5s, activate P2.6.5.1=2, and add a braking resistor. The fault is eliminated, and system efficiency improves by 15%.

Another case: A 690Vac elevator application with frequent S3 subcodes. The cause is grid fluctuations, with voltage long exceeding 1100Vdc. Adopting an AFE unit for energy feedback, combined with P2.6.5.2=2, resolves the issue. Similar cases are common in forums, proving the effectiveness of hardware upgrades.

Preventive Measures and Maintenance Recommendations

Preventing F2 faults starts from the design phase: Select inverter models matching the load and ensure a 20% margin in braking capacity. Regular maintenance includes cleaning heat sinks, checking capacitor capacity (every two years), and firmware updates (refer to Danfoss resources).

Best practices: Integrate monitoring systems for real-time DC voltage alerts; train operators to recognize early signs; use backup parameter groups (P2.16 series) for different conditions. In long-term operation, avoid high-altitude or humid environments that affect insulation.

Conclusion

Although the F2 overvoltage fault is common, it can be effectively managed through systematic analysis and parameter optimization. The Vacon NXP series, with its flexible control algorithms, provides robust protection mechanisms. Engineers should combine manuals, tools, and experience to ensure reliable equipment operation. In the future, with intelligent upgrades like AI predictive maintenance, such faults will be further reduced. Total word count approximately 2500 words. This article is original based on public resources and for reference use. If specific application consultation is needed, it is recommended to contact Danfoss support.

Posted on

Analysis and Solutions for CALL Alarm on Yaskawa V1000 Inverters

1. Introduction

In modern industrial automation systems, the inverter is the core device for motor control and energy-saving operations. It is widely used in pumps, fans, compressors, and various mechanical transmission systems. Among them, the Yaskawa V1000 inverter has become a popular choice due to its compact design, high reliability, and stable performance.

However, during field operation, many users encounter a situation where the inverter’s keypad displays “CALL”, while the ALM (alarm) indicator is lit. For beginners, this situation may seem confusing—“CALL” is often mistaken as a call instruction or program recall. In reality, it represents a communication-related warning.

This article will analyze the meaning of the CALL alarm, its possible causes, troubleshooting methods, and preventive measures, offering a structured guide to help engineers resolve this problem effectively.

CALL ALM

2. Meaning of CALL Alarm

On Yaskawa V1000 inverters, CALL means “Communication Awaiting”.

  • When the inverter is set to communication control mode, it continuously waits for data from the master device (PLC, PC, or communication module).
  • If no valid data is received within a specific time, the inverter enters the CALL state.
  • In this case, the ALM LED turns on, indicating a minor fault (warning). Unlike a trip fault, it does not immediately stop the inverter but signals that communication has not been established correctly.

Therefore, CALL is not a severe error code, but a reminder that the communication link is inactive or faulty.


3. Main Causes of CALL Alarm

Based on Yaskawa’s official manual and field experience, the CALL warning is generally triggered by the following issues:

1. Incorrect communication wiring

Improper connection of RS-485 or MECHATROLINK cables, short circuits, loose connections, or broken wires will cause communication failure.

2. Master device program not running or faulty

If the PLC or PC is not transmitting communication commands, the inverter will always remain in the CALL state.

3. Communication circuit malfunction

Damaged communication modules, defective ports, or strong external interference may disrupt data transmission.

4. Improper termination resistor setting

In Modbus/MEMOBUS or MECHATROLINK systems, termination resistors must be installed at both ends of the communication line. Incorrect settings lead to unstable signals and communication errors.

5. Incorrect control mode settings

If the inverter is configured to communication mode (e.g., o2- parameters set to serial communication) but no master is connected, it will always display CALL.


4. Troubleshooting Steps

When the inverter shows CALL with ALM lit, the following step-by-step procedure is recommended:

Step 1. Check wiring

  • Verify RS-485 polarity (A/B terminals).
  • Ensure shielded twisted pair cables are used and grounded properly.
  • Inspect for loose, shorted, or broken wires.

Step 2. Check the master device

  • Confirm that the PLC or PC communication port is enabled.
  • Ensure that the master continuously transmits communication commands (e.g., Modbus function codes, MECHATROLINK frames).
  • Debug the ladder program to confirm proper command output.

Step 3. Check termination resistors

  • Install a 120Ω resistor at both ends of the communication line.
  • If the V1000 has an internal switch for termination resistance (e.g., S2 switch), ensure it is set to ON.

Step 4. Verify inverter parameters

  • Confirm o2- parameters (control mode selection).
    • If communication is not required → set the mode to panel or terminal control.
    • If communication is required → ensure correct baud rate, parity, and slave address settings.

Step 5. Power cycle test

  • After corrections, restart the inverter.
  • If CALL disappears, the issue is solved.
  • If it persists, consider replacing the keypad, communication module, or contacting Yaskawa technical support.

Yaskawa_V1000_CALL_Flowchart

5. Case Studies

Case 1: Wiring error

A water pump system using PLC + V1000 in communication control showed CALL constantly. Upon inspection, RS-485 polarity was reversed. Correcting the wiring resolved the issue immediately.

Case 2: Master program inactive

In a production line upgrade, V1000 inverters were linked by Modbus. Since the PLC program had not been downloaded yet, all inverters displayed CALL. Once the master program was activated, the alarms cleared.

Case 3: Termination resistor missing

In a long-distance bus network, multiple V1000 units showed CALL alarms. Investigation revealed no termination resistors were installed. Adding 120Ω resistors at both ends solved the communication problem.


6. Preventive Measures

To avoid recurring CALL alarms, engineers should adopt the following best practices:

  1. Standardized wiring
    • Always use shielded twisted pair cables.
    • Properly ground the shield layer to reduce interference.
  2. Reliable master program
    • Ensure PLC/PC programs send communication frames immediately after startup.
    • Include heartbeat signals to prevent timeouts.
  3. Correct termination resistor setup
    • Always place resistors at both ends of the communication line.
    • Verify onboard termination switch settings.
  4. Control mode configuration
    • If communication is not required, set the inverter to terminal or panel control to prevent unnecessary CALL states.
    • If communication is required, confirm all protocol settings match between master and slave devices.
  5. Regular maintenance
    • Periodically inspect cable connections and terminal blocks.
    • Check communication bus health in multi-inverter systems.

7. Conclusion

The CALL alarm on Yaskawa V1000 inverters is essentially a communication waiting warning, not a critical trip. It indicates that the inverter is not receiving valid data from the master device.

By systematically checking wiring, master device operation, termination resistors, and control parameters, engineers can quickly identify and resolve the issue. Moreover, if communication is not used, simply switching to panel or terminal control mode will prevent the CALL alarm.

Understanding CALL’s meaning and mastering troubleshooting procedures not only reduces downtime but also enhances the reliability of the overall automation system.


Posted on

Why Laurell Spin Coater Shows “Need Vacuum” Even When the Sample is Held Securely – A Complete Troubleshooting Guide

1. Introduction

Spin coaters are critical tools in microfabrication, material science, and semiconductor laboratories. They rely on high-speed rotation to uniformly spread photoresists or other coating materials onto wafers, glass slides, or substrates. One of the most commonly used systems in this category is the Laurell Technologies spin coater series.

A built-in safety interlock system ensures that the sample does not fly off during rotation. This is achieved by using a vacuum chuck, which secures the wafer or substrate via suction. If the machine does not detect a valid vacuum signal, it will refuse to start the spin cycle and display the warning message:

“Need Vacuum”

This safety feature prevents dangerous accidents and sample loss. However, in some situations, operators may encounter a scenario where:

  • The sample is firmly held by the vacuum chuck, indicating that the vacuum suction is working.
  • But the controller display still shows “Need Vacuum”, and the motor will not rotate.

This contradiction is exactly the case observed by the customer in South Africa, as shown in the photos and video evidence provided.

In this article, we will thoroughly analyze the issue, explain why it happens, and provide a structured troubleshooting guide for engineers, technicians, and laboratory users.


2. How the Vacuum Interlock Works in Laurell Spin Coaters

To understand the problem, one must first understand the design of the vacuum interlock system:

  1. Vacuum Source
    • Usually provided by an external vacuum pump.
    • In some labs, a central vacuum line is available.
    • The pump draws negative pressure through tubing connected to the spin coater chuck.
  2. Vacuum Chuck
    • A flat plate with small holes that holds the sample by suction.
    • When the pump is active, the wafer is tightly fixed to the chuck surface.
  3. Vacuum Sensor or Switch
    • Located inside the spin coater.
    • Detects whether the vacuum level is sufficient for safe operation.
    • Sends a signal (ON/OFF or analog voltage) to the controller board.
  4. Controller Logic
    • If the vacuum sensor indicates “No Vacuum,” the motor remains locked.
    • If vacuum is detected, the program is allowed to start spinning.

Thus, the machine requires both physical vacuum suction AND a valid signal from the sensor.


3. Symptom Observed by the Customer

From the photos and video provided, the following facts were established:

  • The sample (a square substrate) is securely attached to the chuck during vacuum operation.
  • The vacuum pump and tubing system are operational, as suction is clearly holding the substrate.
  • Despite this, the Laurell controller display shows “Need Vacuum” and the spin motor does not activate.
  • The operator is stuck at Step 00 in the spin program, unable to proceed further.

This mismatch between actual vacuum state and controller feedback is the root cause of the complaint.


4. Possible Causes of the Problem

4.1 Vacuum Sensor Malfunction

  • The vacuum sensor inside the coater may have failed.
  • Even though negative pressure exists, the sensor does not detect or report it.
  • Sensors can fail due to aging, contamination, or internal electrical faults.

4.2 Wiring or Connection Issues

  • The electrical signal from the sensor to the main control board may be interrupted.
  • Loose connectors, broken wires, or corrosion can cause signal loss.
  • A perfectly working vacuum will not be recognized if the signal path is broken.

4.3 Blocked or Misrouted Sensor Line

  • In some Laurell models, the sensor has its own dedicated small tubing.
  • If this line is blocked, pinched, or not connected to the correct port, the sensor will not see the vacuum.
  • Meanwhile, the chuck still holds the wafer properly.

4.4 Controller I/O Board Failure

  • The sensor might be functional, but the control board input channel is defective.
  • The vacuum detection signal never registers in the system.

4.5 Incorrect Parameter or Setup Configuration

  • Laurell systems allow configuration of Vacuum Interlock settings.
  • If the interlock is mistakenly disabled or misconfigured, the machine logic can behave unexpectedly.
  • For example, the controller might be waiting for a different signal threshold than what the sensor provides.

5. Evidence from the Video

The customer’s video shows:

  • At the beginning, the wafer is firmly attached to the vacuum chuck.
  • The operator gently touches or shakes it, and it stays in place.
  • This proves that vacuum suction is indeed active.
  • However, the spin coater does not proceed with rotation, confirming that the problem lies in signal recognition, not actual suction.

This video evidence eliminates issues like:

  • Faulty vacuum pump.
  • Leaking tubing.
  • Improper wafer placement.

Therefore, the focus must shift to detection, feedback, and controller logic.


6. Step-by-Step Troubleshooting Guide

Step 1: Confirm Vacuum Pump Operation

  • Ensure the pump is turned on.
  • Measure vacuum level at the pump output with a gauge (should meet Laurell’s specifications).

Step 2: Verify Chuck Suction

  • Place a sample or even a flat piece of glass.
  • If it is firmly held, the vacuum path from pump → tubing → chuck is confirmed.

Step 3: Inspect Sensor Tubing (if applicable)

  • Some models use a separate small tube leading to the vacuum sensor.
  • Make sure it is not disconnected, clogged, or leaking.

Step 4: Check Sensor Signal

  • Disconnect the electrical connector from the sensor.
  • Measure output with a multimeter when vacuum is applied.
  • If the signal does not change, the sensor is defective.

Step 5: Test Wiring Integrity

  • Use continuity testing on the wiring harness from sensor to controller.
  • Repair or replace cables if broken.

Step 6: Bypass/Short Test (For Verification Only)

  • Short the sensor signal input to simulate “vacuum present.”
  • If the machine starts spinning, the controller is fine but the sensor or wiring is faulty.

Step 7: Check Controller Settings

  • Access the system configuration menu.
  • Verify that Vacuum Interlock is enabled and thresholds are correct.
  • If necessary, temporarily disable interlock for diagnostic purposes (not recommended for normal operation).

Step 8: Controller Board Diagnosis

  • If sensor and wiring are confirmed good, the controller input board may be defective.
  • Replacement or repair of the I/O board is required.

7. Practical Recommendations

  • Replace the vacuum sensor if it shows no electrical response under suction.
  • Check and secure wiring connectors to eliminate intermittent signals.
  • Clean the sensor line to remove possible blockages.
  • Review the configuration in the Laurell menu to ensure interlock is properly set.
  • Contact Laurell service if controller hardware is suspected faulty.

8. Why This Problem Matters

This situation highlights an important principle in equipment maintenance:

  • Mechanical performance does not guarantee electrical recognition.
  • Even though the vacuum holds the wafer physically, the safety system relies on an independent electrical or pneumatic feedback mechanism.
  • If the feedback loop is broken, the machine assumes unsafe conditions and refuses to operate.

Such protective interlocks are common in high-speed rotating machinery, where user safety must always be prioritized.


9. Conclusion

The South African customer’s Laurell spin coater issue is a textbook case where vacuum is physically present, but the system still displays “Need Vacuum.”

  • The video clearly shows that the wafer is tightly held, ruling out pump or chuck problems.
  • Therefore, the most probable causes are vacuum sensor failure, wiring disconnection, or controller input malfunction.
  • A systematic troubleshooting procedure should start from confirming sensor response, checking wiring, and reviewing interlock settings, before finally suspecting controller board faults.

Ultimately, the problem is not the vacuum itself, but the failure of the machine to recognize and accept the vacuum signal.

By following the structured troubleshooting flowcharts and step-by-step guide, laboratory staff can isolate the fault, repair it effectively, and restore the spin coater to full working condition.


Posted on

Causes of Poor Repeatability in Bingham Viscosity Measurements of Automotive PVC Sealing Adhesives and Troubleshooting Strategies for Rheometers


Introduction

In the automotive industry, PVC sealing adhesives are widely used for seam sealing, underbody protection, and surface finishing. Their typical formulation includes polyvinyl chloride (PVC), plasticizers such as diisononyl phthalate (DINP), inorganic fillers like nano calcium carbonate, and thixotropic agents such as fumed silica. These materials exhibit strong thixotropy and yield stress behavior, which are critical for application performance: they must flow easily during application but quickly recover structure to maintain thickness and stability afterward.

anton paar mcr 52

Rheological testing, particularly the determination of Bingham parameters (yield stress τ₀ and plastic viscosity ηp), is a key method for evaluating flowability and stability of such adhesives. However, in practice, it is common to encounter the problem that repeated tests on the same PVC adhesive sample yield very different Bingham viscosity values. In some cases, customers suspect that the rheometer itself may be faulty.

This article systematically analyzes the main causes of poor repeatability, including sample-related issues, operator and method-related factors, and potential instrument malfunctions. Based on the Anton Paar MCR 52 rheometer, it also provides a structured diagnostic and troubleshooting framework.


I. Bingham Viscosity and Its Testing Features

1. The Bingham Model

The Bingham plastic model is a classical rheological model used to describe fluids with yield stress: τ=τ0+ηp⋅γ˙\tau = \tau_0 + \eta_p \cdot \dot{\gamma}

where:

  • τ = shear stress
  • τ₀ = yield stress
  • ηp = Bingham (plastic) viscosity
  • γ̇ = shear rate

The model assumes that materials will not flow until shear stress exceeds τ₀, and above this threshold the flow curve is approximately linear. For PVC adhesives, this model is widely applied to describe their application-stage viscosity and yield properties.

2. Testing Considerations

  • Only the linear region of the flow curve should be used for regression.
  • Pre-shear and rest conditions must be standardized to ensure consistent structural history.
  • Strict temperature control and evaporation prevention are required for repeatability.

II. Common Causes of Poor Repeatability in Bingham Viscosity

The variability of results can arise from four categories: sample, operator, method, and instrument.

1. Sample-Related Issues

  • Formulation inhomogeneity: uneven dispersion of fillers or thixotropic agents between batches.
  • Bubbles and inclusions: entrapped air leads to noisy stress responses.
  • Evaporation and skin formation: solvents volatilize during testing, increasing viscosity over time.
  • Thixotropic rebuilding: variations in rest time cause different recovery levels of structure.

2. Operator-Related Issues

  • Loading technique: inconsistent trimming or sample coverage affects shear field.
  • Geometry handling: inaccurate gap, nonzero normal force, or loose clamping.
  • Temperature equilibration: insufficient time before testing.
  • Pre-shear conditions: inconsistent shear strength or rest period.

3. Methodological Issues

  • Regression region: including nonlinear low-shear regions distorts ηp.
  • Mode differences: mixing CSR (controlled shear rate) and CSS (controlled shear stress) methods.
  • Wall slip: smooth plates cause the sample to slip at the surface, lowering viscosity readings and increasing scatter.

4. Instrument-Related Issues

  • Torque transducer drift: unstable baseline, noisy low-shear data.
  • Air-bearing or gas supply issues: unstable rotation, periodic noise.
  • Temperature control errors: set vs. actual sample temperature mismatch, viscosity drifts with time.
  • Normal force sensor faults: incorrect gap and shear field.
  • Mechanical eccentricity: loose or misaligned geometries.
  • Software compensation disabled: compliance/inertia corrections not applied.

III. Challenges Specific to PVC Adhesives

PVC adhesives for automotive applications present several specific difficulties:

  1. Strong thixotropy: rapid breakdown under shear and fast structural recovery on rest, highly sensitive to pre-shear and rest history.
  2. Wall slip tendency: filler- and silica-rich pastes often slip on smooth plates, producing low and inconsistent viscosity readings.
  3. Evaporation and skinning: solvent/plasticizer volatilization leads to viscosity increase during tests.
  4. Wide nonlinear region: low-shear region dominated by rebuilding effects, unsuitable for Bingham regression.

anton paar mcr 52

IV. Recommended SOP for PVC Adhesive Testing

To achieve consistent Bingham viscosity results, the following SOP is recommended:

1. Geometry

  • Prefer vane-in-cup (V-20 + CC27) or serrated parallel plates (PP25/SR) to reduce wall slip.

2. Temperature Control

  • Test at 23.0 ± 0.1 °C or as specified.
  • Allow 8–10 min equilibration after loading.
  • Use solvent trap/evaporation ring; seal edges with petroleum jelly.

3. Sample Loading & Pre-Shear

  • Load slowly, avoid entrapping bubbles, trim consistently.
  • Pre-shear: 50 s⁻¹ × 60 s → rest 180 s under solvent trap.

4. Measurement Program

  • CSR loop: 0.1 → 100 → 0.1 s⁻¹ (logarithmic stepping).
  • Dwell: 20–30 s per point or steady-state criterion.
  • Discard first loop; fit second loop linear region (10–100 s⁻¹).

5. Data Processing

  • Report τ₀ and ηp with R² ≥ 0.98.
  • Document regression range and hysteresis.

6. Quality Control

  • Target repeatability: CV ≤ 5% for ηp (≤8% for highly thixotropic samples).
  • Use standard oils or internal control samples daily.

V. How to Verify If the Instrument Is Faulty

When customers suspect a rheometer malfunction, simple tests with Newtonian fluids can clarify:

  1. Zero-drift check
  • Run empty for 10–15 min; torque baseline should remain stable.
  1. Standard oil repeatability
  • Load the same Newtonian oil three times independently.
  • Target: viscosity CV ≤ 2%, R² ≥ 0.99.
  1. Temperature step test
  • Measure at 23 °C and 25 °C; viscosity should change smoothly and predictably.
  1. Geometry swap
  • Compare results using PP25/SR and CC27; Newtonian viscosity should agree within ±2%.
  1. Air supply check
  • Confirm correct pressure, dryness, and filter condition for the air bearing.

If the standard oil also shows poor repeatability, then instrument malfunction is likely. Probable causes include:

  • Torque transducer failure/drift.
  • Air-bearing instability.
  • Temperature control faults.
  • Normal force or gap detection errors.
  • Disabled compliance/inertia compensation.

VI. Communication Guidelines with Customers

  1. Eliminate sample and method factors first: the thixotropy, volatility, and wall slip of PVC adhesives are usually the dominant causes of poor repeatability.
  2. Verify instrument health with standard oils: if oil results are consistent, the instrument is healthy and SOP must be optimized; if not, escalate to service.
  3. Provide an evidence package: standard oil data, zero-point stability logs, temperature records, air supply parameters, geometry and gap information, and compensation settings.

Conclusion

Automotive PVC sealing adhesives are complex materials with strong thixotropic and yield stress behavior. In rheological testing, poor repeatability of Bingham viscosity can be attributed to sample properties, operator inconsistencies, methodological flaws, or instrument faults.

By applying a standardized SOP—including vane or serrated geometry, strict temperature control, controlled pre-shear and rest times, and regression limited to the linear region—repeatability can be significantly improved.

To determine whether the instrument is at fault, repeatability checks with Newtonian standard oils provide the most objective method. If results remain unstable with standard oils, instrument issues such as torque transducer drift, air-bearing instability, or temperature control errors should be suspected.

Ultimately, distinguishing between sample/method effects and instrument faults is essential for efficient troubleshooting and effective communication with customers.


Posted on

PowerFlex 400 Drive Parameter Diagnostics and Communication Guide

— Practical Application of DriveExecutive Software with USB-DSI Adapter


1. Introduction

In the field of industrial automation, variable frequency drives (VFDs) play a central role in motor control and energy efficiency. Among them, the Allen-Bradley PowerFlex family from Rockwell Automation is widely recognized for its reliability, flexibility, and robust communication options.

This article focuses on the PowerFlex 400 drive (e.g., Cat No. 22C-D142A103) and demonstrates how to use DriveExecutive software together with a USB-to-DSI communication adapter to perform parameter diagnostics, upload/download operations, and fault analysis. By combining hardware setup, software configuration, and troubleshooting techniques, this guide provides a complete workflow for engineers working in the field.


RSLinx

2. Overview of the PowerFlex 400

The PowerFlex 400 is a VFD designed specifically for fan and pump applications. Its main characteristics include:

  1. Voltage class: 380–480V three-phase input;
  2. Power range: from 3 kW to 250 kW, with the case in this article being 75 kW (100 HP);
  3. Built-in communication: standard RS485 (DSI) port, expandable to Modbus, EtherNet/IP, DeviceNet, and others;
  4. Application features: optimized PID control for HVAC and pumping systems, built-in bypass logic, and energy-saving functions.

3. Diagnostic Needs in the Field

Typical on-site requirements for engineers include:

  • Reading and backing up all drive parameters;
  • Monitoring real-time operating data such as voltage, current, frequency, and load;
  • Modifying parameters for control mode tuning or PID loop optimization;
  • Accessing fault and alarm history for troubleshooting.

To accomplish these tasks efficiently, a reliable PC-based diagnostic tool is essential. The combination of DriveExecutive software and a USB-to-DSI adapter is one of the most recommended solutions.


powerflex 400

4. Required Hardware and Software

Hardware

  • PowerFlex 400 VFD (e.g., Cat No. 22C-D142A103);
  • USB-to-DSI communication adapter (1203-USB is the official Rockwell option; third-party compatible adapters may also work);
  • A Windows PC or laptop;
  • Proper cabling (USB to PC, DSI end to the drive’s RS485 port).

Software

  • RSLinx Classic: Rockwell’s official communication driver software, required for all connections;
  • DriveExecutive: the parameter management and diagnostic tool used to interact with the drive.

5. Step-by-Step Connection Procedure

1. Physical Connection

  • Plug the USB-to-DSI adapter into the PC;
  • Connect the other end of the adapter to the PowerFlex 400’s DSI port (typically marked R+, R-, COM);
  • Ensure the drive is powered on.

2. Configuring RSLinx Classic

  1. Open RSLinx Classic;
  2. Navigate to Communications → Configure Drivers…;
  3. Add a new driver:
    • For the original 1203-USB: choose USB-DF1 Devices;
    • For third-party USB-RS485 adapters: choose RS232 DF1 Devices;
  4. Select the correct COM port for the adapter;
  5. Click Auto-Configure. If the message “Successfully configured” appears, communication is established.

3. Connecting with DriveExecutive

  1. Launch DriveExecutive;
  2. From the menu, select Drive → Connect;
  3. Choose RSLinx as the communication path;
  4. Browse for the device and locate PowerFlex 400 [Node Address];
  5. Click to connect and enter the parameter view.

driveExecutive

6. Troubleshooting Common Issues

  1. Adapter not recognized
    • Ensure the USB driver for the adapter is installed;
    • Check Windows Device Manager to confirm the virtual COM port is created.
  2. Auto-Configure fails
    • Verify proper wiring to the DSI port, paying attention to polarity of R+ and R-;
    • Ensure the baud rate matches the default setting (typically 19.2 kbps).
  3. DriveExecutive cannot detect the drive
    • Confirm that RSLinx RSWho can see the drive node;
    • If visible in RSLinx but not in DriveExecutive, refresh the communication path or check software licensing.
  4. Unstable third-party adapter
    • Some non-official adapters may cause unreliable communication. For critical or long-term use, the official 1203-USB adapter is strongly recommended.

7. Practical Applications and Benefits

With the setup described above, engineers can perform the following tasks effectively:

  • Parameter upload and download: simplifying commissioning and backup;
  • Real-time monitoring: displaying drive data such as current, output frequency, and DC bus voltage;
  • Fault diagnostics: quickly identifying root causes by reviewing alarm and fault logs;
  • Remote support: when paired with VPN or remote desktop tools, parameter diagnostics can be carried out off-site, minimizing downtime.

In large-scale pump stations and building automation systems, this workflow greatly improves efficiency and reliability in maintenance operations.


8. Conclusion

The PowerFlex 400 is a well-established drive optimized for fan and pump loads. In practice, engineers often need to back up, monitor, and adjust parameters while troubleshooting on-site. By combining DriveExecutive software, RSLinx Classic, and a USB-to-DSI adapter, a comprehensive solution for diagnostics and communication is achieved.

For occasional parameter access, third-party USB-RS485 cables may suffice. However, for professional and long-term industrial use, the official 1203-USB adapter ensures maximum stability and compatibility.

As industrial systems evolve toward Ethernet-based communication (EtherNet/IP), USB-to-DSI solutions may gradually be phased out. Nevertheless, given the large installed base of PowerFlex 400 and similar models, this approach remains highly practical and relevant in today’s fieldwork.


Posted on

🛠 Wiring and Testing Steps for Rexroth MSK Series Servo Motor Brakes

1. Confirm Motor Model and Brake Parameters

  • Model: MSK071E-0303-FN-M1-UG2-NNNN
  • Nameplate Parameters: Brake 30Ω, DC 24V ±10%, 0.94A
    👉 Indicates that this motor is equipped with a DC brake, rated for a working voltage of 24VDC, which releases the brake when powered and locks it when de-energized.

2. Wiring Identification

  • Red Wire → +24VDC
  • Blue Wire → 0V (Negative)
  • (Gray Wire Pair) = Temperature Sensor, not involved in brake testing.

3. Power Supply Preparation

  • Use a regulated 24VDC power supply with a rated current of ≥2A (reserve a margin, although normal operation requires approximately 1A).
  • The power supply should have overcurrent protection to prevent damage from short circuits.
  • If possible, it is best to use a power supply with soft start or current limiting functions.

4. Testing Steps

  1. Disconnect the motor and confirm that the motor’s main power supply is not connected.
  2. Connect the positive terminal of the power supply to the red wire and the negative terminal to the blue wire.
  3. Apply 24VDC power:
    • You should hear a “click” sound, indicating that the brake has been released.
    • Gently rotate the motor shaft by hand; it should rotate freely.
  4. Disconnect the 24VDC power supply:
    • Attempt to rotate the motor shaft again; it should be locked by the mechanical brake.

5. Precautions

  • Never operate the motor shaft for extended periods with the brake continuously powered without control from a motor driver, as excessive inertia from shaft rotation may damage the brake pads.
  • In practical applications with a driver, the brake signal is usually controlled by the driver’s Brake Output; do not continuously apply direct power.
  • If the brake fails to release, check the following:
    • Whether the power supply voltage is within 24V ±10%.
    • Whether the power supply current is sufficient.
    • Whether the red/blue wires are reversed (reversing them will prevent release).

✅ Summary:

  • Red → +24VDC, Blue → 0V
  • Power on to release, power off to lock.
  • Testing method: Listen for sound, rotate shaft.