Posted on

Comprehensive Analysis of the Yaskawa Varispeed F7 PG Feedback Card — A Practical Study on the SI-P1 Ver 3.04

1. Introduction: The Role of the PG Card in Inverter Control Systems

In modern vector-control inverters, the PG card (Pulse Generator card) plays a central role.
It acts as an interface between the inverter and the motor encoder, acquiring high-precision rotational signals from the motor shaft and feeding them back to the inverter’s control CPU.
Through this feedback, the inverter can precisely detect speed, position, and rotational phase, enabling closed-loop vector control, zero-servo holding, stable-speed regulation, and torque compensation.

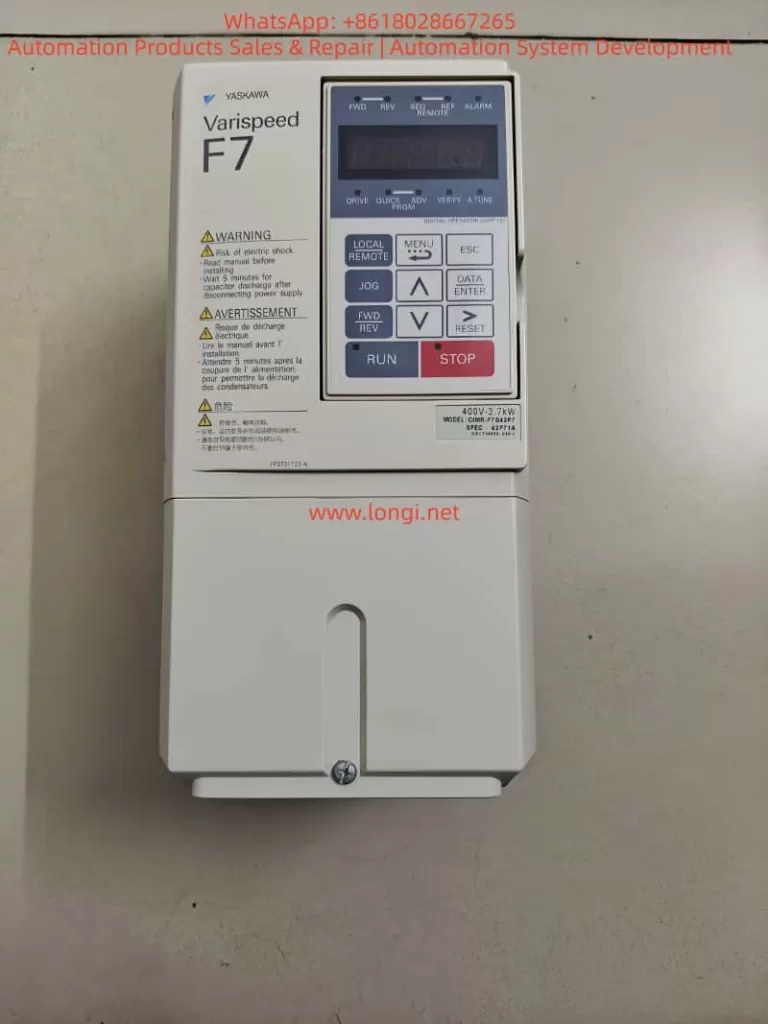
In Yaskawa’s Varispeed F7 series, the PG feedback card is not just an accessory—it is the core component that transforms the inverter from a standard open-loop V/f device into a high-performance vector drive.
With accurate speed feedback, the F7 achieves servo-level control precision, excellent dynamic response, and high stability even under heavy load variations.

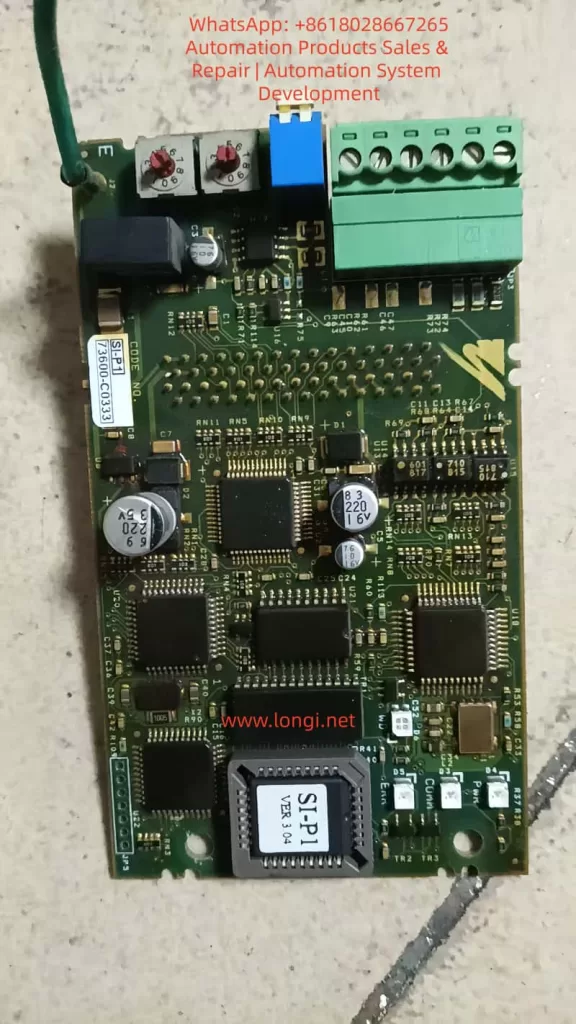
This paper focuses on the SI-P1 Ver 3.04 PG card (code 73600-C0333 / SIP-901), an OEM version widely used in the F7 family.
By comparing it with the official PG-A2/B2/D2/X2 cards described in Yaskawa’s manuals, we analyze its structure, compatibility, wiring method, parameter configuration, and field performance in real industrial applications.


2. Technical Background — Function and Principle of PG Feedback

2.1 Basic Function of the PG Card

The PG card’s primary function is to receive incremental encoder signals (A, B, Z phases) and convert them into the internal pulse format that the inverter’s CPU can process.
Based on these pulses, the inverter continuously calculates the rotational speed, direction, and position deviation of the motor.

This closed-loop feedback enables several advanced control modes:

  • Speed Feedback Control — maintains a precise target RPM regardless of load fluctuation.
  • Torque Compensation — improves low-speed torque stability.
  • Zero-Servo Control — holds the motor shaft at a fixed mechanical position.
  • Regenerative Braking Control — enhances braking torque using feedback phase information.

The accuracy and signal integrity of the PG card determine the overall response time, torque precision, and stability of the system.


2.2 Common PG Cards Used with the Varispeed F7

ModelSignal TypeSupply VoltageTypical ApplicationRemarks
PG-A2Differential TTL (A/A¯, B/B¯, Z/Z¯)+5 VStandard incremental encodersMost widely used type
PG-B2Open-collector (single-ended A/B)+12 VNPN output encodersFor environments with higher noise
PG-D2Push-pull (A/B/Z quadrature)+15 VHeavy industrial, long-distance feedbackExcellent noise immunity
PG-X2High-speed TTL differential+5 VHigh-resolution / high-speed vector controlUsed in advanced servo applications

All four cards share the same mechanical interface and CN5 connector, but differ in electrical levels and signal types.
Among them, PG-A2 is the standard type used in most F7 applications.


3. Identifying the SI-P1 Ver 3.04 and Its Compatibility

Although the SI-P1 Ver 3.04 is not explicitly listed in the official F7 manual, practical testing and circuit comparison confirm that:

The SI-P1 Ver 3.04 is an OEM-equivalent version of the PG-A2 card.

The justification is as follows:

  1. Identical Signal Architecture
    The SI-P1 accepts differential inputs for A, /A, B, /B, Z, /Z, which perfectly matches the TTL line-driver interface of PG-A2.
  2. Same Power Requirements
    It provides an internal +5 V DC output (maximum 200 mA) for encoder supply—exactly like the PG-A2—and does not support 12 V or 15 V encoders.
  3. Same Physical Connector
    The card plugs directly into the F7 control PCB via the CN5 slot. Pin layout and dimensions are identical to the PG-A2.
  4. Firmware Generation
    The “Ver 3.04” label corresponds to the firmware generation period of early-2000s Yaskawa F7 inverters, when PG-A2 was the default model.

Hence, the SI-P1 card can be treated as functionally identical to PG-A2.
All wiring, parameter settings, and diagnostic methods described for PG-A2 apply equally to SI-P1.


4. Detailed Wiring between the SI-P1 and the Encoder

4.1 Terminal Definitions

PinSignal NameFunctionDescription
1+5 VEncoder Power SupplyProvides +5 V DC (≤ 200 mA)
20 VPower GroundCommon reference for encoder
3APhase A positiveForward rotation signal
4/APhase A negativeDifferential complement
5BPhase B positive90° shift from A
6/BPhase B negativeDifferential complement
7ZZero-mark signalOnce-per-revolution pulse
8/ZZero-mark complementOptional connection
FGFrame GroundConnect to shield of cable

Use twisted-pair shielded cable for each differential pair (A/A¯, B/B¯, Z/Z¯).
Connect the cable shield to FG at the inverter side only.


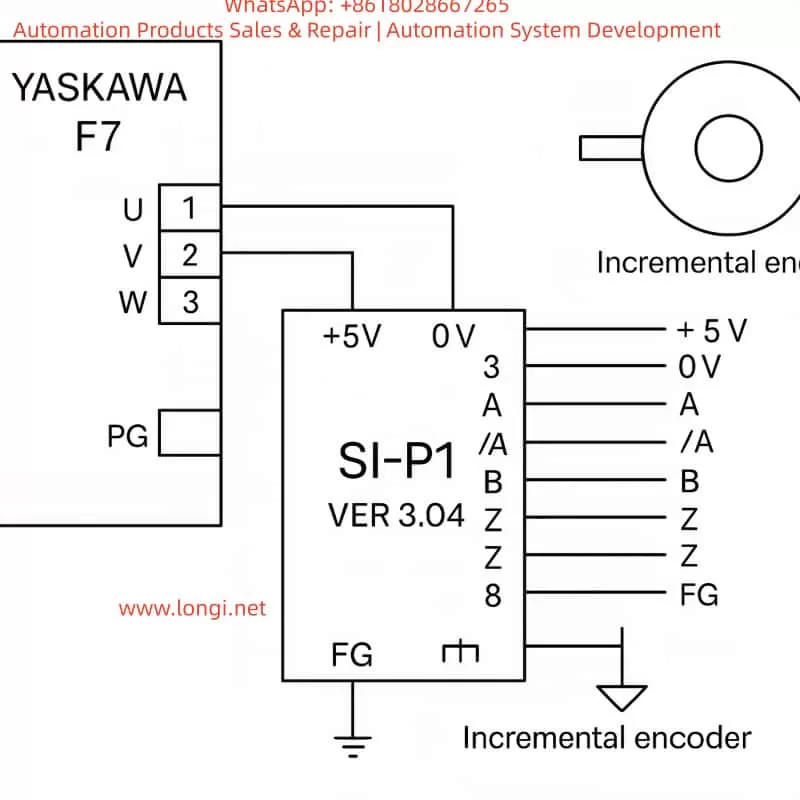
4.2 Typical Wiring Diagram

Encoder Side               SI-P1 PG Card
+5 V  ───────────────────────→  Pin 1 (+5 V)
0 V   ───────────────────────→  Pin 2 (0 V)
A    ───────────────────────→  Pin 3 (A)
A¯   ───────────────────────→  Pin 4 (/A)
B    ───────────────────────→  Pin 5 (B)
B¯   ───────────────────────→  Pin 6 (/B)
Z    ───────────────────────→  Pin 7 (Z)
Z¯   ───────────────────────→  Pin 8 (/Z)
Shield layer ─────────────→  FG (Ground)

This standard differential connection ensures noise immunity and reliable high-speed feedback, even under strong EMI conditions.


4.3 Electrical Precautions

  • Keep the encoder cable shorter than 20 m; for longer runs, use a differential line driver (RS-422 standard).
  • Never connect both ends of the shield to ground—do so only on the inverter side.
  • Verify the A/B phase shift (90° ± 10°) using an oscilloscope; reversed A/B causes inverted rotation detection.
  • Avoid running encoder cables in parallel with power cables.

5. Parameter Configuration and Commissioning

To enable the feedback loop, several parameters must be configured in the Varispeed F7:

ParameterDescriptionTypical SettingNotes
A1-02Control Mode Selection3“Vector control with PG”
F1-01Encoder Pulses per Revolutione.g., 1024 PPRMatch actual encoder
F1-03PG Input Type0Differential TTL input
E1-04Rotation Direction Logic0 or 1Depends on wiring
U1-05Monitor Speed FeedbackUsed for verification

Commissioning Steps

  1. Open-loop Test
    Run the inverter without enabling PG feedback. Verify that the motor runs smoothly and direction matches your system.
  2. Enable Closed-Loop Mode
    Set A1-02 = 3 and cycle the power. The inverter now reads encoder feedback. Observe that the motor starts softly and maintains constant speed.
  3. Zero-Servo or Position Hold
    For applications requiring shaft holding, fine-tune parameters F1-05 to F1-07.
  4. Verification
    Check parameter U1-05 to ensure displayed speed matches the actual RPM measured by a tachometer.

6. Practical Field Experience and Case Studies

Case 1: Speed Feedback Optimization

A 37 kW Varispeed F7 inverter driving a conveyor motor used a 1024 PPR encoder.
After replacing a damaged PG-A2 with an SI-P1 Ver 3.04, the system was configured with:

  • A1-02 = 3
  • F1-01 = 1024
  • F1-03 = 0

Result:
Acceleration response improved from 100 ms to 40 ms, and steady-state speed fluctuation dropped below 0.3%.
The SI-P1 performed identically to the original PG-A2.


Case 2: Direction Error due to Reversed Phases

In a hoisting control system, swapping A/B signal pairs caused the inverter to misinterpret rotation direction, leading to oscillation.
After interchanging the A and B channels, feedback direction was corrected, and stability restored.


Case 3: Noise Interference and Shielding

A 15 m unshielded encoder cable caused ±5% speed variation due to EMI.
Replacing it with twisted-pair shielded cable and grounding only at the inverter side reduced fluctuation to ±0.2%.
Proper shielding proved critical for feedback reliability.


7. Signal Verification and Maintenance

Regular inspection of the PG system is essential for long-term stability.

7.1 Oscilloscope Test

Check A/B waveforms at the PG card input:

  • Duty cycle ≈ 50%
  • Phase shift ≈ 90°
    Distorted or noisy waveforms indicate cable damage or grounding issues.

7.2 Feedback Speed Monitoring

Under no-load constant-speed operation, monitor U1-05.
If speed fluctuates, inspect PG connections, encoder bearings, and connector pins.

7.3 Cleaning and Care

The PG card contains sensitive CMOS components.
Avoid dust or moisture.
Clean contacts periodically with isopropyl alcohol and ensure firm seating in the CN5 slot.


8. Signal Mapping Comparison: SI-P1 vs PG-A2

FunctionSI-P1 PinPG-A2 PinRemark
+5 V Supply11Encoder Power
0 V Ground22Common Ground
A Signal33Differential +
/A Signal44Differential –
B Signal55Differential +
/B Signal66Differential –
Z Signal77Zero Pulse
/Z Signal88Complement Zero
FG ShieldFGFGCable Shield Ground

The one-to-one correspondence confirms that SI-P1 can replace PG-A2 without modification.


9. Engineering Discussion and Technical Insights

  1. Functional Equivalence
    The SI-P1 Ver 3.04 is a fully compatible PG-A2 card, supporting all F7 feedback control modes including vector, torque, and zero-servo functions.
  2. Signal Quality is Paramount
    Differential signal integrity and proper grounding are more critical than parameter tuning.
    Incorrect grounding can produce random “PG Loss” or “OV” faults.
  3. Parameter Matching
    Always set the correct encoder PPR (F1-01) and direction logic (E1-04) to avoid instability or reverse torque.
  4. Maintenance Importance
    Connector oxidation and vibration loosening are common causes of intermittent speed errors.
    Regular re-seating of the card ensures reliability.
  5. Cost-Effective Substitution
    For legacy F7/G7 systems, the SI-P1 serves as an excellent, low-cost replacement for discontinued PG-A2 cards without any firmware or wiring change.

10. Conclusion

The Yaskawa Varispeed F7 remains one of the most reliable inverter platforms in industrial automation.
As the key interface between the drive and the motor’s feedback device, the PG card is indispensable for achieving high-performance vector control.

Through detailed examination, this study confirms that SI-P1 Ver 3.04 is technically equivalent to the PG-A2 model.
It shares the same wiring, electrical characteristics, and parameter settings.
When properly connected and configured (A1-02 = 3), it enables full closed-loop operation with high accuracy and stability.

For field engineers, understanding this equivalence provides a major advantage—allowing quick replacement, reduced downtime, and seamless integration in maintenance or retrofit projects.


11. Summary of Best Practices

  • Always use shielded twisted-pair cable, one pair per differential channel.
  • Ground the shield at one end only (inverter side).
  • Verify A/B phase direction before enabling closed-loop mode.
  • Configure feedback parameters carefully according to the encoder specifications.
  • Periodically check the CN5 slot and card contacts for corrosion or dust.

By following these practices, the SI-P1 PG feedback system can deliver long-term precision and reliability comparable to servo-class control systems.


Author’s Note

This article is written as an original technical analysis for maintenance engineers, automation specialists, and industrial electronics technicians who maintain or retrofit Yaskawa Varispeed F7 inverters.
It integrates both manual specifications and real-world experience gathered from field repairs and performance testing.


Posted on

Technical Analysis and Application of Startup Display Diagnosis from “1.d002” to “00ST” in Leadshine L7 Series Servo Drives

Abstract
The Leadshine L7 series AC servo drives are crucial components in the field of industrial automation. The startup display sequence reflects the device’s initialization status and operational readiness. This paper provides an in-depth analysis of the phenomenon where users observe a brief display of “1.d002” followed by a switch to “00ST,” indicating a normal initialization process. By interpreting the manual, safety precautions, and incorporating online resources from similar EL7 series, it explores the meanings of display codes, diagnostic methods, potential causes, and optimization strategies, aiming to offer comprehensive guidance to engineers and technicians.

Introduction
In modern industrial automation systems, servo drives play a pivotal role. The Leadshine L7 series AC servo drives utilize the latest DSP from Texas Instruments (TI), featuring high integration and reliability. Users often encounter startup display issues, such as the display showing “1.d002” briefly after power-on, followed by a switch to “00ST.” This paper centers on this phenomenon, conducting a systematic analysis by combining excerpts from the user manual and online resources, aiming to assist users in understanding the technical implications of the display sequence and providing practical diagnostic steps.

Servo Drive Fundamentals

Basic Principles

Servo drives drive servo motors to achieve precise motion by receiving command signals from an upper-level controller. The fundamental principles include triple-loop control (position loop, speed loop, and current loop), with PID algorithms at the core.

L7 Series Characteristics

The L7 series belongs to AC servo drives, supporting 220VAC input and a wide power range. The manual emphasizes that improper operation can lead to severe consequences, and users must adhere to safety precautions.

Key Components and Initialization

The key components of a servo system include the drive, motor, and encoder. The drive integrates a DSP processor, and the initialization process involves self-tests, parameter loading, and status monitoring.

Display Panel Basics

The display panel employs a seven-segment LED digital tube, supporting status display, parameter settings, and alarm prompts. Understanding these codes is crucial for diagnosing device status.

Control Modes and Parameter Settings

Servo drives offer control modes including position, speed, and torque modes. Parameter settings are achieved through panel buttons or MotionStudio software.

Safety Guidelines

The manual stresses that product storage and transportation must comply with environmental conditions, and user modifications will void the warranty.

Overview of the L7 Series

Product Features and Updates

The Leadshine L7 series is a fully digital AC servo drive, utilizing TI DSP, supporting stiffness tables, inertia identification, and vibration suppression. The version has evolved from V1.00 to V2.10 with continuous updates.

Application Areas and Manual Structure

The L7 series finds wide applications in PLC control, robotic arms, and other fields. The manual structure covers the preface, safety matters, specifications, installation, wiring, commissioning, and maintenance.

Wiring and Version Descriptions

Wiring includes power, motor, encoder, and I/O ports. The version description indicates program compatibility and content updates.

Display Panel in Detail

Operation Interface and Key Functions

The L7 drive’s operation interface consists of a 6-digit LED digital tube and 5 keys for status display and parameter settings.

Initialization and Monitoring Mode Codes

Upon power-on, the panel first displays initialization codes. “1.d002” may be a custom or transient display, and switching to “00ST” indicates a standby state. Monitoring mode codes include position deviation, motor speed, etc.

Alarm Code Interpretation

Alarm codes start with “Er,” and the absence of “Er” indicates normal operation.

Diagnostic Analysis

Core Phenomenon Interpretation

The display showing “1.d002” briefly followed by a switch to “00ST” is a normal sequence. The initialization process includes self-tests and parameter loading.

Potential Causes Explored

Potential causes include normal boot-up, configuration influences, and external factors.

Diagnostic Steps and Methods

Diagnostic steps include checking the display history, software verification, and factory reset.

Troubleshooting

Non-Normal Situation Exclusion Methods

If non-normal, exclusion methods include power supply checks, wiring verification, parameter resets, and software tuning.

Common Faults and Solutions

Common faults such as overcurrent and overload are unrelated to the display sequence.

Applications and Optimization

Case Studies: CNC Machine Tools and Robotic Arms

Case 1: A CNC machine tool uses the L7 to control axes, and a normal startup sequence ensures precision. Case 2: A robotic arm in bus mode uses EtherCAT synchronization to avoid delays.

Optimization Strategies and Future Trends

Optimization strategies include adjusting control modes and vibration suppression. Future trends involve integrating AI tuning.

Conclusion
The transition from “1.d002” to “00ST” indicates a normal state. Mastering diagnostic methods can enhance application efficiency. It is recommended to refer to the manual and technical support to ensure stable system operation.

Posted on

In-Depth Analysis and Maintenance Practices for Mitsubishi FR-A700 Inverter “E.7” CPU Error

I. Introduction: When the Brain of the Drive Crashes

The Mitsubishi FREQROL-A700 inverter series is renowned for its high-performance vector control, stable communication capabilities, and comprehensive protection functions. It is widely used in CNC machines, plastic molding equipment, air compressors, hoists, and a variety of industrial automation lines.

However, when the display shows “E.7” or “E.CPU”, the inverter immediately halts output, and the entire system comes to a standstill. This is often referred to by technicians as a “brain crash,” as it indicates a critical failure of the inverter’s central processing unit (CPU).

Among all protection codes, E.7 is one of the most severe. It typically signals that internal communication between control units has failed, logic processes have become unstable, or the CPU hardware itself has malfunctioned.
This article offers a comprehensive technical exploration of the E.7 (CPU Error) fault — its causes, diagnostic methods, hardware implications, repair solutions, and preventive measures — supported by real industrial case studies.


II. Understanding the Fault and System Logic

According to the FR-A700 User Manual (page 397):

E.6 / E.7 / E.CPU – CPU Error
When an internal CPU communication error occurs, the inverter stops output.
Inspection Point: Check if there are devices around the inverter that generate strong electrical noise.
Measure: If no external interference is found, contact the supplier or Mitsubishi service center.

This indicates that E.7 is a system-level protection event.
The inverter’s internal logic continuously monitors communication between the main CPU, gate driver interface, and memory/control buses. If any communication timeout or checksum failure occurs, the CPU triggers a protective shutdown to prevent unpredictable IGBT switching or hardware damage.

The main CPU fault logic in the FR-A700 involves:

  1. Abnormal communication between the main processor and gate drive circuits.
  2. Data corruption or response failure in EEPROM, ADC, or communication ICs.
  3. Watchdog timer reset caused by logic hang or power fluctuation.

When the watchdog detects that the CPU fails to respond within its monitoring period, the system declares a “CPU Communication Error” and displays E.7.


III. Technical Causes of the CPU Error

The E.7 fault generally stems from three major categories of issues:

  1. Electromagnetic interference (EMI)
  2. Power supply instability
  3. Internal control board failure

1. Electromagnetic Interference (EMI)

Industrial sites are rich in high-frequency noise sources — welding machines, large contactors, induction heaters, and switching power supplies. These generate voltage spikes and transient electromagnetic waves that couple into the control board’s circuits, disturbing the CPU clock or data bus.

Typical EMI sources include:

  • Arc welders or high-frequency induction furnaces
  • Contactors or solenoid valves switching nearby
  • Control signal lines routed in parallel with power cables
  • Improper or floating grounding systems

In such cases, E.7 may occur intermittently, often clearing after power cycling — a sign that transient interference is affecting the CPU.

Technical Recommendations:

  • Separate control wiring from power cables (minimum 10 cm apart).
  • Use twisted shielded cables for control and communication lines.
  • Ground all shields at one single point only.
  • Install proper EMI filters and ferrite cores on input lines.

2. Power Supply Fluctuations or Grounding Issues

The FR-A700 series contains multiple voltage rails — DC bus (≈540 VDC), control voltage (24 VDC), and logic voltage (5 VDC).
When any of these experience transient drops due to unstable input voltage, aging capacitors, or poor grounding, the CPU watchdog may trigger an internal reset, leading to an E.7 CPU Error.

Typical symptoms:

  • E.7 appears immediately upon power-up
  • Random alternation between E.6 and E.7
  • Display flickering or panel freezing

Diagnostic Points:

  1. Measure three-phase input balance and verify stable voltage.
  2. Check DC bus voltage ripple — excessive ripple suggests degraded capacitors.
  3. Measure 24V and 5V supply rails; ensure no drop below tolerance.
  4. Inspect the grounding system — avoid shared return paths with external PLCs or IO devices.

3. Hardware Failure on Control or Power Board

If E.7 persists after confirming stable power and minimal EMI, the most likely cause is a hardware fault.

Common hardware-related sources:

  • Damaged main CPU (e.g., Renesas or Mitsubishi custom MCU)
  • Failed EEPROM or memory IC communication
  • Broken optocouplers (HCPL-2631, etc.) between logic and driver circuits
  • Poor connection between control board and power board
  • Feedback interference caused by a shorted IGBT module

Observable signs:

  • Instant E.7 alarm at power-up
  • Unable to reset via panel or RES signal
  • FR-Configurator2 communication fails
  • No clock signal detected on the CPU oscillator

In this situation, replacing the control PCB or even the entire inverter is often the most efficient solution.


IV. Step-by-Step Diagnostic Procedure

A systematic diagnostic process can help quickly isolate the E.7 cause.

Step 1: Record and Observe

  • Note when the error occurs (during start, stop, idle, or communication).
  • Observe whether the fault happens after brief power loss.
  • Check ambient temperature (CPU overheating can cause instability).

Step 2: Insulation and Ground Testing

  • After disconnecting power and waiting at least 10 minutes, measure insulation resistance (>5 MΩ) between main terminals and ground.
  • Ensure no short between control circuits and main circuit.

Step 3: Check for Interference and Grounding Issues

  • Verify that PE grounding resistance is below 10 Ω.
  • Ensure all power cables are symmetrical (balanced three-phase).
  • Avoid “loop grounds” by ensuring star-point grounding topology.
  • For RS-485 or CC-Link communication, ground the shield at one end only.

Step 4: Monitor Power Rails

  • Use an oscilloscope to monitor 24V and 5V supplies; ensure minimal ripple (<100 mV).
  • Confirm the DC bus is steady without oscillation when idle.

Step 5: Module-Level Inspection

  • Re-seat the operation panel and connectors between boards.
  • Examine ribbon cables for oxidation or loose pins.
  • Swap with a known-good control board if available.
  • If error persists → replace power board or complete drive.

V. Repair and Replacement Strategies

1. Component-Level Control Board Repair

Qualified service technicians can:

  • Verify CPU clock oscillator output (16–20 MHz typical).
  • Check watchdog timer pulse (ICs like 74HC123).
  • Replace EEPROM, voltage regulators, or capacitors.
  • Re-solder cracked joints and clean carbon residue.
  • Add low-ESR capacitors (e.g., 47 µF × 2) near CPU power pins to enhance filtering.

2. Inverter Replacement and Parameter Recovery

When the board is irreparable:

  • Use FR-Configurator2 to back up parameters before removing the unit.
  • Install the new inverter, then restore parameters via copy function (Pr.990–Pr.999).
  • Run auto-tuning (Pr.71, Pr.80–Pr.84) to recalibrate motor characteristics.

3. Environmental Hardening

For long-term stability:

  1. Add EMI filters or isolation transformers on input side.
  2. Install surge absorbers (MOVs) between R/S/T lines.
  3. Route control and power cables separately.
  4. Maintain good cabinet ventilation and cleanliness.

VI. Case Study: CPU Error in Injection Molding Machine

An FR-A740-22K-CHT inverter was used as the main drive in a plastic injection molding machine. The unit displayed E.7 intermittently; resetting restored operation temporarily.

Investigation findings:

  • Three inverters were installed side-by-side in the same panel.
  • Control signal cables ran parallel to motor leads.
  • Ground connections were multi-pointed, creating loops.
  • Heavy dust on control board and fan filter.

Corrective actions:

  1. Re-routed control cables with shielded twisted pairs.
  2. Implemented star-point grounding.
  3. Added 100 µF capacitor to 5V rail on control board for ripple suppression.
  4. Cleaned dust and re-seated connectors.

After these measures, the machine ran for 72 hours continuously without reoccurrence.
Conclusion: E.7 was caused by EMI-induced communication loss rather than true CPU failure.


VII. Relationship Between Related Error Codes

CodeDescriptionMeaningCorrelation
E.6CPU Communication Error ACommunication loss in main logic channelOften co-occurs with E.7
E.7CPU Communication Error BInternal bus or logic timing faultMay escalate to E.CPU
E.CPUCPU Hardware FaultCPU self-check failure or watchdog timeoutSevere or persistent E.6/E.7

If E.6, E.7, and E.CPU alternate rapidly, it typically indicates either a logic power fault or crystal oscillator failure.


VIII. Preventive Engineering Practices

1. During Electrical Design

  • Provide dedicated grounding bars (no shared returns).
  • Use separate grounding cables for each inverter.
  • Add RC snubber circuits or line filters on power input.
  • Use crimp terminals for all wiring to prevent loose contacts.

2. During Installation and Commissioning

  • Test motor insulation before wiring to inverter.
  • Avoid long, unshielded communication lines.
  • Use optical isolation modules when interfacing PLCs.

3. During Routine Maintenance

  • Clean cooling channels and fans every 6 months.
  • Check fan bearings and noise levels.
  • Measure DC bus capacitor ESR annually.
  • Use heaters or dehumidifiers in damp environments.

4. Backup and Record Management

  • Regularly back up parameters via FR-Configurator2 or PU unit.
  • After replacing the control board, verify calibration parameters.
  • For aging units, perform preventive replacement of capacitors and relays.

IX. Technical Insights and Summary

The E.7 fault in the Mitsubishi FR-A700 series is a CPU communication error — a high-level protection mechanism that prevents erratic operation when the internal logic loses synchronization.
It does not relate to mechanical load or overcurrent events, but rather to the integrity of digital control.

Based on field experience, E.7 can be categorized into three scenarios:

TypeRoot CauseSolution
IntermittentElectrical noise or unstable powerImprove grounding and filtering
RecurrentLoose connectors, aged componentsMaintenance and board cleaning
PersistentDamaged CPU or control boardReplace control board or full unit

Following the logical troubleshooting flow — external causes → power check → control circuit diagnosis — enables engineers to identify the root problem quickly and avoid unnecessary replacements.

In preventive terms, a robust EMC design and proper grounding layout remain the most effective strategies to eliminate CPU communication errors in high-frequency drive systems.


X. Practical Recommendations

  • For environments with frequent E.7 errors, consider using a 1:1 isolation transformer (2 kVA or above) for the inverter’s control supply.
  • In high-temperature cabinets (>45°C), add external forced-air cooling.
  • For long-distance communication, use optical fiber isolation modules instead of RS-485 copper lines.
  • For multi-inverter systems, use independent control power supplies for each unit.

Conclusion

The E.7 CPU Error is not simply a nuisance fault — it is an intelligent self-protection feature designed to prevent catastrophic failure in the Mitsubishi FR-A700 inverter series.
Understanding its electrical, logical, and environmental causes allows engineers to perform accurate diagnostics, avoid misjudgment, and reduce downtime.

In today’s automation landscape, where system reliability and electromagnetic compatibility (EMC) are paramount, addressing E.7 is not merely about fixing an error — it’s about building resilience into every layer of the control system.

Posted on

User Guide for EST900 Series Inverter from Yiste: A Comprehensive Analysis from Operation to Troubleshooting

The EST900 series inverter from Yiste, as a high-performance vector inverter, is widely applied in the control and speed regulation of three-phase asynchronous motors. This article, based on the official manual, will elaborate in detail on its operation panel functions, parameter setting methods, external terminal control and speed regulation implementation, as well as handling measures for common fault codes, helping users quickly master the usage skills.

I. Introduction to Operation Panel Functions and Parameter Settings

(A) Overview of Operation Panel Functions

The EST900 series inverter comes standard with an LED operation panel, which offers a variety of functions:

  • Status Monitoring: It can display key information such as operating frequency, current, voltage, and fault codes in real time.
  • Parameter Setting: It supports viewing and modifying functional parameters.
  • Operation Control: Control commands such as start, stop, and forward/reverse rotation can be executed through the panel.
  • Indicator Lights: It is equipped with indicator lights including RUN (operation), LOCAL/REMOT (control source), FWD/REV (direction), and TUNE/TC (tuning/torque/fault), which visually reflect the equipment status.

(B) Factory Parameter Settings

During debugging or when parameters are in disarray, a factory reset operation can be performed:

  • Steps:
    • Enter the FP – 01 parameter.
    • Set it to 1 (restore factory parameters, excluding motor parameters).
    • Press the ENTER key to confirm.
    • Wait for the display to restore, indicating parameter initialization is complete.
  • Notes:
    • FP – 01 = 2 can clear fault records and other information.
    • FP – 01 = 4 can back up the current parameters.
    • FP – 01 = 501 can restore the backed-up parameters.

(C) Password Setting and Clearing

To prevent misoperation, a user password can be set:

  • Setting a Password:
    • Enter FP – 00 and set it to a non-zero value (e.g., 1234).
    • After exiting, the password needs to be entered when accessing parameters again.
  • Clearing a Password:
    • Set FP – 00 to 0.

(D) Parameter Access Restrictions

Parameter access can be restricted in the following ways:

  • Parameter Group Display Control:
    • Set the FP – 02 parameter to control whether Group A and Group U parameters are displayed.
    • For example, setting it to “11” can hide some parameter groups to prevent mismodification.
  • Prohibition of Modification during Operation:
    • Some parameters marked with “★” cannot be modified during operation and need to be set after shutdown.

II. External Terminal Forward/Reverse Rotation Control and Potentiometer Speed Regulation

(A) External Terminal Forward/Reverse Rotation Control

  • Wiring Terminals:
    • D11: Forward rotation (FWD)
    • D12: Reverse rotation (REV)
    • COM: Digital input common terminal
  • Parameter Settings:
    | Parameter Code | Name | Setting Value | Description |
    | —- | —- | —- | —- |
    | F0 – 02 | Operation Command Selection | 1 | Terminal control |
    | F4 – 00 | D11 Function Selection | 1 | Forward rotation |
    | F4 – 01 | D12 Function Selection | 2 | Reverse rotation |
    | F4 – 11 | Terminal Command Mode | 0 | Two-wire type 1 |
  • Note: If a three-wire control system is used, set F4 – 11 = 2 or 3 and cooperate with other DI terminals.

(B) External Potentiometer Speed Regulation

  • Wiring Terminals:
    • +10V: Positive pole of potentiometer power supply
    • GND: Negative pole of potentiometer power supply
    • A11: Analog voltage input (0 – 10V)
  • Parameter Settings:
    | Parameter Code | Name | Setting Value | Description |
    | —- | —- | —- | —- |
    | F0 – 03 | Main Frequency Command Selection | 2 | A11 |
    | F4 – 13~F4 – 16 | A11 Curve Settings | Adjust according to actual conditions | Minimum/maximum input corresponds to frequency |
  • Tip: It is recommended that the potentiometer resistance be between 1kΩ and 5kΩ to ensure that the current does not exceed 10mA.

III. Common Fault Codes and Handling Methods

The EST900 series inverter has a comprehensive fault diagnosis function. The following are common faults and their handling methods:

(A) Overcurrent Faults

Fault CodeNamePossible CausesHandling Measures
Err02Acceleration OvercurrentMotor short circuit, too short acceleration timeCheck motor insulation, increase acceleration time
Err03Deceleration OvercurrentShort deceleration time, large load inertiaIncrease deceleration time, install a braking resistor
Err04Constant-speed OvercurrentLoad mutation, mismatched motor parametersCheck the load, perform motor tuning again

(B) Overvoltage Faults

Fault CodeNamePossible CausesHandling Measures
Err05Acceleration OvervoltageHigh input voltage, external force during accelerationCheck power supply voltage, enable overvoltage suppression
Err06Deceleration OvervoltageShort deceleration time, energy feedbackIncrease deceleration time, install a braking unit
Err07Constant-speed OvervoltageExternal force dragging during operationCheck the mechanical system, enable overvoltage suppression

(C) Other Common Faults

Fault CodeNamePossible CausesHandling Measures
Err09Undervoltage FaultLow power supply voltage, rectifier bridge faultCheck the power supply, measure the bus voltage
Err10Inverter OverloadExcessive load, undersized selectionCheck the load, replace with a higher-power inverter
Err11Motor OverloadExcessive motor load, improper protection parameter settingAdjust the F9 – 01 motor overload gain
Err14Module OverheatingPoor heat dissipation, fan faultClean the air duct, replace the fan
Err16Communication FaultWiring error, improper parameter settingCheck the communication line, set FD group parameters

(D) Fault Reset Methods

  • Press the STOP/RESET key on the panel.
  • Set a DI terminal to the “Fault Reset” function (F4 – xx = 9).
  • Write “2000H = 7” through communication.
  • Power off and restart (wait for more than 10 minutes).

IV. Conclusion

The Yiste EST900 series inverter is powerful and flexible in operation, capable of adapting to various industrial scenarios. Through the introduction in this article, users can master the following key contents:

  • Basic usage methods of the operation panel and parameter setting skills.
  • How to control and regulate the speed of the motor using external terminals and a potentiometer.
  • Diagnostic ideas and handling skills for common faults.
  • Effective use of password management and parameter protection mechanisms.
    During actual use, it is recommended that users strictly follow the manual specifications for wiring and parameter setting, and regularly carry out maintenance work to ensure the long-term stable operation of the equipment.
Posted on

In-Depth Analysis and Troubleshooting of Emerson EV2000 Inverter P.oFF Fault

1. Introduction

In industrial automation systems, frequency inverters are the key components for controlling motor speed and torque. The operational stability of an inverter directly determines the reliability of an entire production line. Among numerous industrial drive products, the Emerson EV2000 series is well recognized for its robust performance, precise vector control, and adaptability to a wide range of applications — from pumps and fans to textile machines and conveyors.

However, during field operation or long-term use, some users may encounter a display message reading “P.oFF” on the inverter’s LED panel.
At first glance, this may look like a severe fault such as a power module failure or control board defect.
In reality, “P.oFF” is not a typical fault alarm, but rather a protective shutdown state known as “Undervoltage Lockout (LU).”

This article provides a comprehensive technical analysis of the P.oFF condition in the Emerson EV2000 inverter.
It integrates official documentation, field diagnostic data, and maintenance experience to explain its causes, triggering mechanism, troubleshooting methods, and preventive measures.


2. Technical Definition of P.oFF

According to the official EV2000 User Manual:

“When the DC bus voltage drops below the undervoltage threshold, the inverter outputs a protection signal and displays ‘P.oFF’ on the LED panel.”

This statement reveals the essence of the fault:
P.oFF occurs when the inverter’s internal DC bus voltage (DC link voltage) falls below a safe limit.

Normally, the rectifier circuit inside the EV2000 converts three-phase AC power (380V ±10%) into DC voltage of approximately 540–620 VDC.
When the input power drops, the rectifier is damaged, the DC bus capacitors age, or the braking unit malfunctions, the DC voltage may fall below the predefined undervoltage threshold (around 300 VDC).
At that point, the inverter automatically enters a protective lockout to prevent unstable operation or component damage.

It is important to note that unlike “E” code faults (such as E001 – overcurrent, E002 – overvoltage), P.oFF does not trigger a trip alarm.
Instead, the inverter temporarily disables output until the voltage returns to normal.


3. Electrical Mechanism Behind the P.oFF State

To fully understand this phenomenon, we must look into the EV2000’s main power structure.

3.1 Composition of the Main Circuit

The inverter’s main power path includes the following key components:

  • Input terminals (R, S, T): three-phase AC supply
  • Rectifier bridge module: converts AC to DC
  • DC bus capacitors: stabilize and filter DC voltage
  • Braking unit and resistor: absorb regenerative energy from motor deceleration
  • IGBT inverter bridge: converts DC back into PWM-controlled AC output

3.2 How Undervoltage Lockout Is Triggered

The control board constantly monitors the DC bus voltage.
When it detects a voltage lower than the threshold (typically around 300–320 VDC), it executes the following logic sequence:

  1. Disables IGBT outputs — halting motor operation
  2. Displays “P.oFF” on the panel
  3. Waits in standby mode until the DC bus recovers above the normal level (typically >380 VDC)

This mechanism is a preventive protection system designed to shield the inverter from grid voltage sags, capacitor discharges, or transient faults.
Thus, P.oFF is not an error; it is an intentional safety lock.


4. Root Causes of the P.oFF Condition

From field experience and manual analysis, the following are the most common reasons for P.oFF to appear.

(1) Input Power Problems

  • Voltage imbalance between the three input phases (>3%)
  • Mains voltage below 320V AC or fluctuating severely
  • Loose power terminals or poor contact
  • Excessive line voltage drop due to long cable runs

These account for nearly half of all P.oFF cases and are primarily related to unstable supply power.

(2) Faulty Rectifier Module

A damaged or open diode inside the rectifier bridge reduces the DC bus voltage, often accompanied by audible hum or irregular current flow.

(3) Aged or Leaky DC Capacitors

Over time, electrolytic capacitors lose capacitance and their internal ESR increases.
This weakens their ability to smooth the DC voltage, resulting in a temporary drop when load or braking energy fluctuates — enough to trigger an undervoltage lock.

In units running for 3–5 years, this is one of the most frequent root causes.

(4) Braking Circuit Malfunction

A shorted braking unit or resistor constantly discharges the DC bus, causing the voltage to collapse.
To verify, disconnect the braking circuit and power on again — if P.oFF disappears, the issue lies in that circuit.

(5) Momentary Power Interruptions

Factories with welding machines, compressors, or heavy inductive loads can experience grid sags.
If the inverter’s “Ride-through” (instantaneous power-loss recovery) function is disabled, any short voltage dip may cause P.oFF.


5. Systematic Troubleshooting Process

To effectively diagnose and repair the P.oFF issue, engineers can follow a step-by-step workflow:

Step 1 – Observe the Symptom

  • Panel displays “P.oFF”
  • No “E” fault code is present
  • Motor stops automatically
  • After a few minutes, the inverter may restart on its own

If these conditions match, the inverter is in undervoltage lockout mode.

Step 2 – Measure Input Power

Use a multimeter to measure R–S–T line voltages:

  • Normal range: 380–440 V
  • Below 360 V or phase difference >10 V → adjust power source or connections

Step 3 – Measure DC Bus Voltage

Check voltage across (+) and (–) terminals:

  • Normal: 540–620 VDC
  • Below 300 VDC → rectifier or capacitor failure

Step 4 – Isolate the Braking Circuit

Disconnect the braking resistor/unit and test again.
If the problem disappears, replace or repair the braking components.

Step 5 – Test the DC Capacitors

After power-off, measure capacitance and discharge rate:

  • If voltage drops to zero within a few seconds, leakage is severe
  • Replace if measured capacitance is <70% of rated value

Step 6 – Verify Control Power

Check auxiliary voltages (P24, +10V, +5V).
Low control supply may cause false P.oFF detection.


6. Repair and Recovery Procedures

Once the root cause has been identified, proceed with the following repair actions:

  1. Stabilize Power Supply
    • Re-tighten input terminals
    • Ensure voltage balance across all three phases
    • Install an AC reactor or voltage stabilizer if necessary
  2. Replace Faulty Components
    • Replace aged electrolytic capacitors as a set
    • Replace damaged rectifier modules with same-rated units
  3. Inspect Braking Circuit
    • Measure P–PR resistance for shorts
    • Ensure thermal relay contacts (TH1, TH2) are functioning
  4. Enable Ride-through Function
    The EV2000 allows short-duration undervoltage ride-through; enabling this can prevent false P.oFF triggers caused by brief voltage dips.
  5. Recommission and Verify
    • Power up and observe DC voltage stability
    • Run at light load for 10 minutes, then gradually increase load
    • Once the display shows “RDY”, the inverter is ready for normal operation

7. Preventive and Optimization Measures

To avoid recurring undervoltage lockouts, adopt the following best practices:

7.1 Power-Side Protection

  • Use proper circuit breakers or fuses rated for inverter service
  • Add a DC reactor for harmonic suppression and voltage stabilization
  • Use thicker power cables if installation distance is long

7.2 Environmental Control

  • Maintain cabinet temperature below 40°C
  • Ensure clean airflow; avoid dust, oil, or moisture buildup
  • Regularly clean cooling fans and filters

7.3 Periodic Maintenance

  • Measure DC bus voltage and capacitor health yearly
  • Replace capacitors after ~3 years of continuous operation
  • Test rectifier module every 5 years or after heavy load operation

7.4 Parameter Optimization

  • Set appropriate acceleration/deceleration times to avoid current spikes
  • Enable AVR (Automatic Voltage Regulation) and Current Limit functions
  • Review output terminal settings in parameter group F7 to prevent incorrect logic assignments

8. Case Study: Intermittent P.oFF on a 22kW Fan Drive

Background:
A 22kW EV2000 inverter controlling a centrifugal fan exhibited intermittent P.oFF shutdowns after six months of operation.

Symptoms:

  • Occurred around 45 Hz operation
  • The inverter automatically recovered after a few minutes
  • Mains voltage appeared normal

Diagnosis:

  • DC bus voltage fluctuated between 520–550V with periodic dips
  • Two electrolytic capacitors found bulging and degraded
  • Replaced capacitors → inverter operated normally

Conclusion:
The failure was caused by aged capacitors reducing DC storage capacity, resulting in transient undervoltage.
This is a classic “aging-induced P.oFF” scenario.


9. Conclusion

The P.oFF message on Emerson EV2000 inverters is not a random or critical failure, but a designed protective feature to safeguard the drive system when DC bus voltage drops abnormally.

Understanding its mechanism helps engineers correctly differentiate between true hardware faults and temporary protective lockouts.
By following a structured diagnostic approach — from input power verification to capacitor and braking circuit inspection — technicians can quickly restore normal operation.

Furthermore, implementing preventive maintenance and enabling built-in functions such as ride-through and AVR can significantly enhance long-term reliability.

As the design philosophy of Emerson EV2000 suggests:

“Reliability is not accidental — it begins with every small detail of protection.”

Posted on

Technical Analysis and Troubleshooting of “Zero Airflow” Failure in TSI 9565-P-NB VelociCalc Air Velocity Meter

1. Introduction

The TSI VelociCalc 9565 series multifunction air velocity meters, manufactured by TSI Incorporated (USA), are among the most recognized instruments for ventilation testing and cleanroom airflow diagnostics.
Their modular design allows the main unit to connect to a variety of intelligent probes through a standard 7-pin Mini-DIN interface, enabling simultaneous measurements of air velocity, airflow, temperature, humidity, CO, CO₂, VOC, and differential pressure.

This article focuses on a specific configuration:

  • Main unit: TSI 9565-P-NB, a multifunction meter equipped with a differential-pressure sensor (the “-NB” suffix indicates no Bluetooth).
  • Probe: TSI 964 hot-film probe for air velocity, temperature, and relative humidity.

Together they provide comprehensive readings of velocity, volumetric flow, temperature, humidity, and static/differential pressure, widely used in:

  • Fume-hood face-velocity tests;
  • Cleanroom laminar-flow verification;
  • HVAC air-balancing and commissioning;
  • Energy-efficiency assessments of ventilation systems.

2. Working Principle and Structural Overview

2.1 Hot-film anemometry

The 964 probe employs a constant-temperature hot-film anemometer. Its sensing element is a precision platinum film that is electrically heated above ambient temperature.

  • When air passes over the sensor, convective cooling occurs;
  • The electronic bridge circuit maintains a fixed temperature difference ΔT;
  • The current required to maintain ΔT is proportional to the square of air velocity;
  • The resulting signal is linearized and temperature-compensated to yield the velocity reading (m/s).

The probe also houses a temperature and humidity module, ensuring density compensation and stable performance over a wide range of conditions.

2.2 Differential-pressure module

The 9565-P-NB main unit integrates a ±15 in H₂O (±3735 Pa) differential-pressure sensor.
Through the positive (+) and negative (–) ports, the meter can measure static or differential pressure and compute velocity using a Pitot tube.
Accuracy is specified as ±1 % of reading ±1 Pa.

2.3 Probe-to-main-unit interface

The 7-pin Mini-DIN connector at the base of the instrument provides:

  • +5 VDC power to the probe;
  • Analog signal inputs (velocity, temperature, humidity);
  • A digital line for probe identification and calibration coefficients.

Once connected, the main unit automatically reads the probe’s ID EEPROM, displays its model, and activates relevant measurement menus.
If this recognition fails, the instrument shows “Probe Error” and all velocity-related readings remain at 0.00 m/s.


3. Normal Operation Guidelines

3.1 Power-up and warm-up

According to the manual (Chapter 3), the instrument should warm up for about five minutes after power-on before performing pressure zeroing.
This stabilizes the internal sensors and reference voltages.

3.2 Probe orientation and insertion

  • The orientation dimple on the probe must face upstream.
  • At least 3 in (7.5 cm) of the probe should be exposed to the airflow to ensure that both the temperature and humidity sensors are fully in the airstream.
  • Extend the telescopic rod by pulling on the metal tube, never by the cable, to avoid internal wire breakage.

3.3 Display configuration

In the Display Setup menu, up to five parameters can be shown simultaneously (one primary in large font and four secondary).
Typical configuration:

  • Primary: Flow (L/s or CFM) or Velocity (m/s or fpm)
  • Secondary: Pressure, Temperature, Humidity, Barometric Pressure

Note: “Pitot Velocity” and “AF Probe Velocity” cannot be active at the same time; only one may be ON or set as PRIMARY.


4. Root-Cause Analysis of “Zero Airflow / Zero Velocity” Symptoms

A frequently reported issue is that the display suddenly shows 0.00 m/s velocity and 0.00 L/s flow, while pressure values remain valid.
Based on the manual and field experience, the following causes are most probable.

4.1 Probe recognition failure (most common)

If the main unit cannot read the probe’s EEPROM data, only built-in channels (pressure, temperature, baro) appear, while velocity stays at zero.
The troubleshooting table lists:

Symptom: Probe plugged in, but instrument does not recognize it.
Cause: Probe was inserted while instrument was ON.
Action: Power OFF the unit and turn it ON again.

If the problem persists:

  • Connector pins may be oxidized or bent;
  • The probe ID circuit or EEPROM may be defective.

4.2 Burned or open-circuit hot-film element

Inside the 964 probe, the micro-thin film (<100 µm) can be destroyed by high temperature, moisture, or dust contamination.
Typical signs:

  • The probe model appears correctly in the menu;
  • All velocity readings remain 0.00;
  • No error message displayed.

Measuring resistance between signal pins with a multimeter helps confirm: an open circuit indicates sensor burnout.

4.3 Incorrect measurement setup

If “Velocity” or “Flow” parameters are disabled in the Display Setup, or if Flow is set as PRIMARY without enabling Velocity as a secondary, the display will not show airflow data.

4.4 Cable or connector damage

Frequent bending or improper storage can break internal wires.
Symptoms include intermittent readings when the cable is moved or total loss of signal.

4.5 Faulty probe port on the main unit

When even a known-good probe is not recognized, the main unit’s connector solder joints or signal amplifier may be defective.
The manual specifies: “Factory service required on instrument.”


5. Systematic Troubleshooting Procedure

StepInspectionExpected ResultCorrective Action
Re-plug probe with power offUnit recognizes probe after restartIf normal → software/recognition issue
Check “Probe Info” menuDisplays “964 Probe SN xxxx”If blank → contact/ID circuit fault
Verify Display SetupVelocity = ON, Flow = ONIf still 0 → hardware failure
Swap probeNew probe worksOriginal probe damaged
Measure pin resistanceSeveral hundred–kΩOpen circuit → hot-film burned
Restore factory settings / calibrationReset configurationIf unchanged → return for service

6. Maintenance and Calibration Recommendations

6.1 Routine care

  • Keep probes clean; avoid oily or dusty airflows.
  • After use, gently blow dry air across the sensor head.
  • Store in a dry environment, away from direct sunlight.
  • Remove batteries during long-term storage to prevent leakage.

6.2 Calibration interval

TSI recommends annual factory calibration to maintain traceable accuracy.
Field calibration via the CALIBRATION menu is possible but only for minor adjustments; full calibration must be performed by TSI or an authorized lab.

6.3 Typical calibration specifications

ParameterRangeAccuracy
Velocity0 – 50 m/s±3 % of reading or ±0.015 m/s
Temperature–10 – 60 °C±0.3 °C
Relative Humidity5 – 95 % RH±3 % RH
Differential Pressure±3735 Pa±1 % of reading ± 1 Pa

7. Mechanism of Hot-film Probe Failure

Hot-film velocity sensors are extremely sensitive and delicate.
Typical failure mechanisms include:

  1. Burnout of heating element — due to transient over-current or contact bounce;
  2. Surface contamination — dust or oil alters thermal transfer, causing drift;
  3. Condensation — moisture films short or isolate the element;
  4. Cable fatigue — repeated bending leads to conductor breakage.

Failures 1 and 4 are the primary causes of complete loss of velocity signal (“0 m/s”).
During repair, check:

  • Continuity between connector pins and the sensor head;
  • Visual inspection for dark or cracked sensing film;
  • Cross-test using another known-good probe.

8. Case Study: Field Repair Example

Background

A laboratory used a TSI 9565-P-NB + 964 probe to measure fume-hood airflow.
After about three years of service, the display suddenly showed:

Pressure fluctuating normally, but velocity = 0.00 m/s and flow = 0.00 L/s.

Diagnosis

  1. Probe information visible → communication OK.
  2. Re-plugging did not help.
  3. Sensor head inspection revealed blackened film.
  4. Pin resistance = open circuit.

Resolution

  • Replaced the 964 probe with a new one.
  • Instrument operated normally.
  • Post-calibration deviation < 1.8 %.

Conclusion: The zero-airflow symptom was caused by an open-circuit hot-film element.


9. Using Differential-Pressure Mode as Backup

Even when the velocity probe fails, the 9565-P-NB can still measure airflow via Pitot tube + pressure ports:

  • Connect Pitot total pressure to “+” port and static pressure to “–”;
  • Select Flow Setup → Pressure/K-factor and input duct dimensions;
  • The instrument converts ΔP to velocity using standard equations.

This method provides a temporary substitute for velocity readings until the probe is repaired.


10. Safety and Usage Notes

  • Avoid electrical hazards: never use near live high-voltage sources.
  • Do not open the case: user disassembly voids warranty.
  • Operating limits:
    • Main unit: 5 – 45 °C
    • Probe: –10 – 60 °C
  • Maximum overpressure: 7 psi (48 kPa); exceeding this may rupture the pressure sensor.

11. Conclusion

The TSI 9565-P-NB VelociCalc is a high-precision, versatile instrument integrating differential-pressure, velocity, and humidity measurements in one compact platform.
However, in practical field use, the common “airflow = 0” fault is rarely caused by the main unit.
Instead, it almost always results from probe recognition failure or hot-film sensor damage.

Adhering to proper operating procedures—power-off insertion, warm-up before zeroing, periodic cleaning, and annual calibration—greatly extends probe life and maintains accuracy.

For maintenance engineers, understanding the signal flow and failure signatures enables quick fault localization and minimizes downtime.
For facility managers, implementing a calibration and maintenance log ensures data reliability for HVAC system validation.

Posted on

🔧 Chmairss VGS30A Air Compressor — VEMC Inverter “Err14” Fault Analysis and Repair Guide


From Overheated IGBT Modules to Full System Recovery


1. Introduction

In modern screw air compressors, the variable frequency drive (VFD) is the core component responsible for controlling motor speed and optimizing power consumption.
The Chmairss VGS30A compressor, equipped with a 22 kW VEMC inverter, uses variable-speed control to maintain constant discharge pressure while achieving high energy efficiency.

However, after long-term operation, one of the most common issues that field engineers encounter is the “Err14 – Module Overheat” fault on the VEMC inverter.
This error not only causes system shutdown but also indicates potential thermal imbalance or hardware degradation inside the inverter.

This article provides a comprehensive technical explanation and a complete repair workflow — from understanding the root cause of Err14, diagnosing the issue step-by-step, to repairing and preventing future failures. It is based on real-world field data from a VGS30A compressor maintenance case.


2. Fault Symptoms and Display Information

(1) On the Main Control Panel (HMI)

The compressor controller repeatedly shows the following message:

STATE: MOTOR INV FAULT
CODE: 00014

Multiple entries appear in the fault history list (024–028), all labeled “MOTOR INV FAULT.”

(2) On the VEMC Inverter Panel

The inverter LED display reads:

Err14

The red alarm indicator is on, and the motor cannot start.
Once the contactor closes, the inverter trips immediately.

(3) PLC and System Reaction

The PLC detects the inverter fault signal and sends a stop command to the entire compressor.
Frequency display freezes at 0.0 Hz, power output shows 0.0 kW, and total run time stops accumulating.


3. Understanding the “Err14” Code — Module Overheat Fault

According to VEMC documentation:

Err14 = Module Overheat Fault (IGBT Overtemperature)

The inverter continuously monitors the IGBT module temperature via an NTC thermistor attached to the power module.
This analog signal is converted to a voltage and fed to the control CPU through an A/D converter.

  • Normal temperature range: 25 °C – 75 °C
  • Warning level: ~85 °C
  • Trip threshold: ~95 °C

If the module temperature exceeds the limit or the temperature signal becomes abnormal (open circuit, short circuit, or unrealistic value), the inverter will immediately shut down to protect the IGBT module. The control CPU disables PWM output and reports Err14.


4. Common Root Causes of Err14

Based on maintenance experience and field diagnostics, there are five main categories of causes for Err14:

CategoryCauseDescription
🌀 Cooling failureFan blocked or not runningDust, oil mist, or worn bearings stop the fan, reducing heat dissipation efficiency.
🌡️ Ambient overheatingPoor cabinet ventilationWhen internal cabinet temperature exceeds 45 °C, the module’s junction temperature rises quickly.
🔌 NTC thermistor faultBroken, oxidized, or loose sensorThe temperature signal becomes unstable or reads as “overheated” even at normal temperature.
IGBT module damageAging or partial short circuitLocalized overheating triggers overtemperature alarm even under light load.
🧭 Control board errorFaulty sampling or amplifier circuitA/D converter malfunction misreads temperature as extreme value, causing false alarm.

5. Step-by-Step Diagnostic Procedure

Step 1 – Inspect the Cooling Fan and Air Duct

  1. Power on the inverter and check whether the internal cooling fan starts automatically.
  2. If the fan does not spin, measure the voltage at the fan terminals (usually DC 12 V or DC 24 V).
    • Voltage present but fan not spinning → fan motor failure.
    • No voltage → main control board output failure.
  3. Clean the air duct, dust filter, and heat-sink fins thoroughly.

Step 2 – Check Cabinet Temperature

  • Use an infrared thermometer to measure temperature inside the control cabinet.
  • If it exceeds 45 °C, install additional exhaust fans or ventilation openings.
  • Avoid placing the cabinet near heat sources (e.g., compressor discharge pipe).

Step 3 – Test the NTC Thermistor

  1. Power off and wait at least 10 minutes for discharge.
  2. Remove the drive or power board.
  3. Measure resistance between NTC terminals (typically around 10 kΩ at 25 °C).
  4. Heat the sensor slightly with a hot-air gun — the resistance should decrease with rising temperature.
  5. If resistance is fixed or open circuit → replace the thermistor.

Step 4 – Check the IGBT Power Module

  1. Use a multimeter diode-test function to check each phase (U, V, W) to positive/negative bus.
  2. Any shorted or low-resistance reading (< 0.3 Ω) indicates IGBT damage.
  3. Verify that the power module is tightly clamped to the heat sink.
  4. Reapply high-quality thermal grease (e.g., Dow Corning 340) if dried or cracked.

Step 5 – Check the Control Board Temperature Circuit

If all above components are normal but Err14 remains:

  • Inspect connector pins (often CN6 or CN8) for oxidation or loose contact.
  • Use an oscilloscope to observe temperature signal voltage (should decrease gradually as temperature rises).
  • Constant 0 V or 5 V output → indicates A/D converter or amplifier failure.
  • Replace the entire driver/control board if signal circuit is defective.

6. Case Study — Actual Field Repair of a VGS30A Compressor

Equipment details:

  • Model: Chmairss VGS30A
  • Inverter: VEMC 22 kW
  • Total runtime: 7 303 hours
  • Ambient temperature: ~38 °C
  • Fault: Err14 appears within seconds after startup; fan not rotating

Inspection and Findings

ComponentResultAction Taken
Cooling fan power24 V output normalFan motor seized → replaced
Air ductHeavy dust accumulationCleaned thoroughly
Thermistor9.7 kΩ at 25 °COK
IGBT moduleAll phases normalOK
Thermal greaseCompletely driedReapplied new grease
Control boardNo oxidation or damageOK

After cleaning and replacing the fan, the inverter started normally.
After 30 minutes of continuous operation, module temperature stabilized at 58 °C, confirming successful repair.


7. Electrical and Thermal Theory Behind Err14

(1) Power Loss and Junction Temperature

The IGBT’s heat generation consists of conduction and switching losses:
[
P_{loss} = V_{CE} \times I_C + \tfrac{1}{2}V_{CE} I_C f_{sw} (t_{on}+t_{off})
]
If heat cannot be transferred efficiently to the heat sink, junction temperature (Tj) rises sharply, increasing conduction loss — a positive feedback that can lead to thermal runaway and module destruction.

(2) Importance of Thermal Interface

The thermal resistance (Rθjc) between IGBT and heat sink determines how quickly heat is removed.
Dried or aged thermal compound increases resistance several times, leading to localized hot spots even when load current is normal.

(3) Protection Logic Inside VEMC Drive

The inverter CPU continuously samples the temperature signal:

  • Below 0.45 V (≈ 95 °C): trigger Err14 and shut down PWM output.
  • Above 0.55 V (≈ 85 °C): allow reset condition.
  • Open circuit: immediate fault lockout, manual reset required.

8. Preventive Maintenance Recommendations

TaskFrequencyRecommended Action
Clean cooling fan and ductEvery 3 monthsUse compressed air to remove dust and oil residue.
Replace thermal greaseEvery 12 monthsApply fresh silicone-based compound between IGBT and heat sink.
Check ambient temperatureContinuousEnsure cabinet stays below 40 °C.
Tighten wiring terminalsEvery 6 monthsPrevent loose or oxidized connections.
Record temperature logEach serviceDocument operating temperature trend.
Inspect power moduleUpon abnormal faultUse thermal camera to detect uneven heating.

Regular maintenance can extend inverter lifetime by 30–50 %, reduce downtime, and prevent expensive module failures.


9. Temporary Reset for Diagnostic Verification

If you suspect a false alarm:

  1. Power off and wait at least 10 minutes for cooling.
  2. Power on and press STOP/RESET.
  3. If Err14 reappears immediately → likely sensor or circuit fault.
  4. If it occurs after several minutes of operation → genuine overheating issue.

10. Troubleshooting Flow (Text Version)

Err14 Detected →
   ↓
Check Cooling Fan Running?
   ├─ No → Measure fan supply → replace fan if needed
   └─ Yes →
         ↓
Is Ambient Temperature >45°C?
         ├─ Yes → Improve ventilation
         └─ No →
               ↓
Measure NTC Thermistor Resistance
               ├─ Abnormal → Replace NTC
               └─ Normal →
                     ↓
Inspect IGBT Module & Thermal Grease
                     ├─ Abnormal → Reapply grease / replace module
                     └─ Normal →
                           ↓
Replace Driver Board (temperature circuit failure)

11. Practical Notes and Safety Reminders

  • Always discharge DC bus capacitors before touching power terminals (wait >10 minutes).
  • When replacing thermal grease, ensure no air gaps between module and heat sink.
  • If replacing the IGBT module, apply torque evenly and use original insulation pads.
  • Keep cabinet filters clean and avoid placing the compressor near exhaust heat or walls.
  • Use infrared thermometer to monitor heat sink temperature during first startup after repair.

12. Lessons Learned

This case of the Chmairss VGS30A compressor with VEMC inverter Err14 demonstrates the critical role of thermal management in power electronics.
Although the message “Module Overheat” seems simple, it reflects a complex interaction between cooling airflow, thermal interface condition, and signal detection circuits.

Field statistics show:

  • About 70 % of Err14 faults are resolved by cleaning the cooling path, replacing fans, or re-greasing the module.
  • The remaining 30 % involve circuit faults or component failures (NTC or driver board).

Understanding these mechanisms allows engineers to diagnose quickly, repair efficiently, and reduce costly downtime.


13. Conclusion

The Err14 (Module Overheat) fault is not merely an alarm — it is the inverter’s self-protection mechanism preventing irreversible IGBT damage.
Proper analysis requires both electrical and thermal reasoning.
By following the structured diagnostic steps in this guide — inspecting the fan, air duct, thermistor, power module, and control board — maintenance engineers can isolate the root cause systematically.

Regular preventive maintenance, good ventilation, and periodic internal cleaning are the best strategies to ensure long-term reliability of VEMC inverters in air compressor applications.


Posted on

Optimization and Troubleshooting of the WZZ-3 Automatic Polarimeter in Crude Starch Content Determination

1. Introduction

Polarimeters are widely used analytical instruments in the food, pharmaceutical, and chemical industries. Their operation is based on the optical rotation of plane-polarized light when it passes through optically active substances. Starch, a fundamental carbohydrate in agricultural and food processing, plays a crucial role in quality control, formulation, and trade evaluation.
Compared with chemical titration or enzymatic assays, the polarimetric method offers advantages such as simplicity, high precision, and good repeatability — making it a preferred technique in many grain and food laboratories.

The WZZ-3 Automatic Polarimeter is one of the most commonly used models in domestic laboratories. It provides automatic calculation, digital display, and multiple measurement modes, and is frequently employed in starch, sugar, and pharmaceutical analyses.
However, in shared laboratory environments with multiple users, problems such as slow measurement response, unstable readings, and inconsistent zero points often occur. These issues reduce measurement efficiency and reliability.

This paper presents a systematic technical discussion on the WZZ-3 polarimeter’s performance in crude starch content measurement, analyzing its optical principles, operational settings, sample preparation, common errors, and optimization strategies, to improve measurement speed and precision for third-party laboratories.


2. Working Principle and Structure of the WZZ-3 Polarimeter

2.1 Optical Measurement Principle

The fundamental principle of polarimetry states that when plane-polarized light passes through an optically active substance, the plane of polarization rotates by an angle α, known as the angle of optical rotation.
The relationship among the angle of rotation, specific rotation, concentration, and path length is expressed by:

[
\alpha = [\alpha]_{T}^{\lambda} \cdot l \cdot c
]

Where:

  • ([\alpha]_{T}^{\lambda}) — specific rotation at wavelength λ and temperature T
  • (l) — optical path length (dm)
  • (c) — concentration of the solution (g/mL)

The WZZ-3 employs monochromatic light at 589.44 nm (sodium D-line). The light passes sequentially through a polarizer, sample tube, and analyzer. The instrument’s microprocessor system then detects the angle change using a photoelectric detector and automatically calculates and displays the result digitally.


2.2 System Composition

ModuleFunction
Light SourceSodium lamp or high-brightness LED for stable monochromatic light
Polarization SystemGenerates and analyzes plane-polarized light
Sample CompartmentHolds 100 mm or 200 mm sample tubes; sealed against dust and moisture
Photoelectric DetectionConverts light signal changes into electrical data
Control & Display UnitMicrocontroller computes α, [α], concentration, or sugar degree
Keypad and LCDAllows mode selection, numeric input, and measurement display

The internal control logic performs automatic compensation, temperature correction (if enabled), and digital averaging, ensuring stable readings even under fluctuating light conditions.


3. Principle and Workflow of Crude Starch Determination

3.1 Measurement Principle

Crude starch samples, after proper liquefaction and clarification, display a distinct right-handed optical rotation. The optical rotation angle (α) is directly proportional to the starch concentration.
By measuring α and applying a standard curve or calculation formula, the starch content can be determined precisely. The clarity and stability of the solution directly affect both response speed and measurement accuracy.

3.2 Sample Preparation Procedure

  1. Gelatinization and Enzymatic Hydrolysis
    Mix the sample with distilled water and heat to 85–90 °C until completely gelatinized.
    Add α-amylase for liquefaction and then glucoamylase for saccharification at 55–60 °C until the solution becomes clear.
  2. Clarification and Filtration
    Add Carrez I and II reagents to remove proteins and impurities. After standing or centrifugation, filter the supernatant through a 0.45 µm membrane.
  3. Temperature Equilibration and Dilution
    Cool the filtrate to 20 °C, ensuring the same temperature as the instrument environment. Dilute to the calibration mark.
  4. Measurement
    • Use distilled water as a blank for zeroing.
    • Fill the tube completely (preferably 100 mm optical path) and remove all air bubbles.
    • Record the optical rotation α.
    • If the rotation angle exceeds the measurable range, shorten the path or dilute the sample.

4. Common Problems and Causes of Slow Response in WZZ-3

During routine use, several factors can cause the WZZ-3 polarimeter to exhibit delayed readings or unstable results.

4.1 Misconfigured Instrument Parameters

When multiple operators use the same instrument, settings are frequently modified unintentionally.
Typical parameter issues include:

SettingCorrect ValueIncorrect Setting & Effect
Measurement ModeOptical RotationChanged to “Sugar” or “Concentration” — causes unnecessary calculation delay
Averaging Count (N)1Set to 6 or higher — multiple averaging cycles delay output
Time Constant / FilterShort / OffSet to “Long” — slow signal processing
Temperature ControlOff / 20 °CLeft “On” — instrument waits for thermal stability
Tube Length (L)Actual tube length (1 dm or 2 dm)Mismatch — optical signal weakens, measurement extended

These misconfigurations are the most frequent cause of slow response.


4.2 Low Transmittance of Sample Solution

If the sample is cloudy or contains suspended solids, the transmitted light intensity decreases. The system compensates by extending the integration time to improve the signal-to-noise ratio, resulting in a sluggish display.
When transmittance drops below 10%, the detector may fail to lock onto the signal.


4.3 Temperature Gradient or Condensation

A temperature difference between the sample and the optical system can cause condensation or fogging on the sample tube surface, scattering the light path.
The displayed value drifts gradually until equilibrium is reached, appearing as “slow convergence.”


4.4 Aging Light Source or Contaminated Optics

Sodium lamps or optical windows degrade over time, lowering light intensity and forcing the system to prolong measurement cycles.
Symptoms include delayed zeroing, dim display, or low-intensity readings even with clear samples.


4.5 Communication and Software Averaging

If connected to a PC with data logging enabled (e.g., 5 s sampling intervals or moving average), both display and response speed are limited by software settings. This is often mistaken for hardware delay.


5. Standardized Parameter Settings and Optimization Strategy

5.1 Recommended Standard Configuration

ParameterRecommended SettingNote
Measurement ModeOptical RotationDirect α measurement
Tube LengthMatch actual tube (1 dm or 2 dm)Prevent calculation mismatch
Averaging Count (N)1Fastest response
Filter / SmoothingOffReal-time display
Time ConstantShort or AutoMinimizes integration time
Temperature ControlOffFor room-temperature samples
Wavelength589.44 nmSodium D-line
Output ModeContinuous / Real-timeAvoid print delay
GainAutoOptimal signal balance

These baseline parameters restore the instrument’s “instant response” behavior.


5.2 Operational Workflow

  1. Blank Calibration
    • Fill the tube with distilled water.
    • Press “Zero.” The display should return to 0.000° within seconds.
    • If slow, inspect optical or parameter issues.
  2. Sample Measurement
    • Load the prepared starch solution.
    • The optical rotation should stabilize within 3–5 seconds.
    • Larger delays indicate improper sample or configuration.
  3. Data Recording
    • Take three consecutive readings.
    • Acceptable repeatability: standard deviation < 0.01°.
    • Calculate starch concentration via calibration curve.
  4. Post-Measurement Maintenance
    • Rinse the tube with distilled water.
    • Perform “factory reset” weekly.
    • Inspect lamp intensity and optical cleanliness quarterly.

6. Laboratory Management Under Multi-User Conditions

When multiple technicians share the same WZZ-3 polarimeter, management and configuration control are crucial to maintaining consistency.

6.1 Establish a “Standard Mode Lock”

Some models support saving user profiles. Save the optimal configuration as “Standard Mode” for automatic startup recall.
If unavailable, post a laminated parameter checklist near the instrument.

6.2 Access Control and Permissions

Lock or password-protect “System Settings.”
Only administrators may adjust system parameters, while general users perform only zeroing and measurement.

6.3 Routine Calibration and Verification

  • Use a standard sucrose solution (26 g/100 mL, α = +13.333° per 100 mm) weekly to verify precision.
  • If the response exceeds 10 s or deviates beyond tolerance, inspect light intensity and alignment.

6.4 Operation Log and Traceability

Maintain a Polarimeter Usage Log recording:

  • Operator name
  • Mode and settings
  • Sample ID
  • Response time and remarks

This allows quick identification of anomalies and operator training needs.

6.5 Staff Training and Certification

Regularly train all users on:

  • Correct zeroing and measurement steps
  • Prohibited actions (e.g., altering integration constants)
  • Reporting of slow or unstable readings

Such standardization minimizes human error and prolongs equipment life.


7. Case Study: Diagnosing Slow Measurement Response

A food processing laboratory reported a sudden increase in measurement time — from 3 s to 15–30 s per sample.

Investigation Findings:

  1. Mode = Optical Rotation (correct).
  2. Averaging Count (N) = 6; “Smoothing” = ON.
  3. Sample solution slightly turbid and contained micro-bubbles.
  4. Temperature control enabled but sample not equilibrated.

Corrective Measures:

  • Reset N to 1 and disable smoothing.
  • Filter and degas the sample solution.
  • Turn off temperature control or match temperature to ambient.

Result:
Response time returned to 4 s, with excellent repeatability.

Conclusion:
Measurement delay often stems from combined human and sample factors. Once parameters and preparation are standardized, the WZZ-3 performs rapidly and reliably.


8. Maintenance and Long-Term Stability

Long-term accuracy requires regular optical and mechanical maintenance.

Maintenance ItemFrequencyDescription
Optical Window CleaningMonthlyWipe with lint-free cloth and anhydrous ethanol
Light Source InspectionEvery 1,000 hReplace aging sodium lamp
Environmental ConditionsAlwaysKeep in stable 20 ± 2 °C lab with minimal vibration
Power SupplyAlwaysUse independent voltage stabilizer
CalibrationSemi-annuallyVerify with standard sucrose solution

By adhering to this preventive maintenance schedule, the WZZ-3 maintains long-term reliability and reproducibility.


9. Discussion and Recommendations

The WZZ-3 polarimeter’s digital architecture provides high precision but is sensitive to user settings and sample clarity.
Slow responses, unstable zeroing, or delayed results are rarely caused by hardware faults — they are almost always traceable to:

  1. Averaging or smoothing functions enabled;
  2. Temperature stabilization waiting loop;
  3. Cloudy or bubble-containing samples;
  4. Aging optical components.

To prevent recurrence:

  • Always restore “fast response” configuration before measurement.
  • Use filtered, degassed, and temperature-equilibrated samples.
  • Regularly calibrate with sucrose standards.
  • Document all measurements and configuration changes.

Proper user discipline, combined with parameter locking and preventive maintenance, ensures the WZZ-3’s continued performance.


10. Conclusion

The WZZ-3 Automatic Polarimeter is a reliable and efficient instrument for crude starch content analysis when properly configured and maintained.
In multi-user laboratories, incorrect parameter settings — especially averaging, smoothing, and temperature control — are the primary causes of slow or unstable readings.

By implementing the following practices:

  • Standardize instrument settings,
  • Match optical path length to actual sample tubes,
  • Maintain sample clarity and temperature equilibrium,
  • Enforce configuration management and operator training,

laboratories can restore fast, accurate, and reproducible measurement performance.

Furthermore, establishing a calibration and documentation system ensures long-term stability and compliance with analytical quality standards.


Posted on

Precisa Moisture Analyzer XM120-HR User Manual: In-Depth Usage Guide

I. Product Overview and Technical Advantages

The Precisa XM120-HR Moisture Analyzer is designed based on the thermogravimetric principle, specifically tailored for rapid determination of moisture content in powder and liquid samples within laboratory and industrial environments. Its notable technical advantages include:

  • High-Precision Weighing Technology: Maximum weighing capacity of 124g with a resolution of 0.001g (0.0001g in HR mode), complying with international standards.
  • Intelligent Drying Control: Supports a three-stage heating program (standard/fast/gentle modes) with a temperature range of 30°C–230°C and customizable drying endpoint conditions.
  • Data Management Functionality: Built-in storage for 50 methods and 999 measurement records, supporting batch data management and adhering to GLP (Good Laboratory Practice) standards.
  • User-Friendly Design: Features a 7-inch touchscreen, multilingual interface (including Chinese), and an RS232 port for remote control and data export.

II. Device Installation and Initial Configuration

  1. Unpacking and Assembly
    • Component List: Main unit, power cord, windshield (1 piece), sample pan holder (2 pieces), sample tweezers (3 pieces), and 80 aluminum sample pans.
    • Assembly Steps:
      • Embed the windshield smoothly into the top slot of the main unit.
      • Install the sample pan holder and rotate to lock it in place.
      • Insert the sample tweezers, ensuring they are secure.
  2. Environmental Requirements
    • Location Selection: Place on a level, vibration-free surface with an ambient temperature of 5°C–40°C and humidity of 25%–85% (non-condensing).
    • Power Connection: Use only the original power cord and ensure reliable grounding. Confirm voltage compatibility for 230V and 115V versions; modifications are prohibited.
  3. Initial Calibration and Leveling
    • Leveling: Adjust the feet at the bottom to center the level bubble. Recalibrate after each device relocation.
    • Weight Calibration:
      • Enter the menu and select “External Calibration” mode. Place a 100g standard weight (accuracy ≤0.001g).
      • Save the data as prompted and verify the error after calibration.

III. Detailed Operation Procedures

  1. Sample Preparation and Measurement
    • Sample Handling:
      • Solid Samples: Grind into a uniform powder and spread evenly on the sample pan (thickness ≤3mm).
      • Liquid Samples: Use glass fiber pads to prevent splashing.
    • Starting Measurement:
      • Press the 《TARE》 button to zero the scale, place the sample, and close the windshield.
      • Select a preset method or customize parameters, then press 《START》 to initiate.
  2. Drying Program Setup
    • Multi-Stage Heating:
      • Stage I (Default): 105°C standard mode for 3 minutes, targeting 75% moisture removal.
      • Stages II/III: Activate higher temperatures or extend durations for difficult-to-volatilize samples.
    • Stopping Conditions:
      • Automatic Stop: When the weight change rate falls below the set value.
      • Time Stop: Maximum drying time limit.
      • AdaptStop: Intelligently determines the drying endpoint to avoid overheating.
  3. Data Recording and Export
    • Batch Processing: Create batches and automatically number samples.
    • Printing Reports: Output complete reports using the 《PRINT》 button.
    • RS232 Transmission: Connect to a computer and send the “PRT” command to export raw data.

IV. Advanced Functions and Maintenance

  1. Temperature Calibration
    • Calibration Tools: Use an optional temperature sensor (Model 350-8585), insert it into the sample chamber, and connect via RS232.
    • Steps:
      • Calibrate at 100°C and 160°C, inputting the actual measured values.
      • Save the data, and the system will automatically correct temperature deviations.
  2. Software Upgrade
    • Download the update tool from the Precisa website, connect to a PC using a data cable (RJ45-DB9), and follow the prompts to complete the firmware upgrade.
  3. Daily Maintenance
    • Cleaning: Wipe the sample chamber weekly with a soft cloth, avoiding contact with solvents on electronic components.
    • Troubleshooting:
      • Display “OL”: Overload, check sample weight.
      • Printing garbled text: Verify interface settings.
      • Heating abnormalities: Replace the fuse.

V. Safety Precautions

  • Do not analyze flammable or explosive samples, such as ethanol or acetone.
  • Avoid direct contact with the heating unit (which can reach 230°C) during the drying process; use sample tweezers for operation.
  • Disconnect the power when not in use for extended periods, store in a dry environment, and retain the original packaging.

Conclusion

The Precisa XM120-HR Moisture Analyzer significantly enhances the efficiency and reliability of moisture detection through its modular design and intelligent algorithms. Users must fully grasp the calibration, program settings, and maintenance points outlined in this manual to maximize device performance. For special samples, refer to the relevant techniques in the manual and optimize parameters through preliminary experiments.

Posted on

Reichert AR360 Auto Refractor: In-Depth Technical Analysis and Operation Guide

I. Product Overview and Technical Background

The Reichert AR360 Auto Refractor, developed by Reichert Ophthalmic Instruments (a subsidiary of Leica Microsystems), represents a cutting-edge electronic refraction device that embodies the technological advancements of the early 21st century in automated optometry. This device incorporates innovative image processing technology and an automatic alignment system, revolutionizing the traditional optometry process that previously required manual adjustments of control rods and chin rests.

The core technological advantage of the AR360 lies in its “hands-free” automatic alignment system. When a patient focuses on a fixed target and rests their forehead against the forehead support, the device automatically identifies the eye position and aligns with the corneal vertex. This breakthrough design not only enhances measurement efficiency (with a single measurement taking only a few seconds) but also significantly improves patient comfort, making it particularly suitable for children, the elderly, and patients with special needs.

As a professional-grade ophthalmic diagnostic device, the AR360 offers a comprehensive measurement range:

  • Sphere: -18.00D to +18.00D (adjustable step sizes of 0.01D/0.12D/0.25D)
  • Cylinder: 0 to 10.00D
  • Axis: 0-180 degrees
    It caters to the full spectrum of refractive error detection, from mild to severe cases.

II. Device Composition and Functional Module Analysis

2.1 Hardware System Architecture

The AR360 features a modular design with the following core components:

Optical Measurement System:

  • Optical path comprising an infrared light source and imaging sensor
  • Built-in self-calibration program (automatically executed upon power-on and after each measurement)
  • Patient observation window with a diameter of 45mm, featuring a built-in green fixation target

Mechanical Positioning System:

  • Translating headrest assembly (integrated L/R detector)
  • Automatic alignment mechanism (accuracy ±0.1mm)
  • Transport locking device (protects internal precision components)

Electronic Control System:

  • Main control board (with ESD electrostatic protection circuitry)
  • PC card upgrade slot (supports remote software updates)
  • RS-232C communication interface (adjustable baud rate from 2400 to 19200)

Human-Machine Interface:

  • 5.6-inch LCD operation screen (adjustable contrast)
  • 6-key membrane control panel
  • Thermal printer (printing speed of 2 lines per second)

2.2 Innovative Functional Features

Compared to contemporary competitors, the AR360 boasts several technological innovations:

  • Smart Measurement Modes: Supports single measurement, 3-average, and 5-average modes to effectively reduce random errors.
  • Vertex Distance Compensation: Offers six preset values (0.0/12.0/13.5/13.75/15.0/16.5mm) to accommodate different frame types.
  • Data Visualization Output: Capable of printing six types of refractive graphs (including emmetropia, myopia, hyperopia, mixed astigmatism, etc.).
  • Multilingual Support: Built-in with six operational interface languages, including English, French, and German.

III. Comprehensive Device Operation Guide

3.1 Initial Setup and Calibration

Unboxing Procedure:

  • Remove the accessory tray (containing power cord, dust cover, printing paper, etc.)
  • Release the transport lock (using the provided screwdriver, turn counterclockwise 6 times)
  • Connect to power (note voltage specifications: 110V/230V)
  • Perform power-on self-test (approximately 30 seconds)

Basic Parameter Configuration:
Through the MODE→SETUP menu, configure:

  • Refractive power step size (0.01/0.12/0.25D)
  • Cylinder display format (negative/positive/mixed cylinder)
  • Automatic measurement switch (recommended to enable)
  • Sleep time (auto-hibernation after 5-90 minutes of inactivity)

3.2 Standard Measurement Procedure

Step-by-Step Instructions:

Patient Preparation:

  • Adjust seat height to ensure the patient is at eye level with the device.
  • Instruct the patient to remove glasses/contact lenses.
  • Explain the fixation target observation instructions.

Right Eye Measurement:

  • Slide the headrest to the right position.
  • Guide the patient to press their forehead firmly against the forehead support.
  • The system automatically completes alignment and measurement (approximately 3-5 seconds).
  • A “beep” sound indicates measurement completion.

Left Eye Measurement:

  • Slide the headrest to the left position and repeat the procedure.
  • Data is automatically associated and stored with the right eye measurement.

Data Management:

  • Use the REVIEW menu to view detailed data.
  • Press the PRINT key to output a report (supports图文混合 printing, i.e., a combination of graphics and text).
  • Press CLEAR DATA to erase current measurement values.

3.3 Handling Special Scenarios

Common Problem Solutions:

Low Confidence Readings: May result from patient blinking or movement. Suggestions:

  • Have the patient blink fully to moisten the cornea.
  • Use tape to temporarily lift a drooping eyelid.
  • Adjust head position to keep eyelashes out of the optical path.

Persistent Alignment Failures:

  • Check the cleanliness of the observation window.
  • Verify ambient lighting (avoid direct strong light).
  • Restart the device to reset the system.

IV. Clinical Data Interpretation and Quality Control

4.1 Measurement Data Analysis

A typical printed report includes:

[Ref] Vertex = 13.75 mmSph   Cyl    Ax-2.25 -1.50  10-2.25 -1.50  10-2.25 -1.50  10Avg  -2.25 -1.50  10

Parameter Explanation:

  • Sph (Sphere): Negative values indicate myopia; positive values indicate hyperopia.
  • Cyl (Cylinder): Represents astigmatism power (axis determined by the Ax value).
  • Vertex Distance: A critical parameter affecting the effective power of the lens.

4.2 Device Accuracy Verification

The AR360 ensures data reliability through a “triple verification mechanism”:

  • Hardware-Level: Automatic optical calibration after each measurement.
  • Algorithm-Level: Exclusion of outliers (automatically flags values with a standard deviation >0.5D).
  • Operational-Level: Support for multiple measurement averaging modes.

Clinical verification data indicates:

  • Sphere Repeatability: ±0.12D (95% confidence interval)
  • Cylinder Axis Repeatability: ±5 degrees
    Meets ISO-9001 medical device certification requirements.

V. Maintenance and Troubleshooting

5.1 Routine Maintenance Protocol

Periodic Maintenance Tasks:

  • Daily: Disinfect the forehead support with 70% alcohol.
  • Weekly: Clean the observation window with dedicated lens paper.
  • Monthly: Lubricate mechanical tracks with silicone-based lubricant.
  • Quarterly: Optical path calibration (requires professional service).

Consumable Replacement:

  • Printing Paper (Model 12441): Standard roll prints approximately 300 times.
  • Fuse Specifications:
    • 110V model: T 0.63AL 250V
    • 230V model: T 0.315AL 250V

5.2 Fault Code Handling

Common Alerts and Solutions:

CodePhenomenonSolution
E01Printer jamReload paper according to door diagram
E05Voltage abnormalityCheck power adapter connection
E12Calibration failurePerform manual calibration procedure
E20Communication errorRestart device or replace RS232 cable

For unresolved faults, contact the authorized service center. Avoid disassembling the device yourself to prevent voiding the warranty.

VI. Technological Expansion and Clinical Applications

6.1 Comparison with Similar Products

Compared to traditional refraction devices, the AR360 offers significant advantages:

  • Efficiency Improvement: Reduces single-eye measurement time from 30 seconds to 5 seconds.
  • Simplified Operation: Reduces manual adjustment steps by 75%.
  • Data Consistency: Eliminates manual interpretation discrepancies (CV value <2%).

6.2 Clinical Value Proposition

  • Mass Screening: Rapid detection in schools, communities, etc.
  • Preoperative Assessment: Provides baseline data for refractive surgeries.
  • Progress Tracking: Establishes long-term refractive development archives.
  • Lens Fitting Guidance: Precisely measures vertex distance for frame adaptation.

VII. Development Prospects and Technological Evolution

Although the AR360 already boasts advanced performance, future advancements can be anticipated:

  • Bluetooth/WiFi wireless data transmission
  • Integrated corneal topography measurement
  • AI-assisted refractive diagnosis algorithms
  • Cloud platform data management

As technology progresses, automated refraction devices will evolve toward being “more intelligent, more integrated, and more convenient,” with the AR360’s design philosophy continuing to influence the development of next-generation products.

This guide provides a comprehensive analysis of the technical principles, operational methods, and clinical value of the Reichert AR360 Auto Refractor. It aims to help users fully leverage the device’s capabilities and deliver more precise vision health services to patients. Regular participation in manufacturer-organized training sessions (at least once a year) is recommended to stay updated on the latest feature enhancements and best practice protocols.